


Setup
Your query should have a dimension that determines the number of hexagons, their labels and some way to determine color. The following table explains each field used in the example, including the calculation formulas.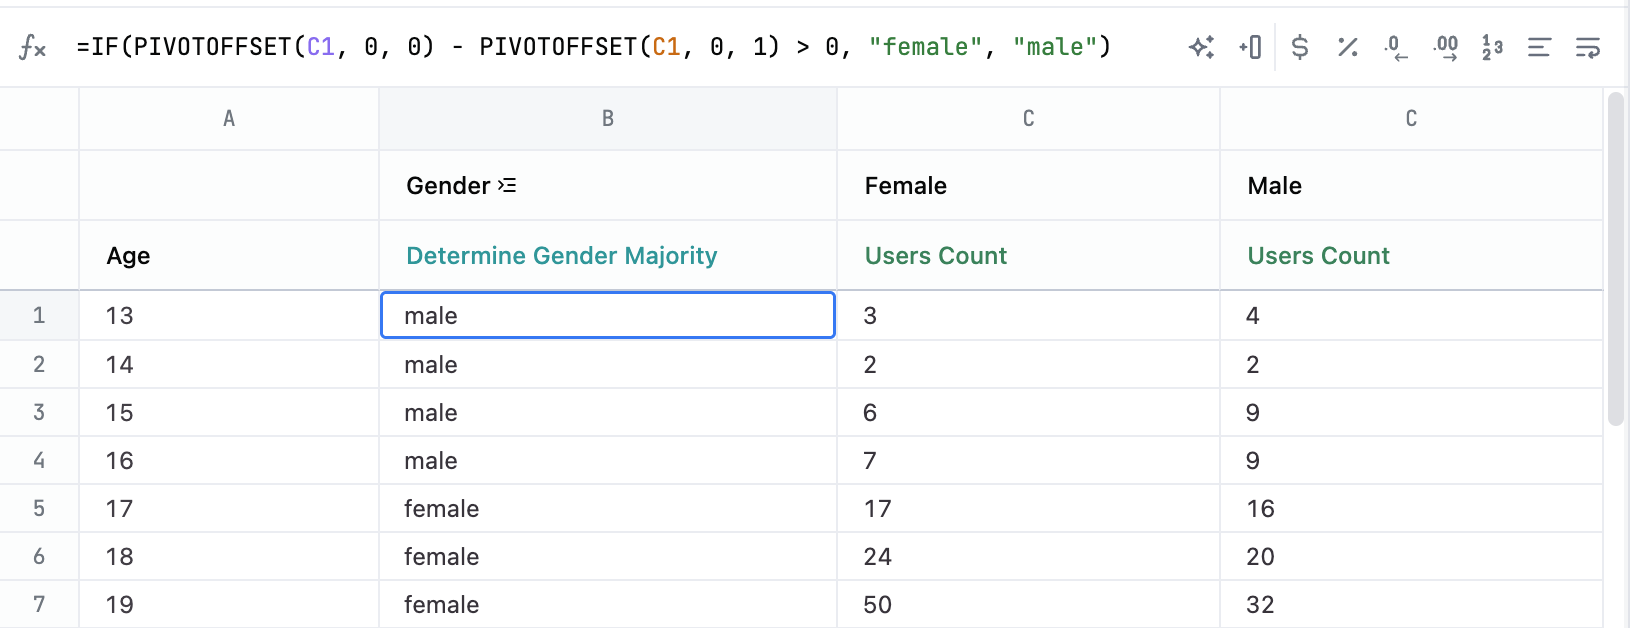
The code for this example can be used in the Markdown visualization to create a hexagonal grid with a label and value in each cell.