- Understanding query structure: See exactly how Omni is interpreting your point-and-click query building
- Creating sample queries: Quickly copy queries from workbooks to topic files for AI context and example queries
- Debugging queries: Compare the query configuration to the generated SQL to troubleshoot issues
- Learning YAML syntax: See how your UI actions translate to YAML configuration for modeling
Opening the inspector
There are two ways to open the inspector in a workbook:- Click View > Inspector
- Click the icon located near the bottom left corner of the page
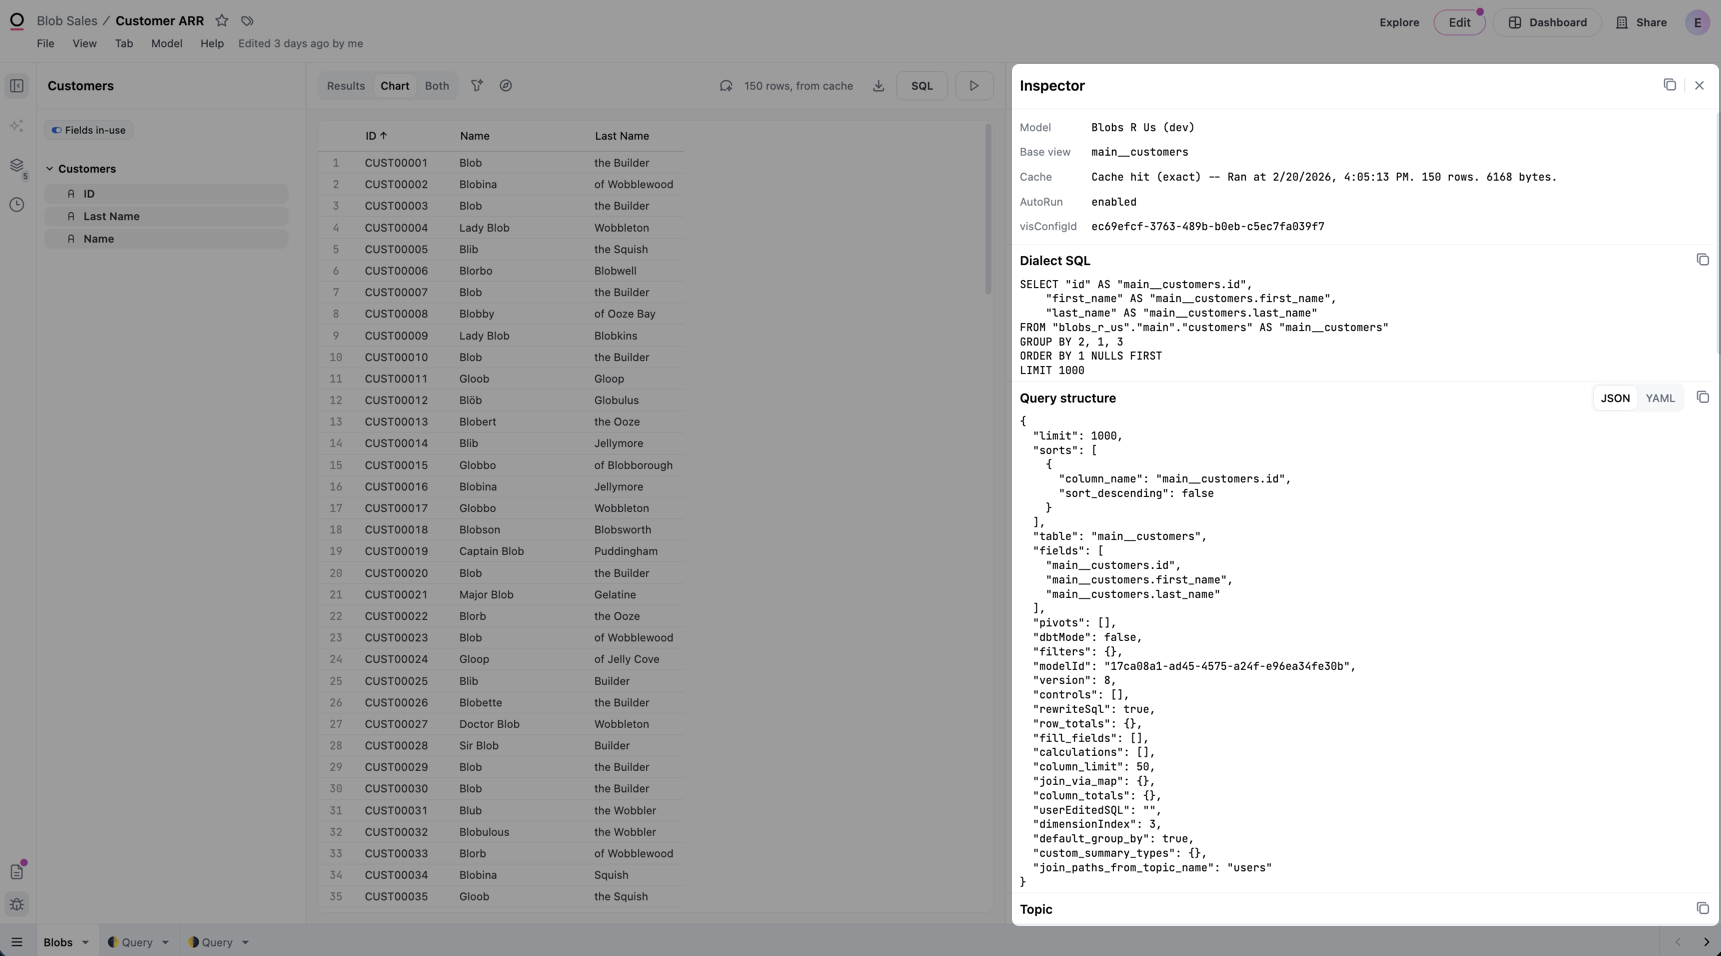
Inspector sections
The inspector contains a few sections:- Dialect SQL - Requires Querier or higher permissions. Displays the query written in the SQL dialect of the database backing the connection.
- Query structure - The query represented in Omni’s query language
- Vis config - The configuration of the visualization associated with the query, if any
- [
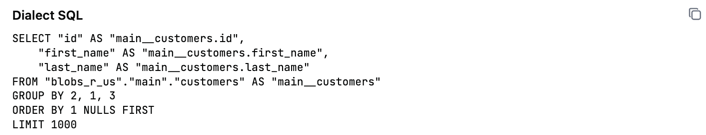
Dialect SQL
Querier permissions or higher are required to view dialect SQL.
Query structure
The Query structure section in the inspector displays the complete query configuration: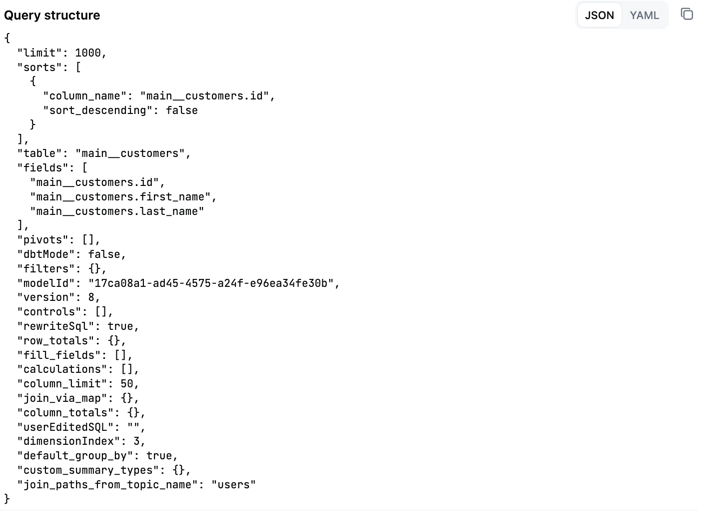
- Fields selected in the query
- Base view or topic
- Filters applied to the query
- Sorts and limits
- Calculations
- Pivots
- Period-over-period settings
Visualization configuration (vis config)
While the Vis Config section will be present even when viewing the results table, it may not be populated. This section of the inspector will only populate when viewing a visualization.
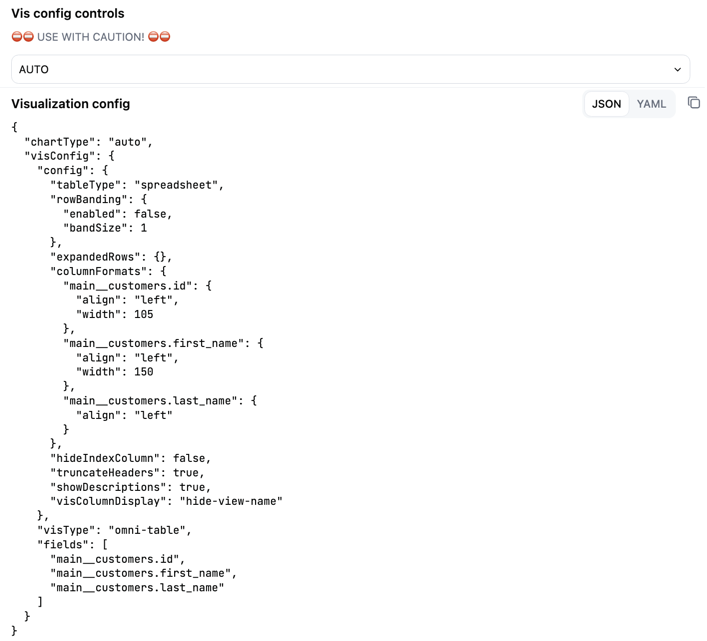
- Chart type
- Color configuration
- Axis settings
- Series configuration
- Other visualization-specific settings
AI messages
The AI messages section in the inspector displays information about the current AI session in the workbook, if one is active. If there isn’t an active session, this section won’t be visible. Along with the final generated query, this section includes:- Context passed to the LLM - Including Omni’s system instructions, model-level context, the current topic, and information about the prompting user
- Conversation transcript - Including user prompts, responses from the agent, tool calls and inputs, and tool results
Copying configuration
Each section in the inspector includes a copy button that allows you to copy the configuration to your clipboard:- Query structure copy button: Copies just the query configuration
- Visualization config copy button: Copies just the visualization configuration
-
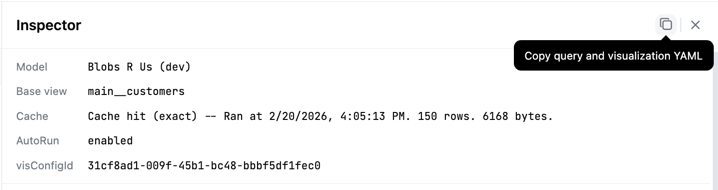
Copy query and visualization YAML button (in inspector header): Copies both the query and visualization configuration in the sample query format ready to paste into a topic file:
Copying queries to topics as sample queries
The YAML format in the inspector matches the structure used in topic sample queries. To add a query as a sample query to a topic:Next steps
- Learn more about sample queries in topics
- Read about building queries in workbooks
- Explore the model IDE