Setup
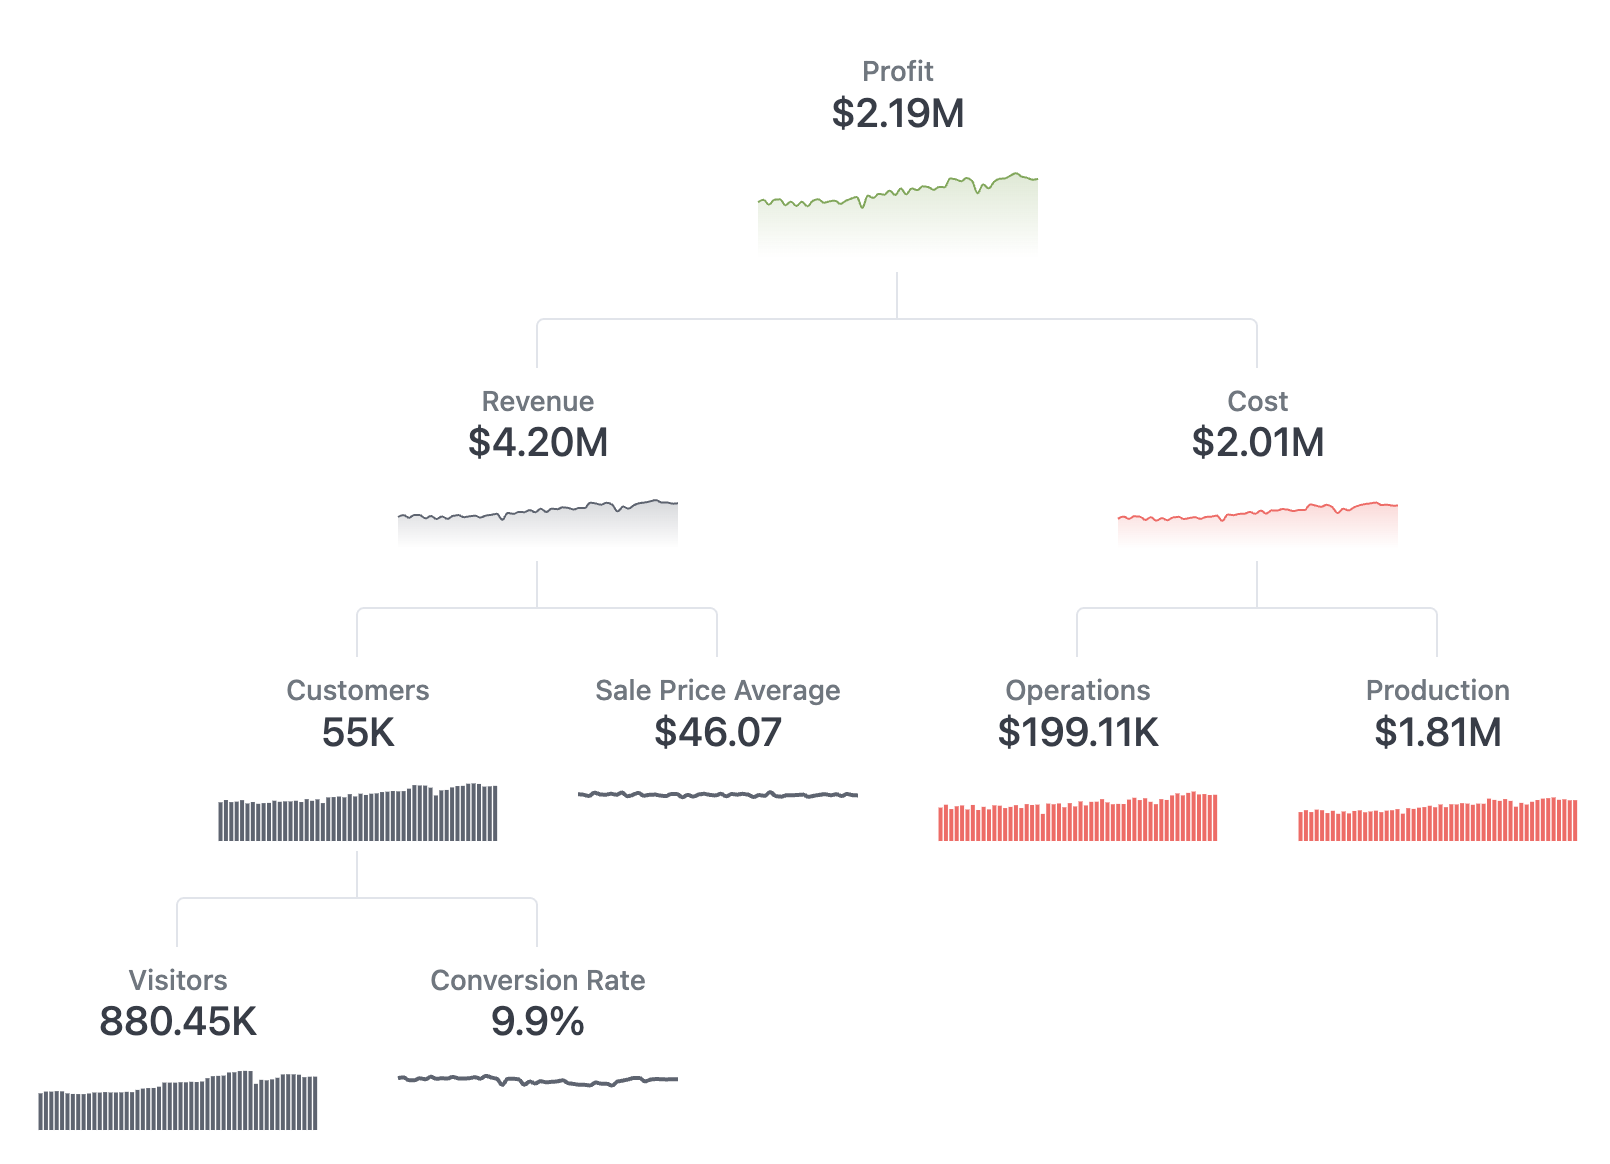
This tree is highly customized to this exact tree shape. If you’re willing to dig into some HTML/CSS it could be massaged to some other examples as well. It also leverages Omni’s sparkline component to draw the tiny chart. Below is the results set of sample data used to draw this tree.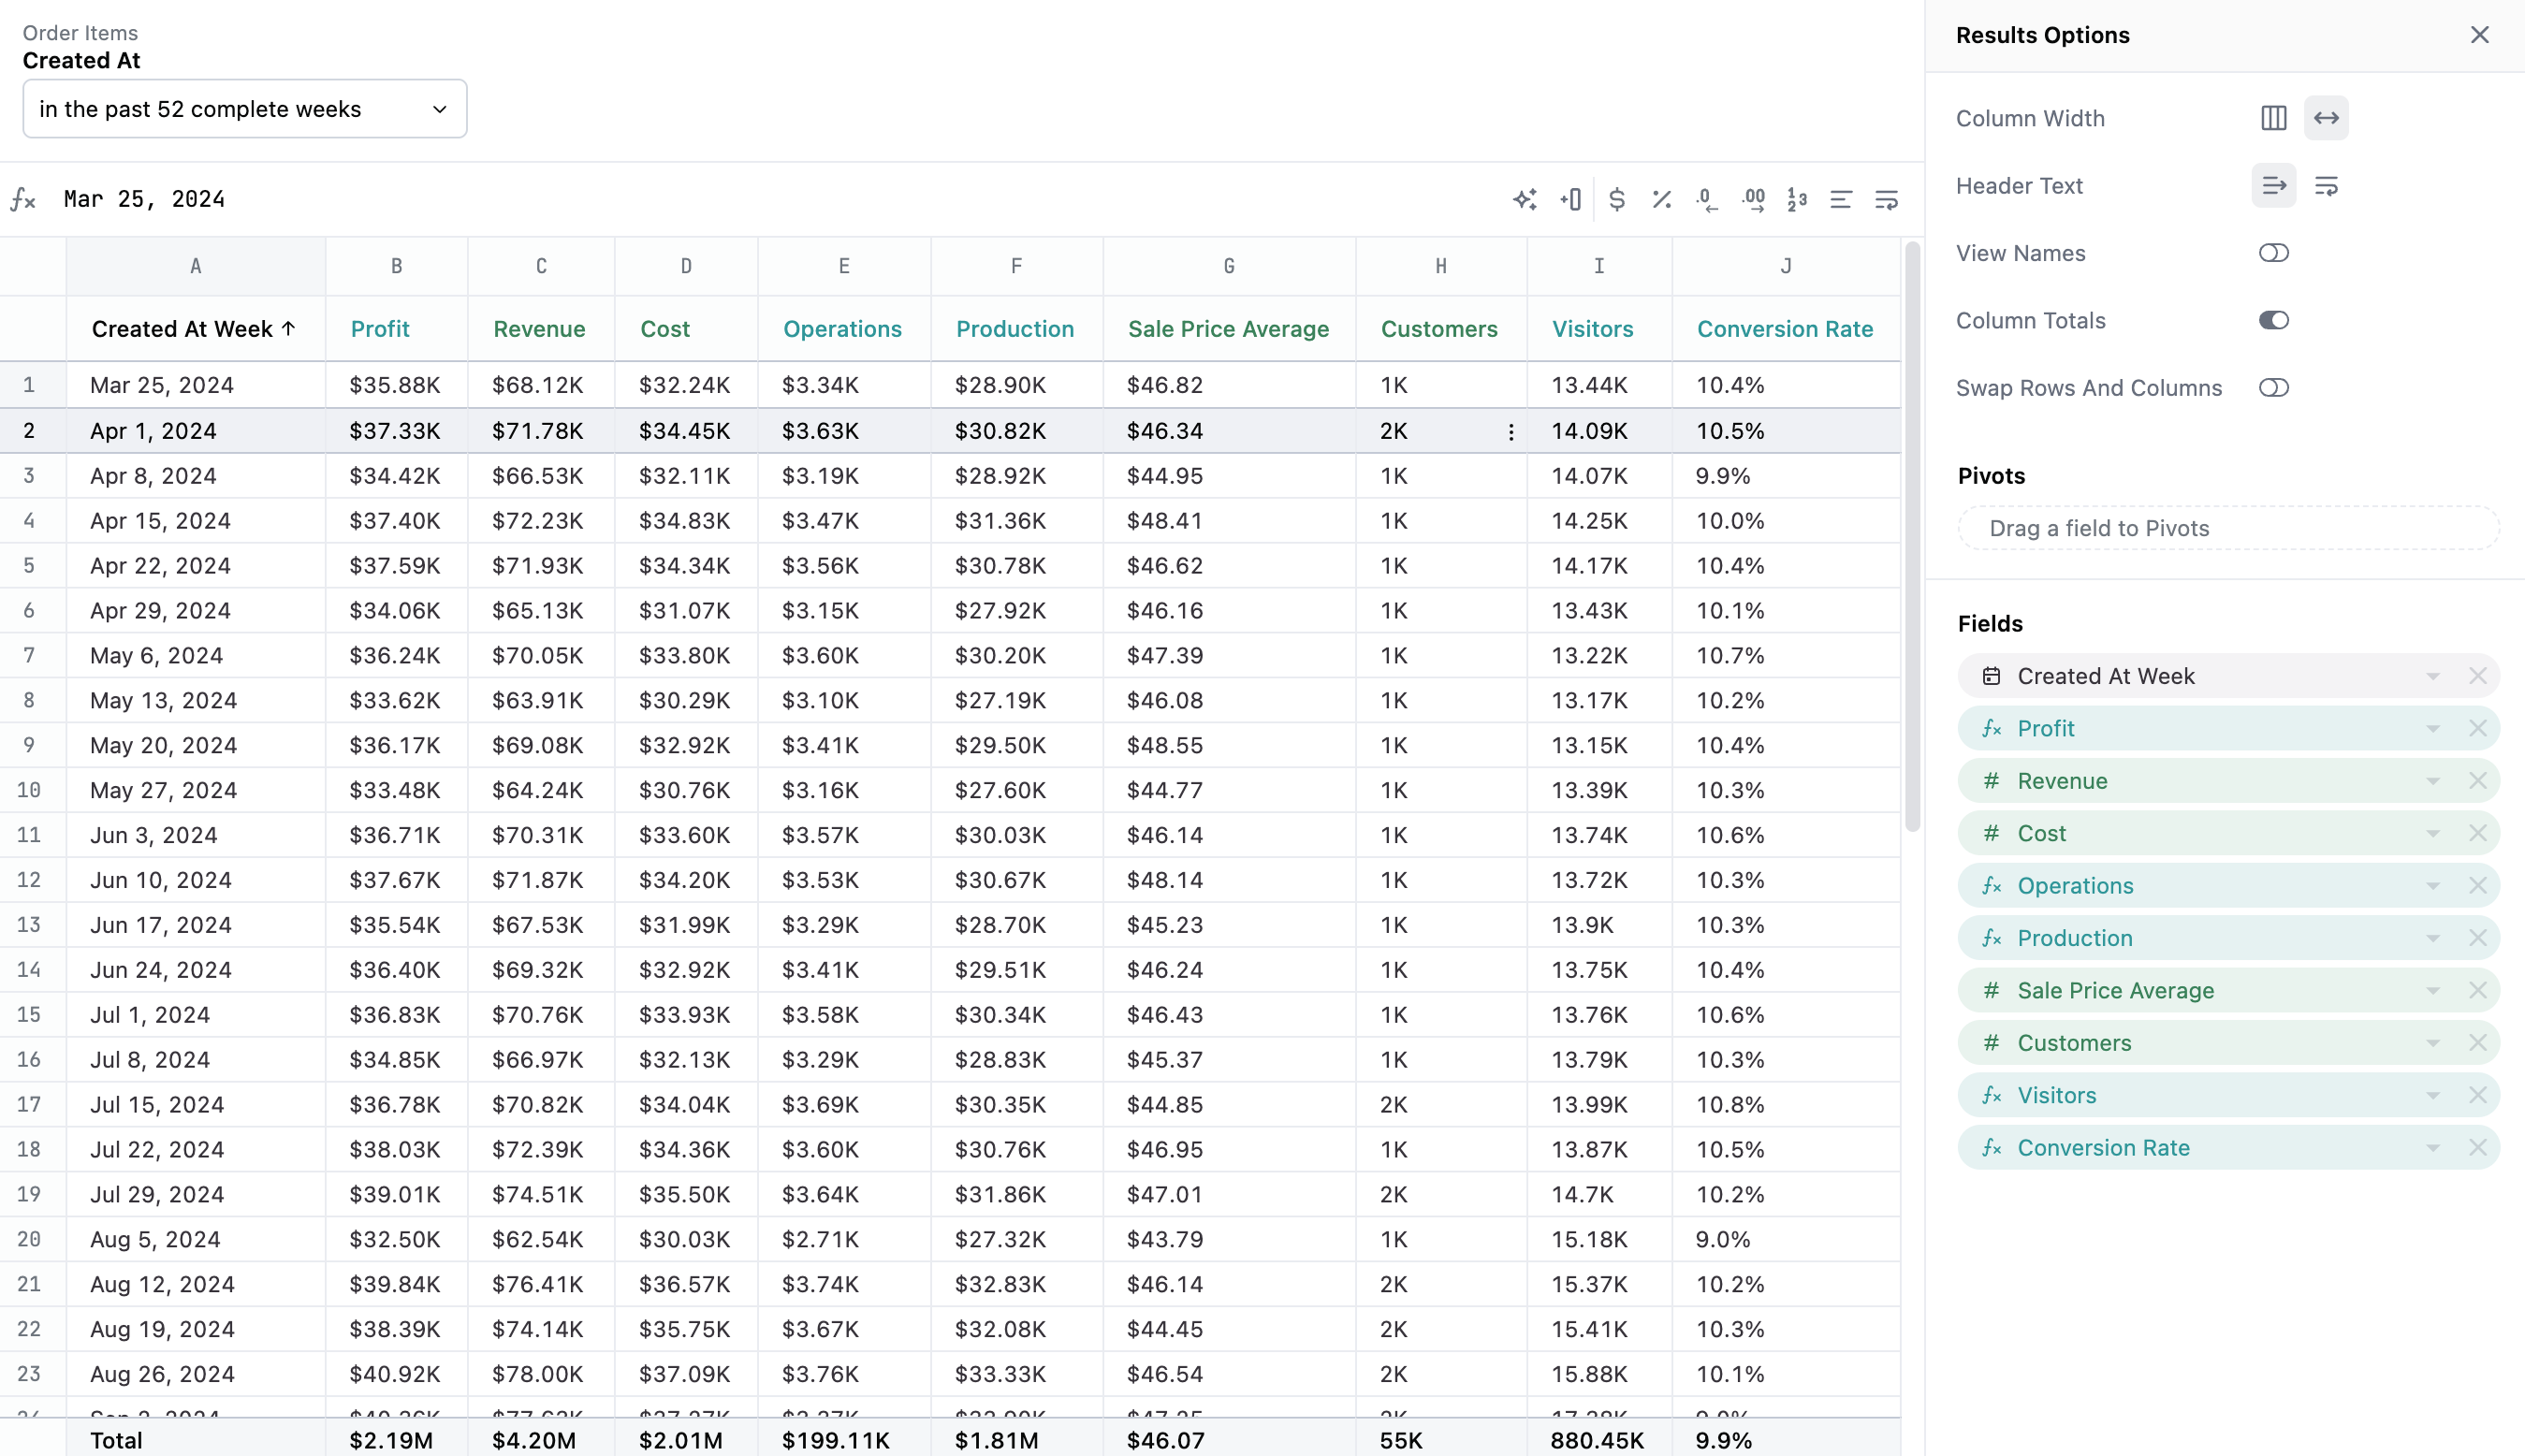
Example code
<style>
  .metric-tree {
  --node-gap: 20px;
  --node-width: 80px;
  --double-node-width: calc(var(--node-width) * 2 + var(--node-gap));
  --connector-color: var(--color-border2);
  --connector-style: solid;
  --connector-width: 1px;
  --connector-radius: 4px;
  --connector-height: 48px;
  list-style: none;
  margin: 0;
  padding: var(--size1);
  display: flex;
  flex-direction: column;

  & li {
    display: grid;
    justify-content: center;
    box-sizing: content-box;
  }
  & li.level1 {
    grid-template-columns: var(--double-node-width);
  }
  & li.level2 {
    grid-template-columns: repeat(3, var(--double-node-width));
  }
  & li.level3 {
    grid-template-columns: repeat(4, var(--double-node-width));
  }
  & li.level4 {
    grid-template-columns: repeat(5, var(--double-node-width));
  }
  & li.lines.level1 {
    grid-template-columns: calc(var(--double-node-width) * 2);
  }
  & li.lines.level2 {
    grid-template-columns: repeat(3, var(--double-node-width));
  }
  & li.lines.level3 {
    grid-template-columns: repeat(4, var(--double-node-width));
  }
  & li.lines .line {
    height: var(--connector-height);
    position: relative;
  }
  & li.lines .line .line-before {
    content: "";
    width: var(--connector-width);
    height: 50%;
    background: var(--connector-color);
    position: absolute;
    left: calc(50% - var(--connector-width));
  }
  & li.lines .line .line-after {
    content: "";
    border-color: var(--connector-color);
    border-style: var(--connector-style);
    border-width: var(--connector-width) var(--connector-width) 0px
      var(--connector-width);
    border-radius: var(--connector-radius) var(--connector-radius) 0 0;
    position: absolute;
    width: calc(100% - var(--connector-width));
    height: 50%;
    bottom: 0;
    left: calc(var(--connector-width) * -1);
  }
}
.metric-tree article.node {
  margin-inline: var(--node-gap);
  display: flex;
  flex-direction: column;
  justify-content: flex-end;
  border-color: var(--color-border1);
  border-radius: var(--connector-radius);
  border-width: 0;
  border-style: var(--connector-style);
  & .header {
    display: flex;
    flex-direction: column;
    padding: var(--size2);
  }
  & .graph {
    display: flex;
    flex-direction: row;
    justify-content: center;
    align-items: flex-end;
  }
}
.metric-tree {
  & h4 {
    padding: 0;
    margin: 0;
    text-align: center;
    display: none;
  }
  & h2 {
    padding: 0;
    margin: 0;
    text-align: center;
    font-size: var(--font-lg);
    line-height: 1.2;
  }
  & h3 {
    padding: 0;
    margin: 0;
    text-align: center;
    font-size: var(--font-sm);
    line-height: 1.2;
    color: var(--color-text1);
  }
}
.disclaimer {
  padding: 24px;
  width: 620px;
  margin: 0 auto;
  color: var(--color-text1);
  text-align: center;
}
</style>
<ul class="metric-tree">
  <li class="level1">
    <article class="node">
      <div class="header">
        <h3>{{fields.calc_1.label}}</h3>
        <h4>Our most important metric</h4>
        <h2>{{result._totals._first.calc_1.value}}</h2>
      </div>
      <div class="graph">
        <sparkline field="calc_1" height="60" width="150" type="area" color="#78A851" show-axis=""></sparkline>
      </div>
    </article>
  </li>
  <li class="level1 lines">
    <div class="line"><span class="line-before"></span><span class="line-after"></span></div>
  </li>
  <li class="level2">
    <article class="node">
      <div class="header">
        <h3>{{fields.order_items.total_sale_price.label}}</h3>
        <h4>Money from customers</h4>
        <h2>{{result._totals._first.order_items.total_sale_price.value}}</h2>
      </div>
      <div class="graph">
        <sparkline field="order_items.total_sale_price" height="40" width="150" type="area" color="#5D6471" show-axis=""></sparkline>
      </div>
    </article>
    <article class="empty"></article>
    <article class="node">
      <div class="header">
        <h3>{{fields.inventory_items.cost_sum.label}}</h3>
        <h4>Money we pay out</h4>
        <h2>{{result._totals._first.inventory_items.cost_sum.value}}</h2>
      </div>
      <div class="graph">
        <sparkline field="inventory_items.cost_sum" height="40" width="150" type="area" color="#FF6161" show-axis=""></sparkline>
      </div>
    </article>
  </li>
  <li class="level2 lines">
    <div class="line"><span class="line-before"></span><span class="line-after"></span></div>
    <article class="empty"></article>
    <div class="line"><span class="line-before"></span><span class="line-after"></span></div>
  </li>
  <li class="level3">
    <article class="node">
      <div class="header">
        <h3>{{fields.users.count.label}}</h3>
        <h4>that actually purchased stuff</h4>
        <h2>{{result._totals._first.users.count.value}}</h2>
      </div>
      <div class="graph">
        <sparkline field="users.count" height="40" width="150" type="bar" color="#5D6471" show-axis=""></sparkline>
      </div>
    </article>
    <article class="node">
      <div class="header">
        <h3>{{fields.order_items.sale_price_average.label}}</h3>
        <h4>per order</h4>
        <h2>{{result._totals._first.order_items.sale_price_average.value}}</h2>
      </div>
      <div class="graph">
        <sparkline field="order_items.sale_price_average" height="40" width="150" type="line" color="#5D6471" show-axis=""></sparkline>
      </div>
    </article>
    <article class="node">
      <div class="header">
        <h3>{{fields.calc_2.label}}</h3>
        <h4>What it took to make the stuff</h4>
        <h2>{{result._totals._first.calc_2.value}}</h2>
      </div>
      <div class="graph">
        <sparkline field="calc_2" height="40" width="150" type="bar" color="#FF6161" show-axis=""></sparkline>
      </div>
    </article>
    <article class="node">
      <div class="header">
        <h3>{{fields.calc_3.label}}</h3>
        <h4>Cost to move stuff around</h4>
        <h2>{{result._totals._first.calc_3.value}}</h2>
      </div>
      <div class="graph">
        <sparkline field="calc_3" height="40" width="150" type="bar" color="#FF6161" show-axis=""></sparkline>
      </div>
    </article>
  </li>
  <li class="level3 lines">
    <div class="line"><span class="line-before"></span><span class="line-after"></span></div>
  </li>
  <li class="level4">
    <article class="node">
      <div class="header">
        <h3>{{fields.calc_4.label}}</h3>
        <h4>to our website</h4>
        <h2>{{result._totals._first.calc_4.value}}</h2>
      </div>
      <div class="graph">
        <sparkline field="calc_4" height="40" width="150" type="bar" color="#5D6471" show-axis=""></sparkline>
      </div>
    </article>
    <article class="node">
      <div class="header">
        <h3>{{fields.calc_5.label}}</h3>
        <h4>Description</h4>
        <h2>{{result._totals._first.calc_5.value}}</h2>
      </div>
      <div class="graph">
        <sparkline field="calc_5" height="40" width="150" type="line" color="#5D6471" show-axis=""></sparkline>
      </div>
    </article>
  </li>
</ul>
<P class="disclaimer">This tree is highly customized to basically this exact metric tree shape. If you're willing to dig into some html/css it could be massaged to some other examples as well.</P>