

Embed dbt platform data health tiles in Omni dashboards and apps
Data health tiles come from the dbt platform, formerly dbt Cloud, on its Enterprise plans. dbt Core doesn’t have them.
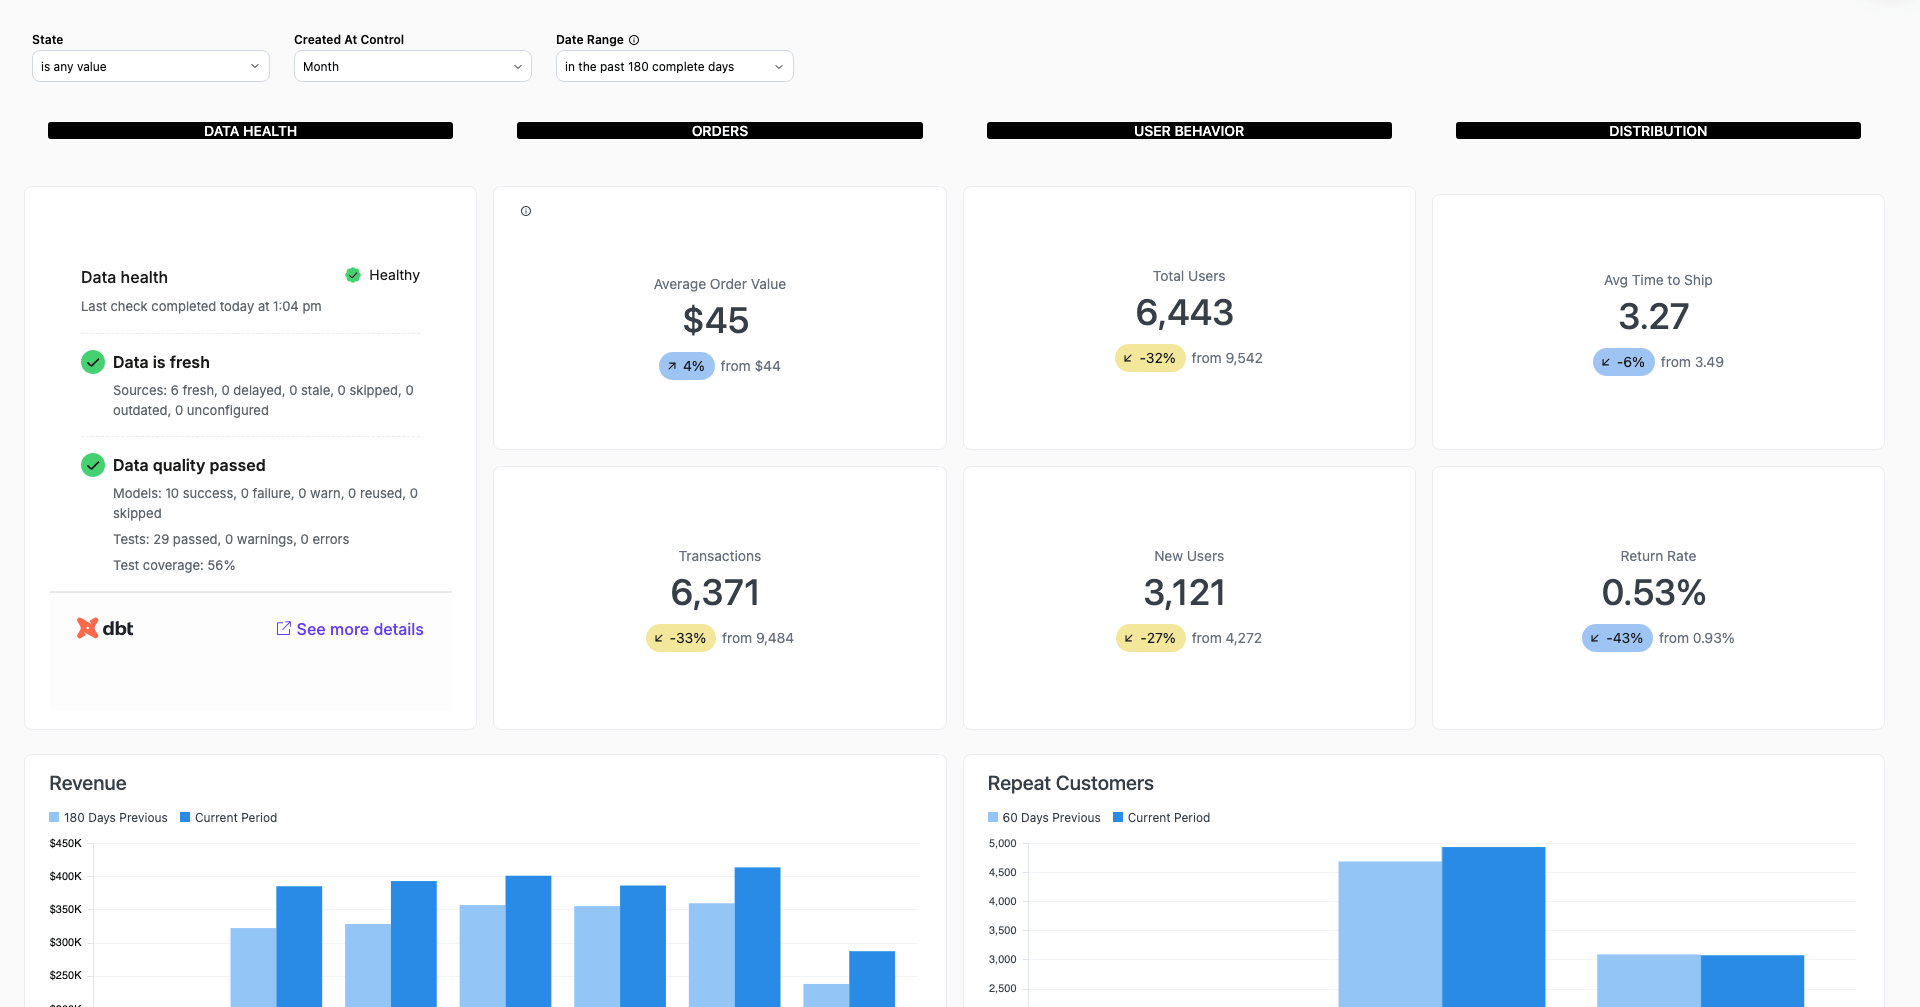
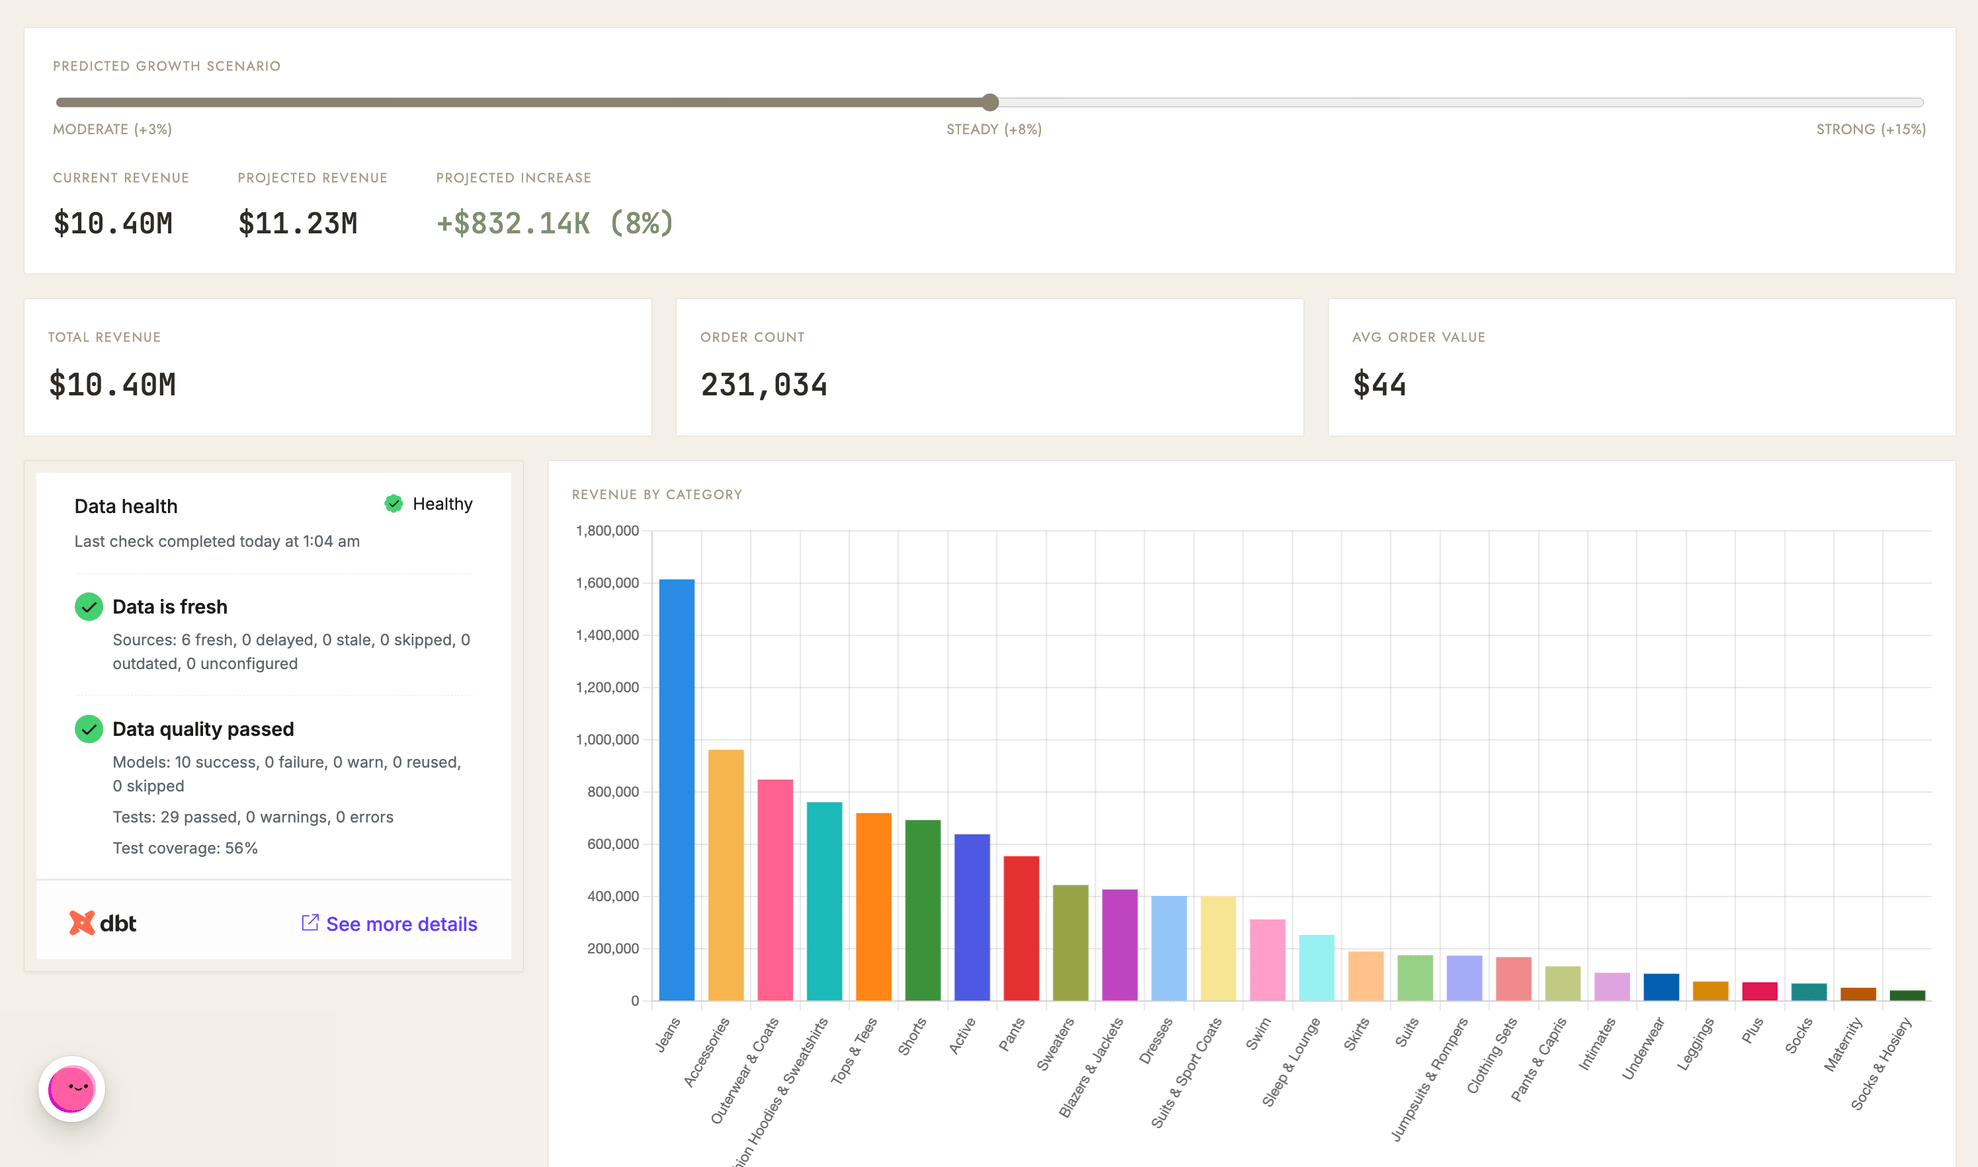
- Freshness status, such as
Data is fresh, based on source freshness checks - Quality status, such as
Data quality passed, based on test results - A breakdown of upstream source and model health, with links into dbt Catalog
Requirements
To follow the steps in this guide, you’ll need:- Permission to edit the Omni dashboard or app where you’ll add the tile
- For apps, an Organization Admin to allow the dbt host in the organization’s app settings
- For dbt:
- A dbt platform account on the Enterprise or Enterprise+ plan. See the dbt data health tile documentation for current plan requirements.
- A dbt exposure for your dashboard or app, defined manually or pushed from Omni
- Source freshness enabled in the dbt job that generates the exposure
- A Metadata Only service token, created by a dbt account admin in Account Settings > API tokens > Service tokens
The token sits in the iframe URL, so anyone who can read the dashboard’s Markdown tile source or the app’s HTML can read the token. Only use a Metadata Only service token, which limits access to dbt metadata and can’t modify your dbt account.
Copy the iframe snippet from dbt
- In dbt, open the exposure for your dashboard or app.
-
Copy the embed snippet. It looks something like this:
-
Replace the placeholders, such as
<YOUR_ACCOUNT_PREFIX>. The dbt documentation explains each URL parameter.
Add the iframe to Omni
- Dashboards
- Apps
- In Omni, open the dashboard.
- Click Edit.
- Add a text tile to the dashboard.
-
Paste the iframe snippet from step 1 into the Markdown editor. On its own, the tile renders at a fixed size. To make it fill the text tile instead, wrap the iframe like this:
- Publish the dashboard.
Troubleshooting
The tile doesn't render or appears blank in a dashboard
The tile doesn't render or appears blank in a dashboard
- Check the URL parameters. The exposure
uniqueId,environmentId, and token must all be valid. If you’re unsure, copy a fresh snippet from dbt. - Check the token type. The token must be a Metadata Only service token.
- Check for sandboxing limits. Omni sandboxes the iframes it renders, so some site features don’t work inside one.
The tile doesn't load in an app
The tile doesn't load in an app
- Read the message on the tile. When Omni blocks an embed, the app draws a message over the frame that says which setting blocked it.
- Check the organization settings. In Settings > Apps, the Frame policy must be Open, or Custom with the dbt host listed. The dbt host must also fall within the External source policy, and a Custom list there replaces Omni’s default hosts.
- Check the app settings. Allow embedded frames must be on, and the Embedded frames field must hold the dbt host. A host outside your organization’s list is flagged as one that won’t load.
- Check the host value. It must match the domain in the iframe URL, such as
ab123.metadata.us1.dbt.com, or a wildcard that covers it.
The tile renders but shows no health data
The tile renders but shows no health data
- Verify the exposure exists in the environment the URL points to. Dashboard exposures use
type: dashboard, and app exposures usetype: application. - Verify source freshness is enabled in the dbt job that generates the exposure. Without it, dbt has no freshness status to report.
Next steps
- Push exposures to dbt. Generate the exposures a health tile reads, straight from your Omni dashboards and apps.
- Markdown visualizations. Other things you can put in an iframe or a Markdown tile.
- App settings. The settings that decide what an app can load and embed.