

When to use this pattern
Use this pattern when the regions in your dataset don’t fit any single built-in map type. Examples:- A dataset with both US and Canadian locations, where you want one map instead of two.
- A custom sales territory map built from several source boundary files, such as states grouped into regions.
- Any geography a third-party GeoJSON source defines that Omni doesn’t offer natively.
Requirements
To follow the steps in this guide, you’ll need:- Restricted Querier or higher permissions, to configure a region map’s visualization settings.
- An AI coding tool, such as Claude Code, to merge the GeoJSON files.
- A place to host the combined file with CORS-enabled raw access, such as a public GitHub repository.
- A dataset field with matching values, like a 2-letter region code, to join your data against the merged boundaries.
Steps
Gather boundary files
Find a GeoJSON source for each geography you want to combine. For example, a Canadian provinces GeoJSON file and a US states GeoJSON file. Download both into the same local directory.
Merge the files with AI
Prompt your AI coding tool to combine the files into a single The property name has to match a field in your dataset. In this example,
FeatureCollection and add a shared property you can join against your dataset. For example:Prompt used to merge CA provinces and US states
short_name pairs with a column of 2-letter state and province codes. Ask the AI tool to verify the merged file is valid GeoJSON before moving on.Host the combined file
Omni loads custom region data from a URL, so the merged file needs to be hosted somewhere with CORS-enabled raw access, such as a public GitHub repository.Commit the file and use its raw file URL. For example:
Completed example
exploreomni/geo-data is a public example of this pattern: a GeoJSON file combining Canadian provinces and US states, each with ashort_name property holding its 2-letter code.
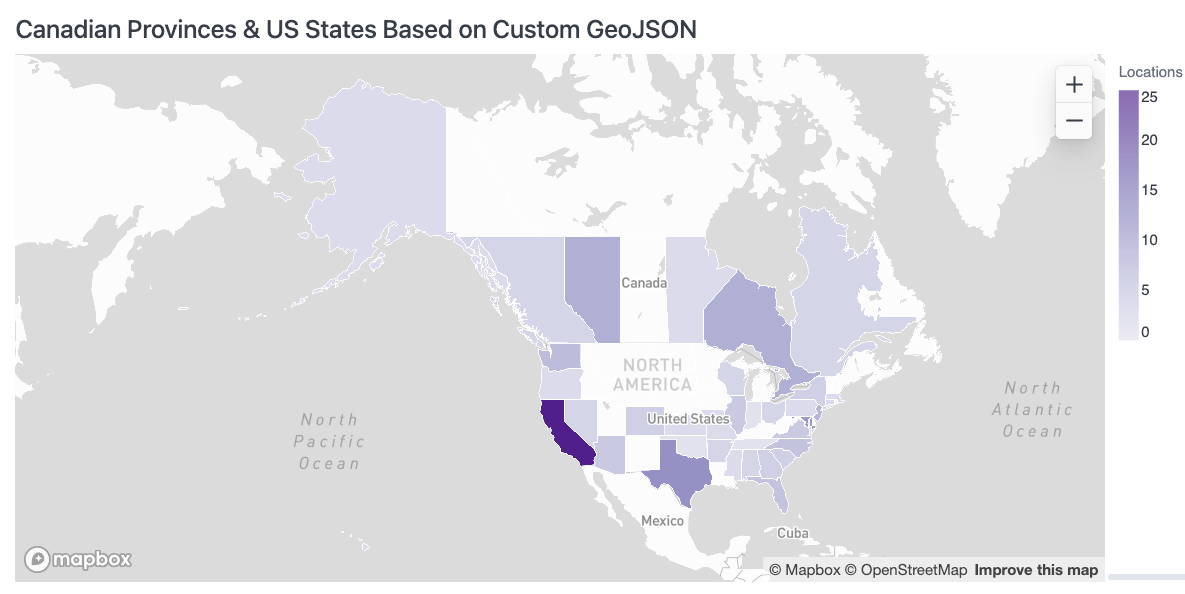
A region map built from the combined GeoJSON, colored by location count across US states and Canadian provinces.
Next steps
- Maps - Supported map types and region options.
- Color by / Stacking - Pin gradient color scale values for consistent intensity coloring.
- Custom visualizations - Go further with Vega-Lite for map layouts a region map can’t support.
- Apps - Go even further with custom data experiences backed by live, governed data.