- Add the filter by picking the field it’s based on.
- Configure how it behaves — set a default value, choose how it’s displayed, or hide it from viewers.
- Map it to tiles — Omni does this automatically for matching fields, but you can remap or disable per tile.
Requirements
Creating and modifying filters requires Editor, Manager, or Owner permissions on the document.Add a filter
1
Add the filter
- In a dashboard in edit mode, click Add > Filter. The filter panel will open on the right side of the page.
-
In the filter panel, choose the field you want the filter to be based on. The field you pick determines:
- Where suggested filter values come from
- Which field on each dashboard tile Omni initially maps the filter to (you can change this per tile later)
- The type of field the filter can apply to (string, numeric, date)
- Click Add to create the filter.
2
Configure filter settings and behavior
In the Settings tab, add information about the filter and define how it should behave:
- Label - The name of the filter as it displays to dashboard viewers
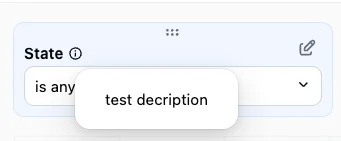
- Description - What the filter does or how to use it. Viewers see an icon next to the filter name; the description displays on hover:
- Filter type - Defines how the filter displays on the dashboard. Only appears when the source field is a string or date.
- Default value - Defines a default value for the filter, which pre-loads when the dashboard is opened. See Set a default value for more information.
- Apply to new queries - When enabled, the filter will be automatically applied to new queries added to the dashboard
- Require a value for this filter - When enabled, viewers must select a value for the filter before they can view data
- Hide this filter when viewing the dashboard - See Hiding filters from viewers
3
Map to tiles
The Mapping tab in the filter editor allows you to manage the filter’s connection to query tiles on the dashboard. By default, Omni automatically maps the filter to tiles that use a matching field.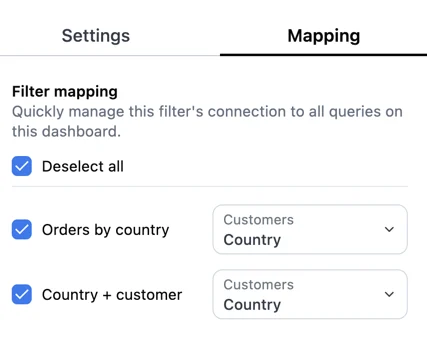
Configure filter behavior
Set a default value
Filters can have default values, which will pre-load when the dashboard opens. Default values also override any workbook-level filters on the same field. To set a default value, open the filter editor and use the Default value field in the Settings tab. What you can select depends on how the Filter type is configured:-
If Filter type is set to Advanced, you can define a condition using the filter dialog:
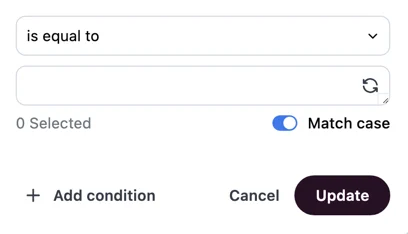
-
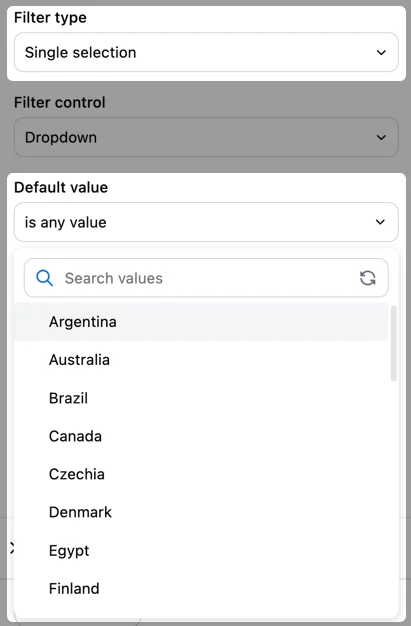
If Filter type is set to any other option, the default value picker matches that filter type. For example, if a string filter is set to Single selection, you can only select a single option from a list of suggestions:
Select display options
This feature is not available for classic dashboards.
Hide a filter from viewers
To hide a filter, enable Hide this filter when viewing the dashboard in the filter editor’s Settings tab. The filter value still applies to connected tiles and the value can still be set via the dashboard’s URL, but viewers won’t see the filter on the dashboard.Hiding a filter does not restrict data access. To restrict access to data, use access filters, which enforce data access at the model layer.
Map the filter to tiles
By default, Omni maps the filter to any tile with a matching field. You can change which field it maps to per tile, disable it on specific tiles, or map it to a calculation defined in a tile’s query.Filters don’t automatically apply to custom-written SQL queries. See dynamic filtering in SQL to make a SQL tile respond to dashboard filters.
Map to different fields per tile
You can map a filter to a tile and select a different field for the filter to use. For example, you might want a date filter to updateuser_created_at on one tile and orders_created_at on another.
To change the field mapping for a tile:
- Open the filter editor for the filter.
- Click the Mapping tab.
-
Use the dropdowns next to the tile titles to select a different field:
Map to a calculation
In addition to view fields, you can map a filter to calculations defined in a tile’s query. When editing a filter and selecting the field mapping for a tile, calculations appear in a separate Calculations group in the dropdown. This lets you apply a dashboard filter to a custom calculation without defining it as a field in your model: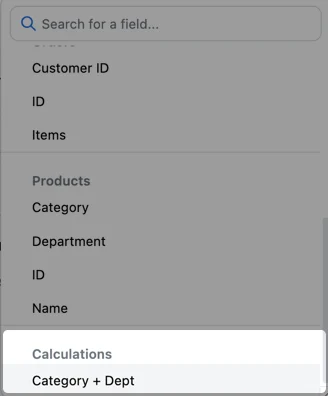
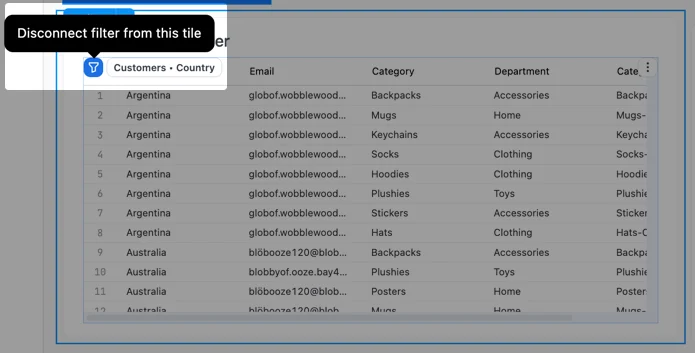
Disable a filter on specific tiles
There are two ways to disable a filter on specific tiles:- In the filter editor’s Mapping tab, deselect the tile
-
Select the filter on the dashboard, then click the icon in the upper left corner of the tile:
Troubleshooting
A filter isn't showing options for a tile when I try to connect it
A filter isn't showing options for a tile when I try to connect it
Field types must match — a string filter only maps to string fields, a date filter only to date fields, and so on. Fields with unknown types won’t show as matches either.
A SQL tile isn't responding to a dashboard filter
A SQL tile isn't responding to a dashboard filter
Filters don’t automatically apply to custom-written SQL. See dynamic filtering in SQL.
Next steps
- Filter display options — show filters as buttons, dropdowns, single-day pickers, or timeframe controls
- Filter interactivity — cross-filtering and faceted filters
- Dashboard settings — enable cross-filtering and faceted filters at the dashboard level
- Dynamic filter controls - allow dashboard viewers to add their own filters
- Adding dashboard filters to workbook queries — easily add dashboard filters when editing in workbook using filter suggestions