Editing charts
How you edit charts on a dashboard depends on the type of dashboard you’re using:- New dashboard editor
- Classic dashboard editor
When you select a chart item on a dashboard, the properties panel will show chart settings inline, allowing you to edit visualization configuration without leaving the layout editor.In the properties panel, you can edit the chart’s:
- Title, subtitle, and description
- Visualization type
- Visualization settings such as colors, axes, stacking, and other display options
If your dashboard has filters and you’re editing a chart in a workbook, note that workbook results may differ from what’s on the dashboard. This is because dashboard filters aren’t applied to workbook queries. However, you can easily add dashboard filters to the workbook query using the Filters from dashboard dropdown in the query’s filter bar. See Adding dashboard filters to workbook queries for more information.
Adding chart subtitles and descriptions
Editing a chart on the dashboard allows you to add an optional subtitle and description to the chart. To have Omni’s AI write the subtitle or description, click the icon and toggle Let AI write the subtitle/description to on. You can also provide additional context to the AI to guide the results.Inserting query text items
Query text items display your query’s name, subtitle, description, or AI-generated summary as dashboard content that maintains a live binding to the source query. Unlike static text tiles, query text items automatically update when you change the query’s metadata in the workbook. This is useful when you want dashboard titles, descriptions, or context to stay synchronized with query changes without manual updates. To insert query text:- Right-click a chart tile in a container.
- Select an option:
- Insert query text - Insert the query’s title, subtitle, description, or All available
- Insert AI summary - Insert an inline or tooltip AI summary of the query. Use the properties panel to add additional context to the summary.
- Insert results - Insert a table of the query’s results
Converting metadata to editable text
Convert metadata items and AI summaries to editable text (or vice versa) by right-clicking on the chart and selecting Convert to: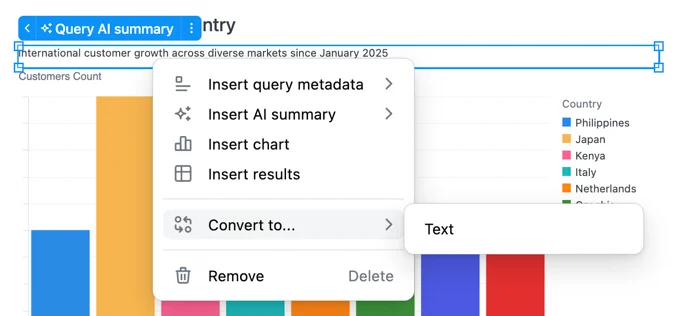
Convert submenu for query metadata and AI summary items
- Markdown text - Converts the metadata item to a text tile with a Mustache template (e.g.,
{{queries.<id>.name}}) that preserves live binding to the query - AI summary - Converts an editable text item to an AI-generated summary
Detaching and hiding query text items
Query text items can be detached from their source query or hidden from dashboard viewers.Detaching query text items
When you detach a query text item from its source query, the item becomes static text that no longer updates when the underlying query metadata changes. This is different from converting to Markdown text, which preserves the live binding through Mustache templates:- Converting to Markdown text - Maintains a live connection to the query via
{{queries.<id>.name}}template syntax. The text updates automatically when query metadata changes. - Detaching - Breaks the connection to the query. The text becomes static and will not update when query metadata changes.
Hiding query text items
You can hide query text items from dashboard viewers while keeping them available for editing. This allows you to temporarily remove content from the dashboard view without deleting it.Hiding charts
In some cases, you may not want charts to be visible on the dashboard. The underlying data may be important for the workbook, but you don’t want viewers to interact with the data. Other dashboard queries, however, can still access hidden tiles (withXLOOKUP).
Charts that are excluded from the dashboard will not run on the dashboard unless they are invoked by another query (i.e. XLOOKUP, alert, or used in a filter).
- New dashboard editor
- Classic dashboard editor
Click the chart on the dashboard to open the properties panel. Then click the icon to remove it from the dashboard.Removing the chart in this way doesn’t delete the underlying workbook query - it only removes the chart from the dashboard.
Copying charts and links
On a chart, click the icon that displays. Then, select Copy to view options for copying charts and links:- To another dashboard or workbook: Copy the tile to a different dashboard or workbook. This works similarly to copying a workbook tab to an existing workbook.
- Link to workbook tab: Copy a direct link to the tile’s underlying workbook tab to your clipboard
Interacting with table tiles
Dashboard tiles containing table visualizations support spreadsheet-style selection, copying, and cell interaction. Dashboard tables are read-only — editing, column reordering, and calculation features are only available in workbook tables. For a full list of keyboard shortcuts, see Table shortcuts.Selecting cells
- Click a cell to select it
- Click and drag across cells to select a rectangular region
- Shift+click a cell to select a range from the anchor to the clicked cell
- Command+click (Mac) or Ctrl+click (Windows) a cell to add or remove it from your selection
- Click a row number to select an entire row. Combine with Shift to extend the selection or Command/Ctrl to toggle the row.
- Click a column header to select an entire column. Combine with Shift to extend the selection or Command/Ctrl to toggle the column.
- Arrow keys to move the focused cell. Hold Shift to extend the selection.
- Command+A (Mac) or Ctrl+A (Windows) to select all cells
- Escape or click outside the table to clear the selection
Copying cells
Select one or more cells, then press Command+C (Mac) or Ctrl+C (Windows) to copy the selected values to your clipboard. Copied data uses a tab-separated format, so pasting into Excel or Google Sheets automatically places values into the correct cells. When all cells are selected withCommand + A / Ctrl + A, column headers are included in the copied output.