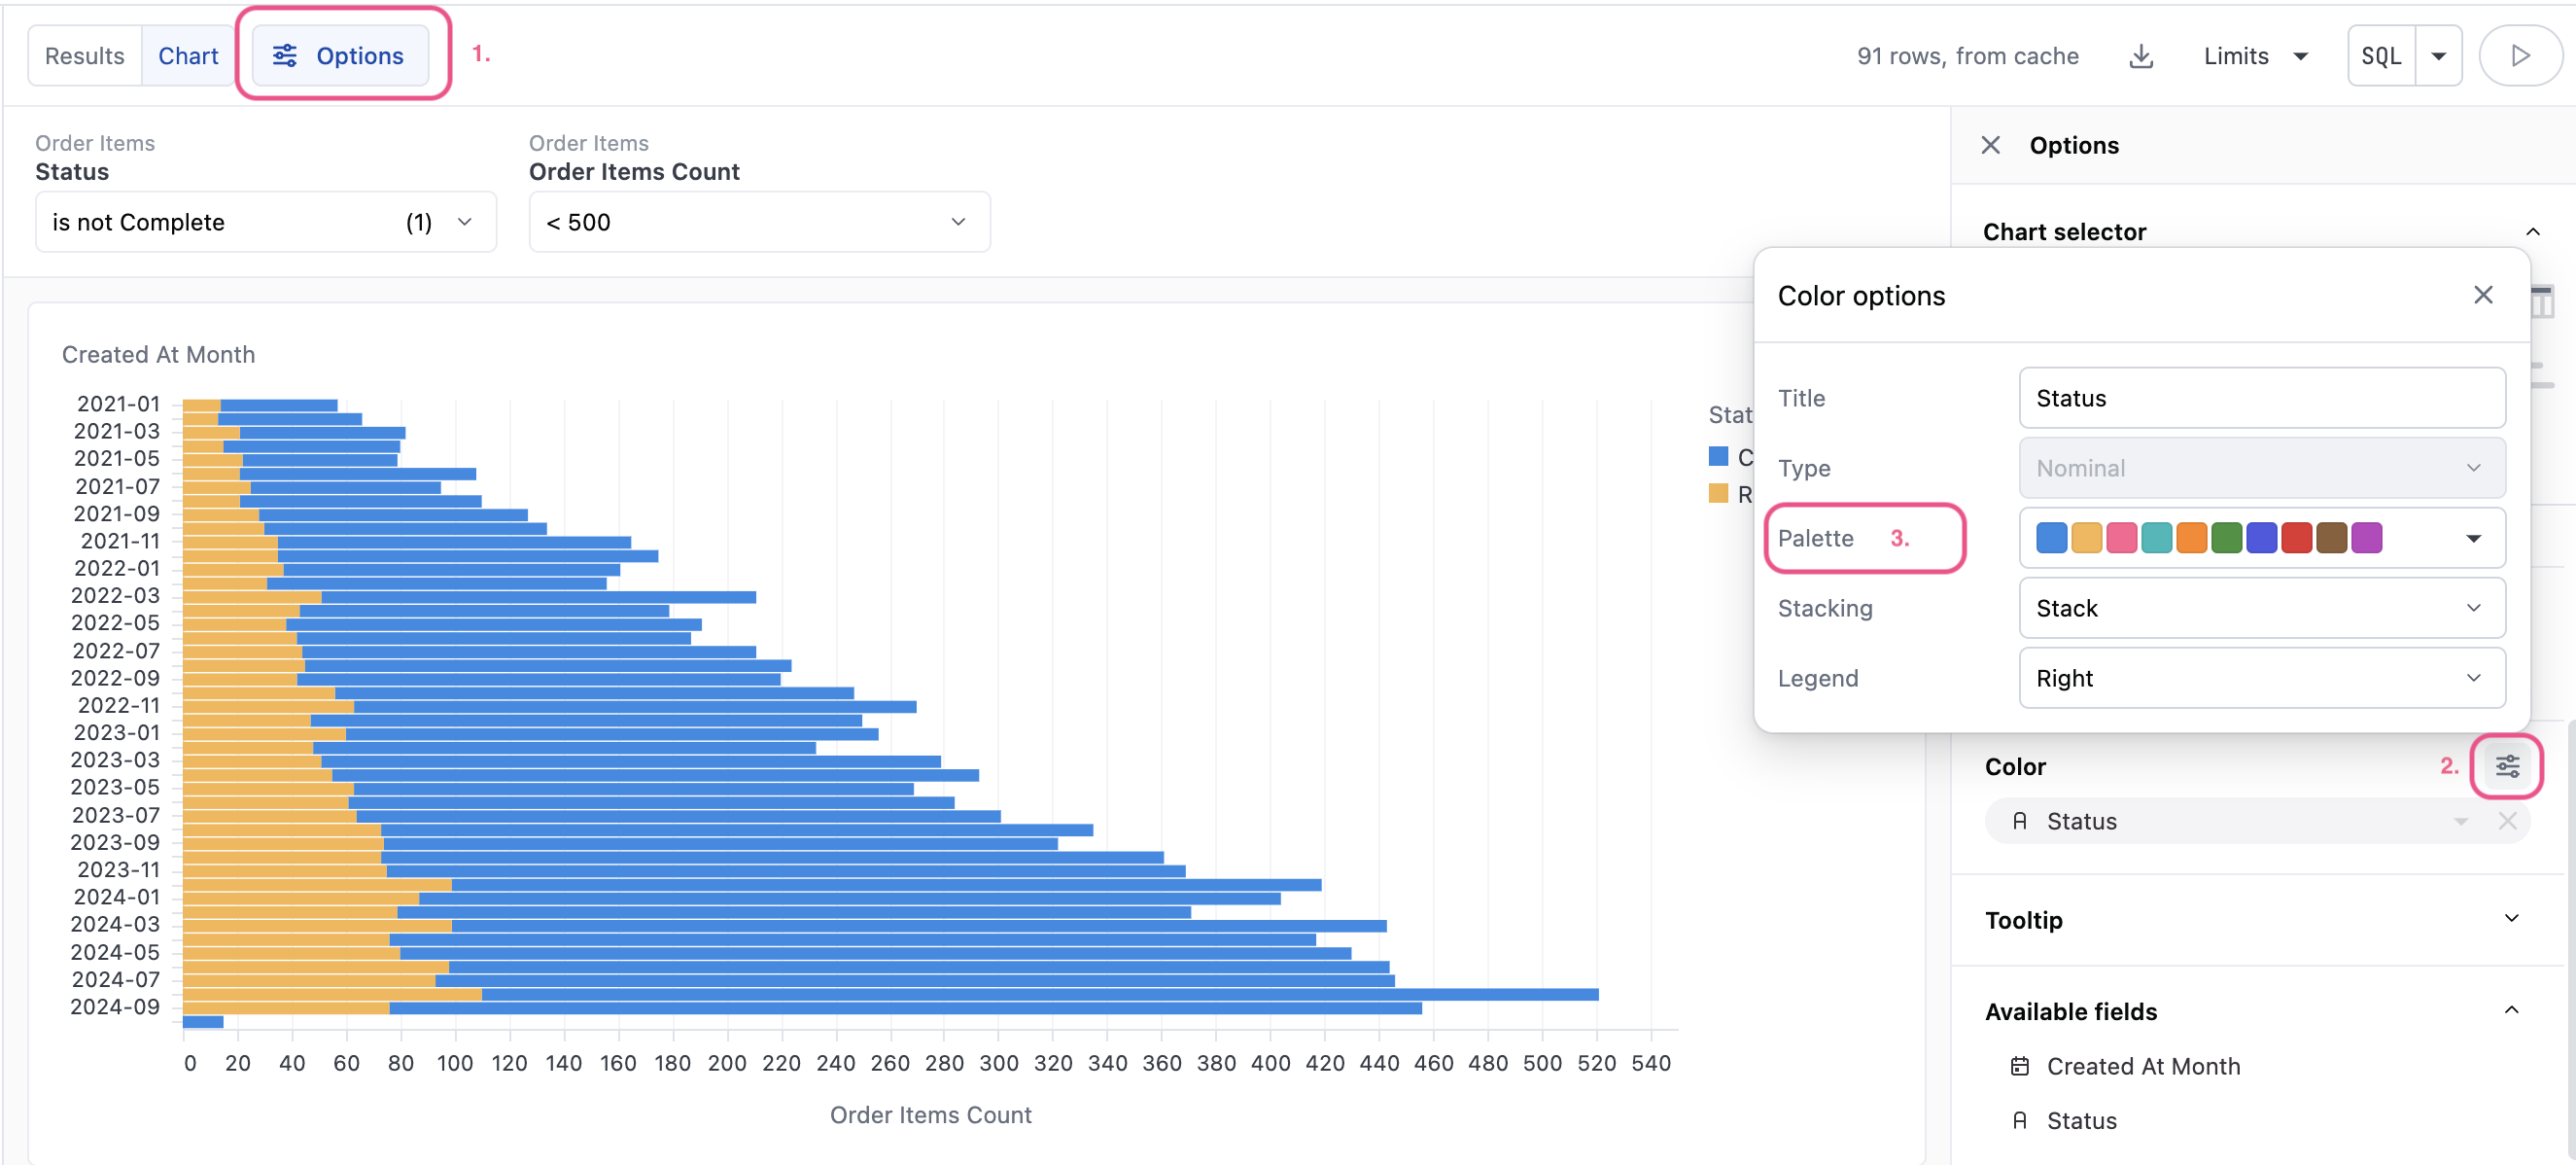
Chart palettes can only be used in X/Y style charts such as bar, scatter, line, etc.
Chart palettes are currently only used for color faceting. You can access the chart palettes from the Options panel in the Color > Options popup. Any custom palettes created for the organization will appear in the list before the built-in palettes.For more on using palettes in visualizations, see the Color by / Stacking documentation.
Was this page helpful?
Assistant
Responses are generated using AI and may contain mistakes.