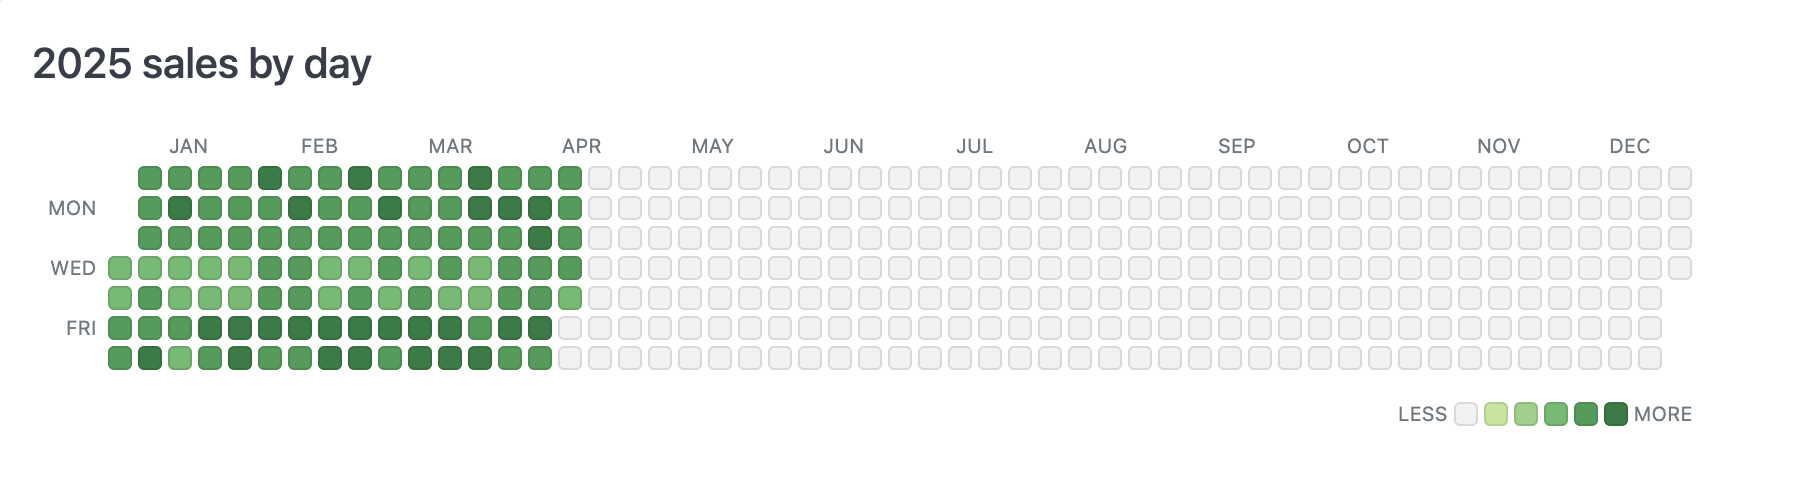
Calendar heatmap
Calendar cells colored by a value
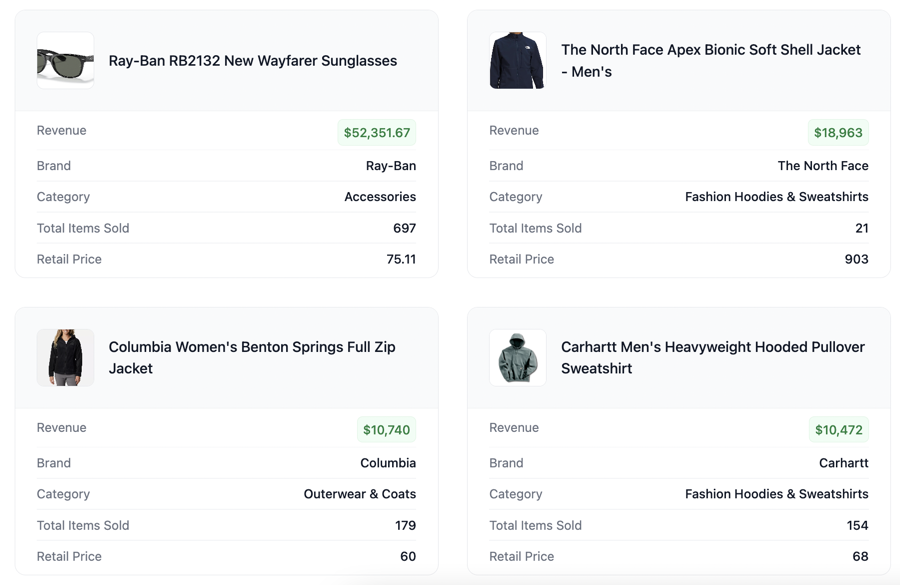
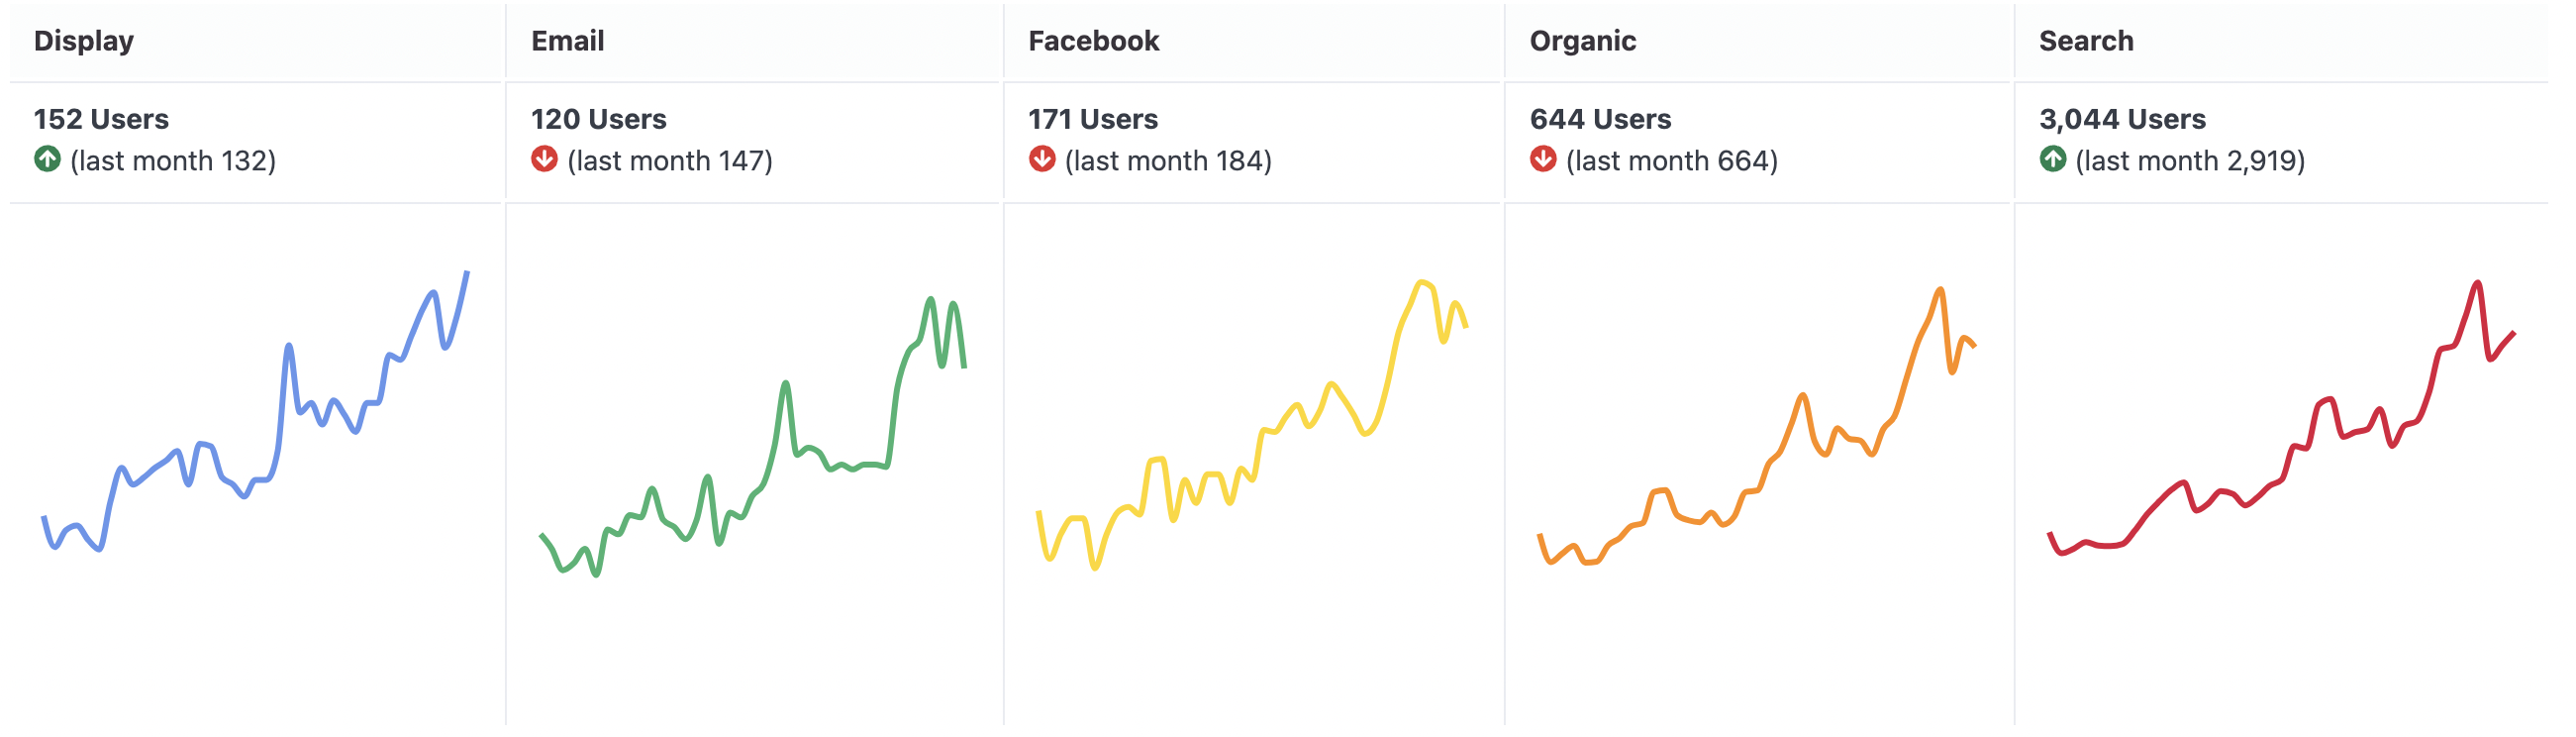
Card grid
A grid of responsive cards with metrics and images

Card list
A vertical list of cards with metrics or details
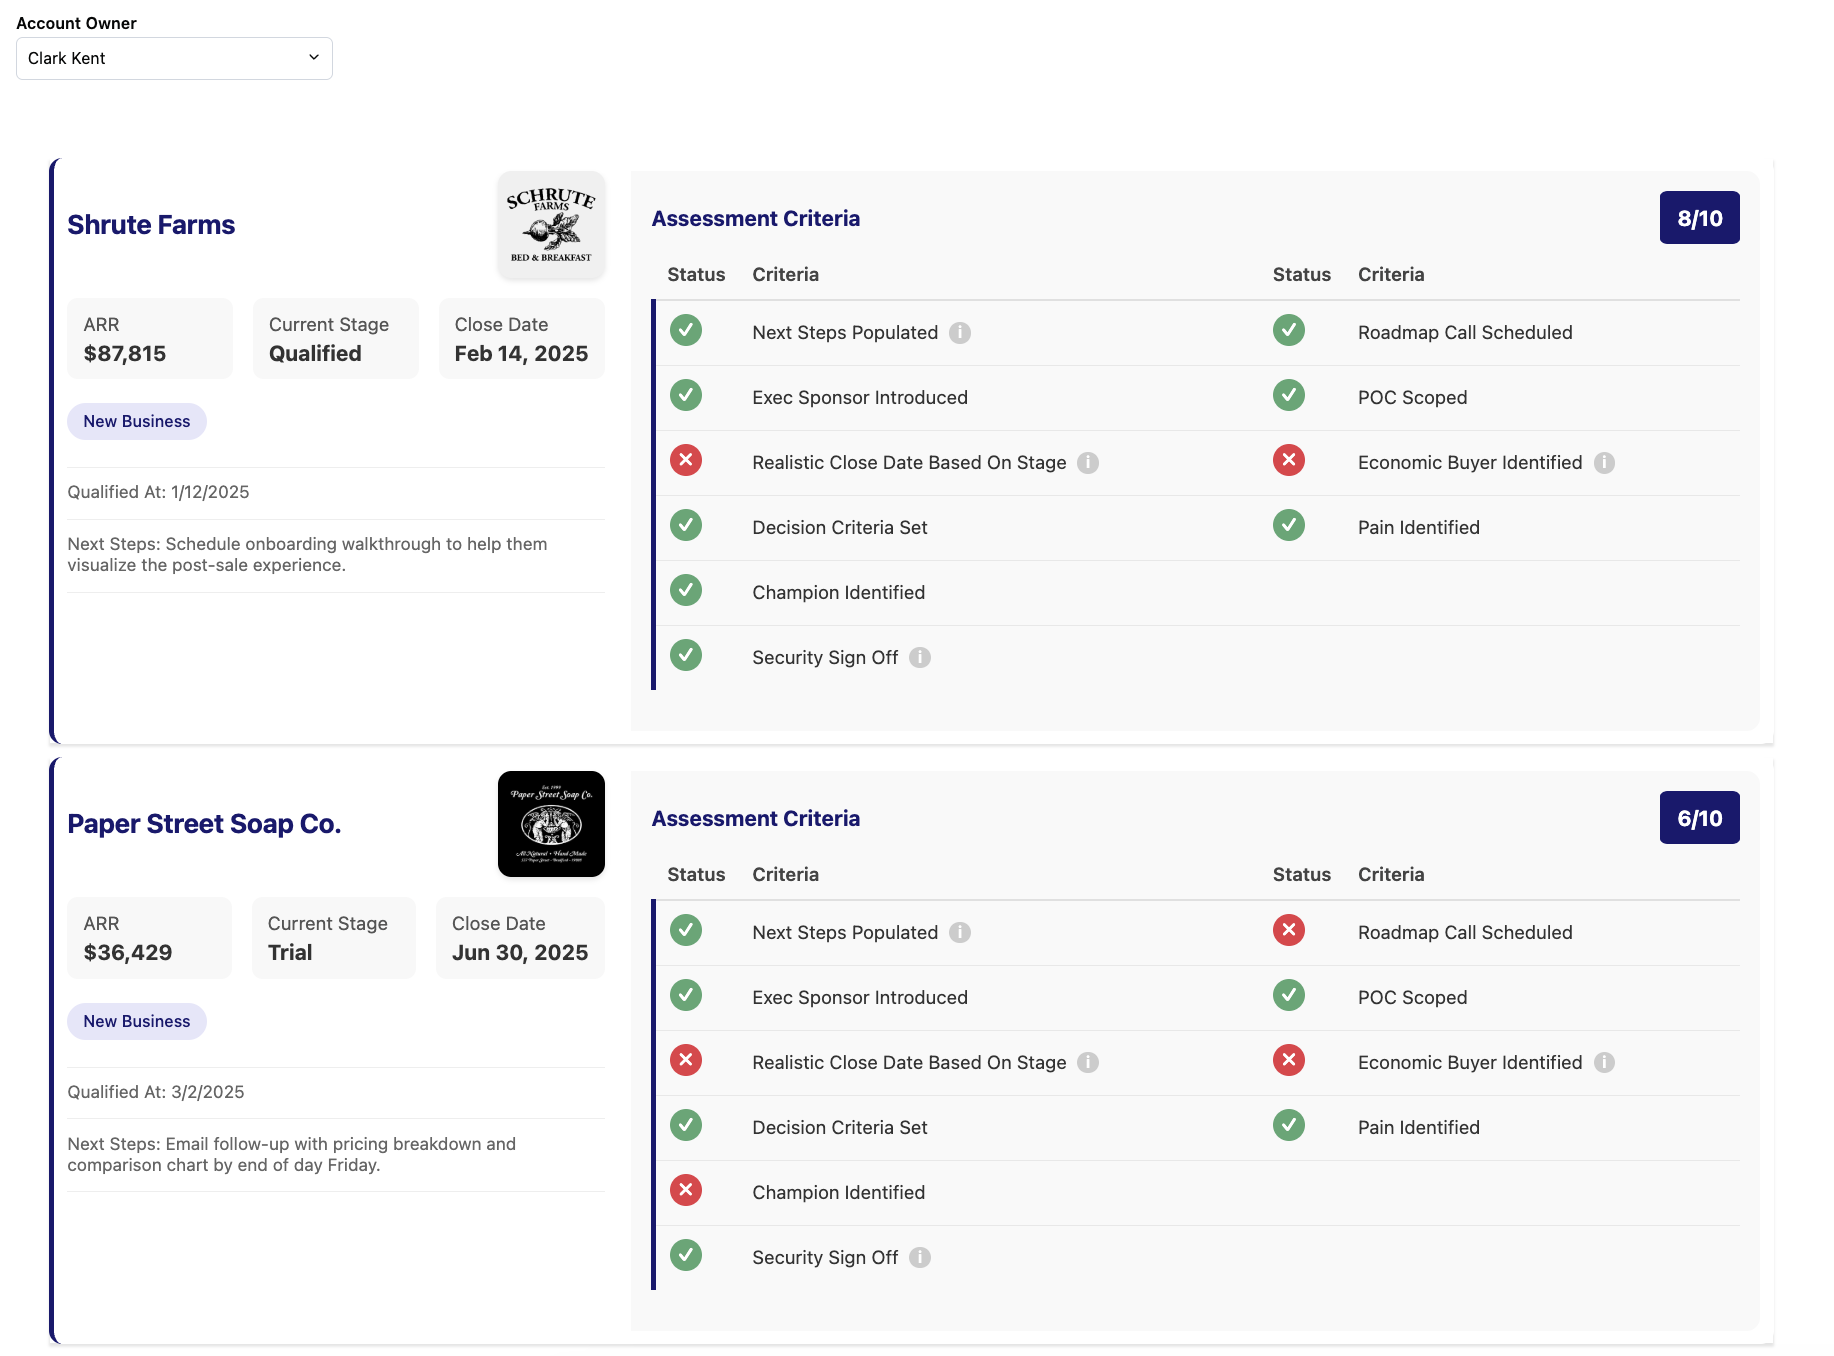
Card with criteria checklist
A card with a list of criteria
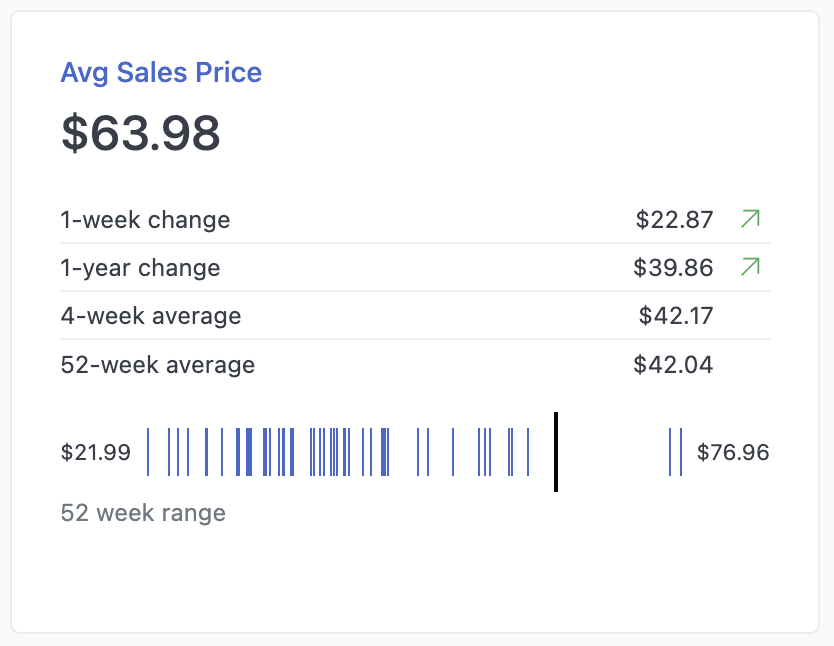
Card with strip plot
Card with a strip plot that displays changes over time
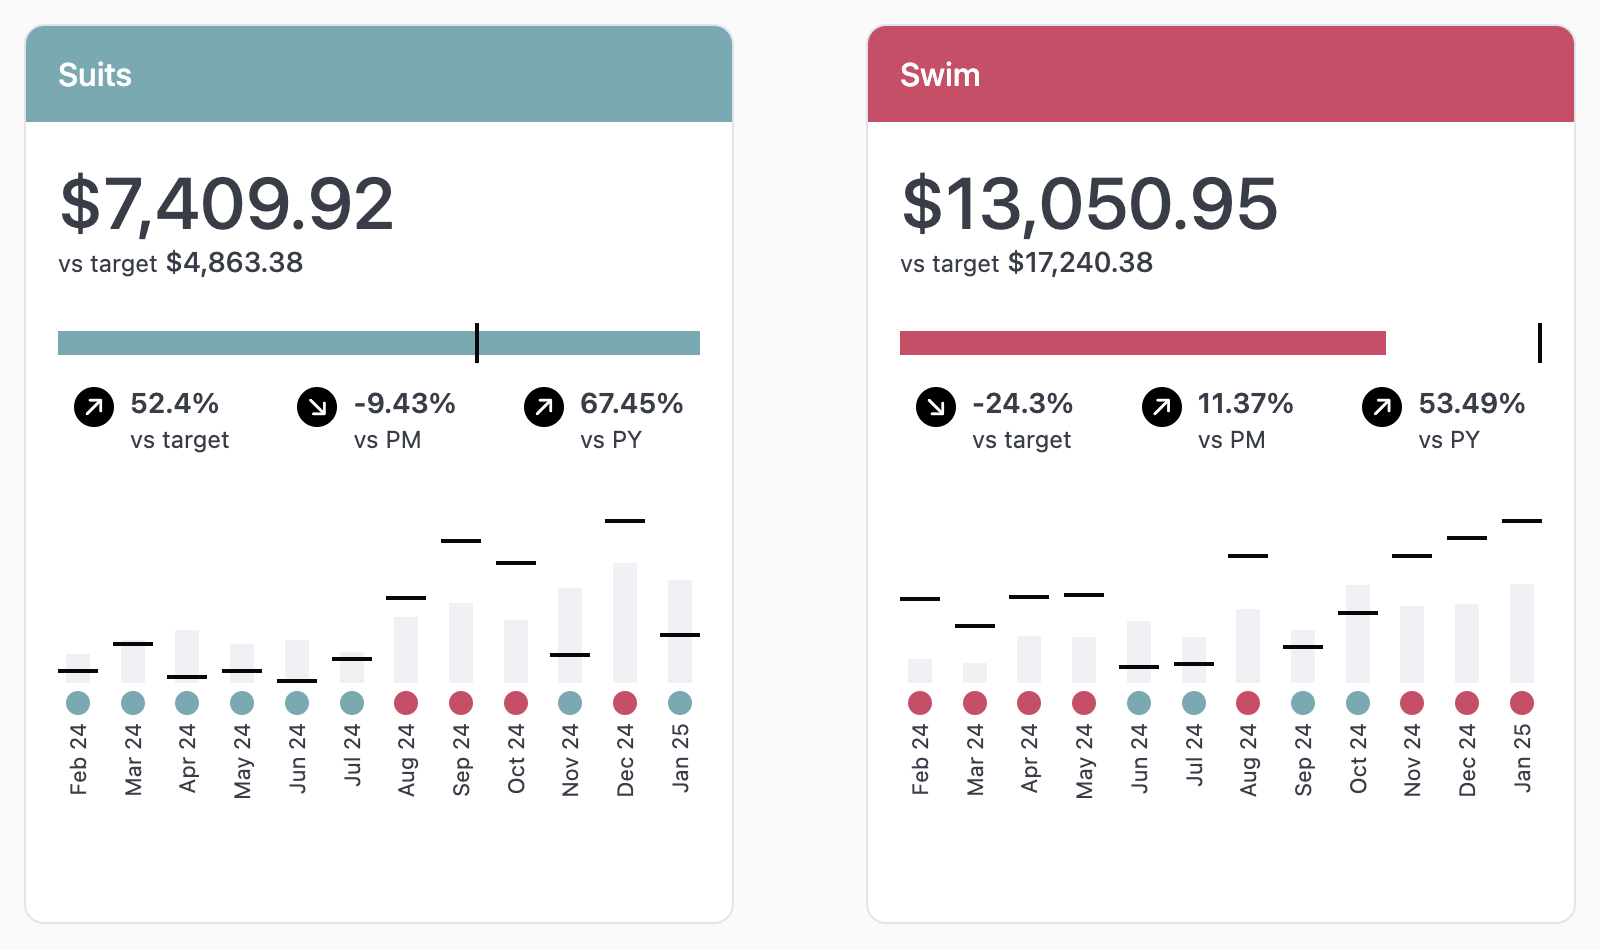
Card with target candlesticks
Card with current vs target and conditional coloring
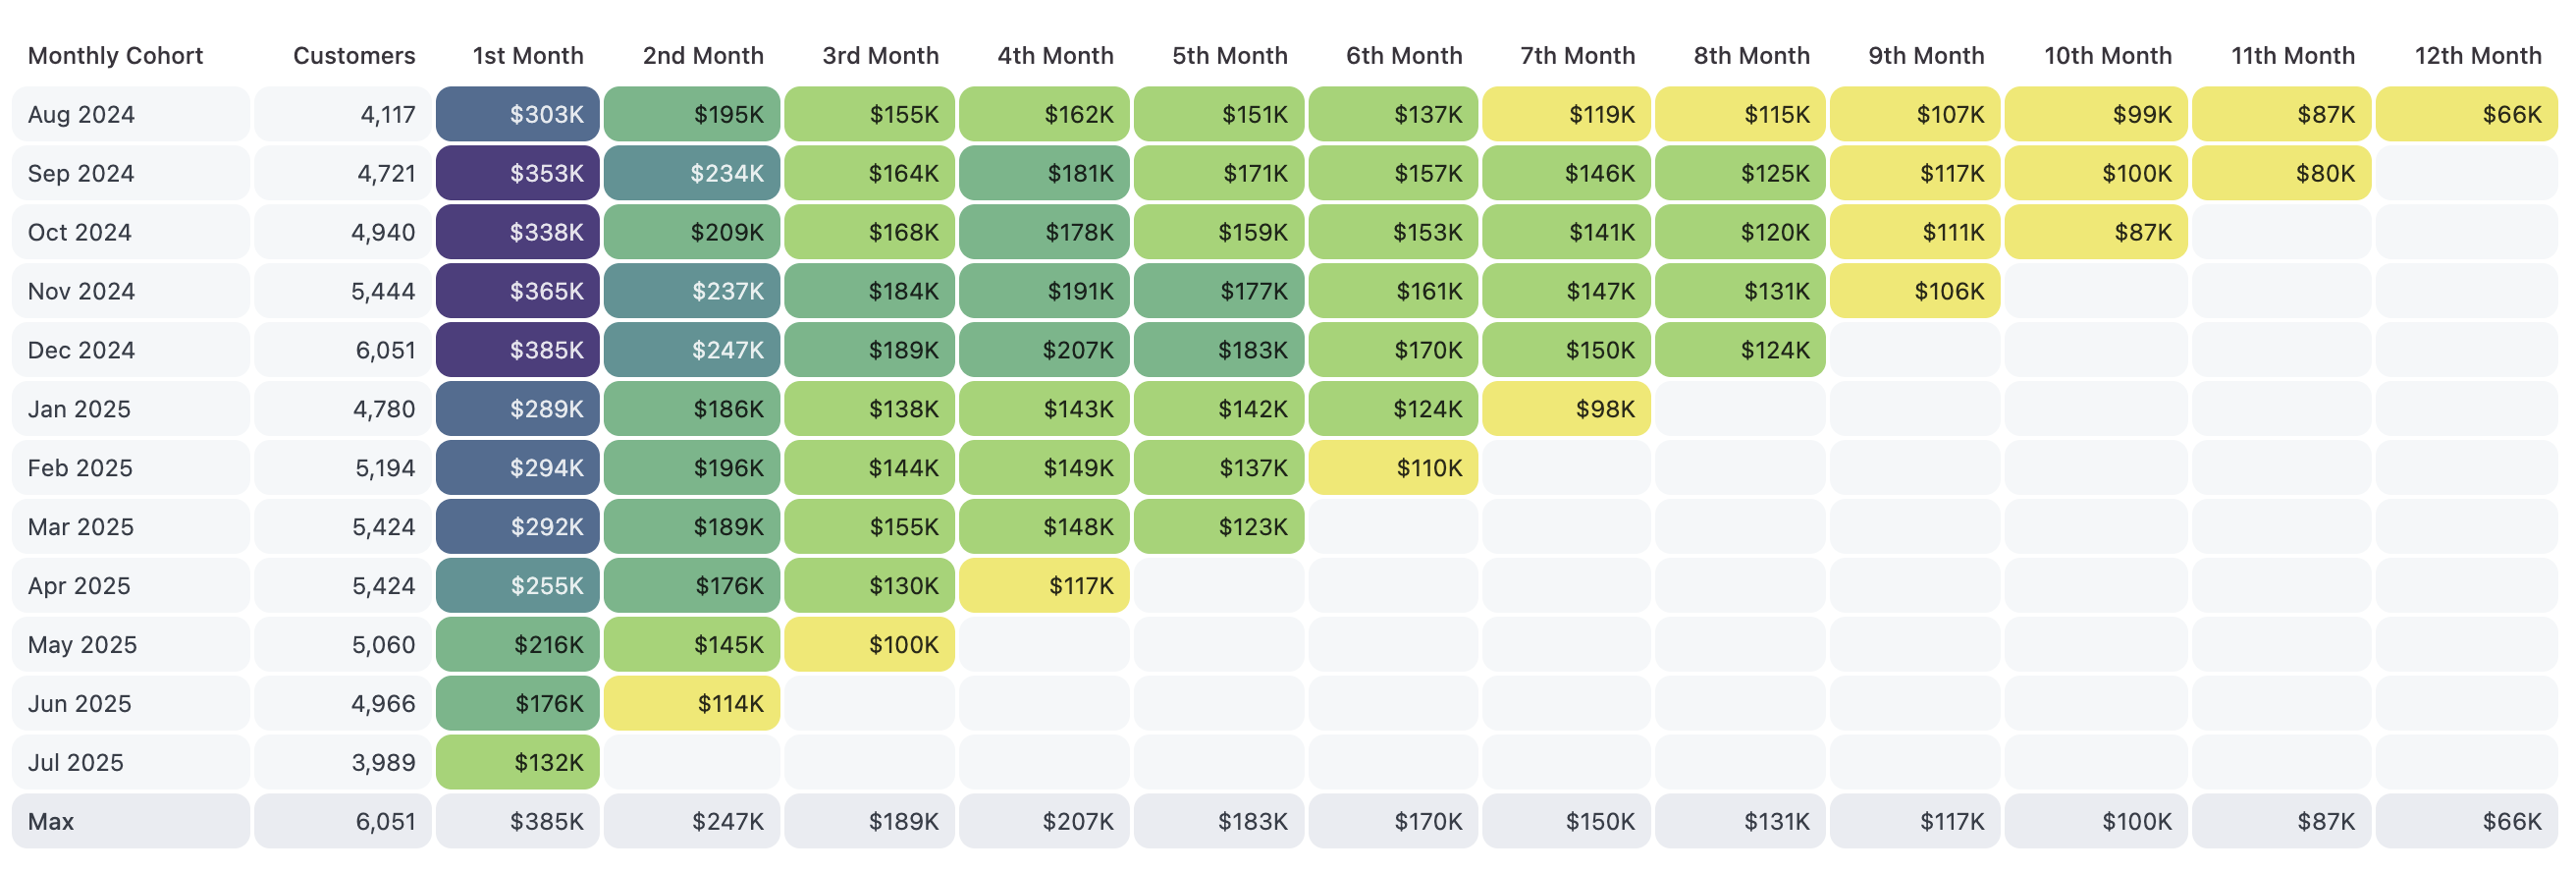
Cohort table
Stylized cohort table for 12 months
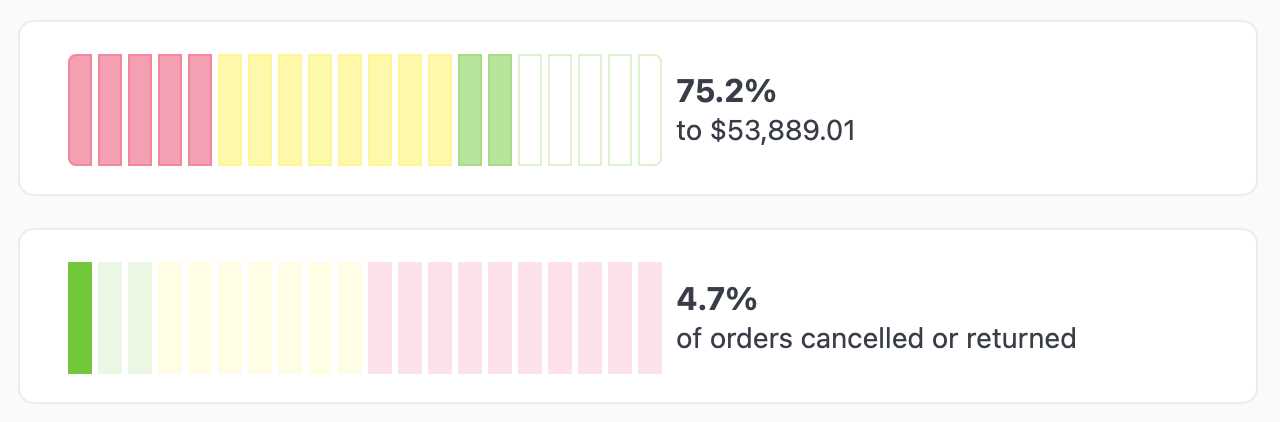
Colored progress bars
Use color to reinforce level of progress
Dashboard tabs
Tabbed navigation for dashboards

Dashboard tile anchors
Table of contents for a dashboard
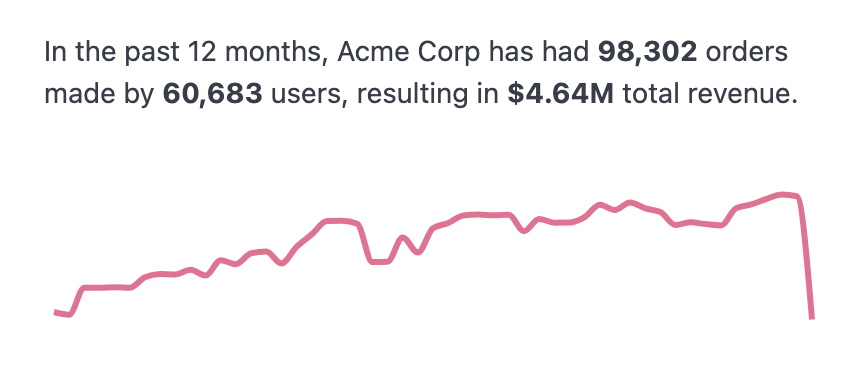
Data readout
Sparkline with description containing query data references
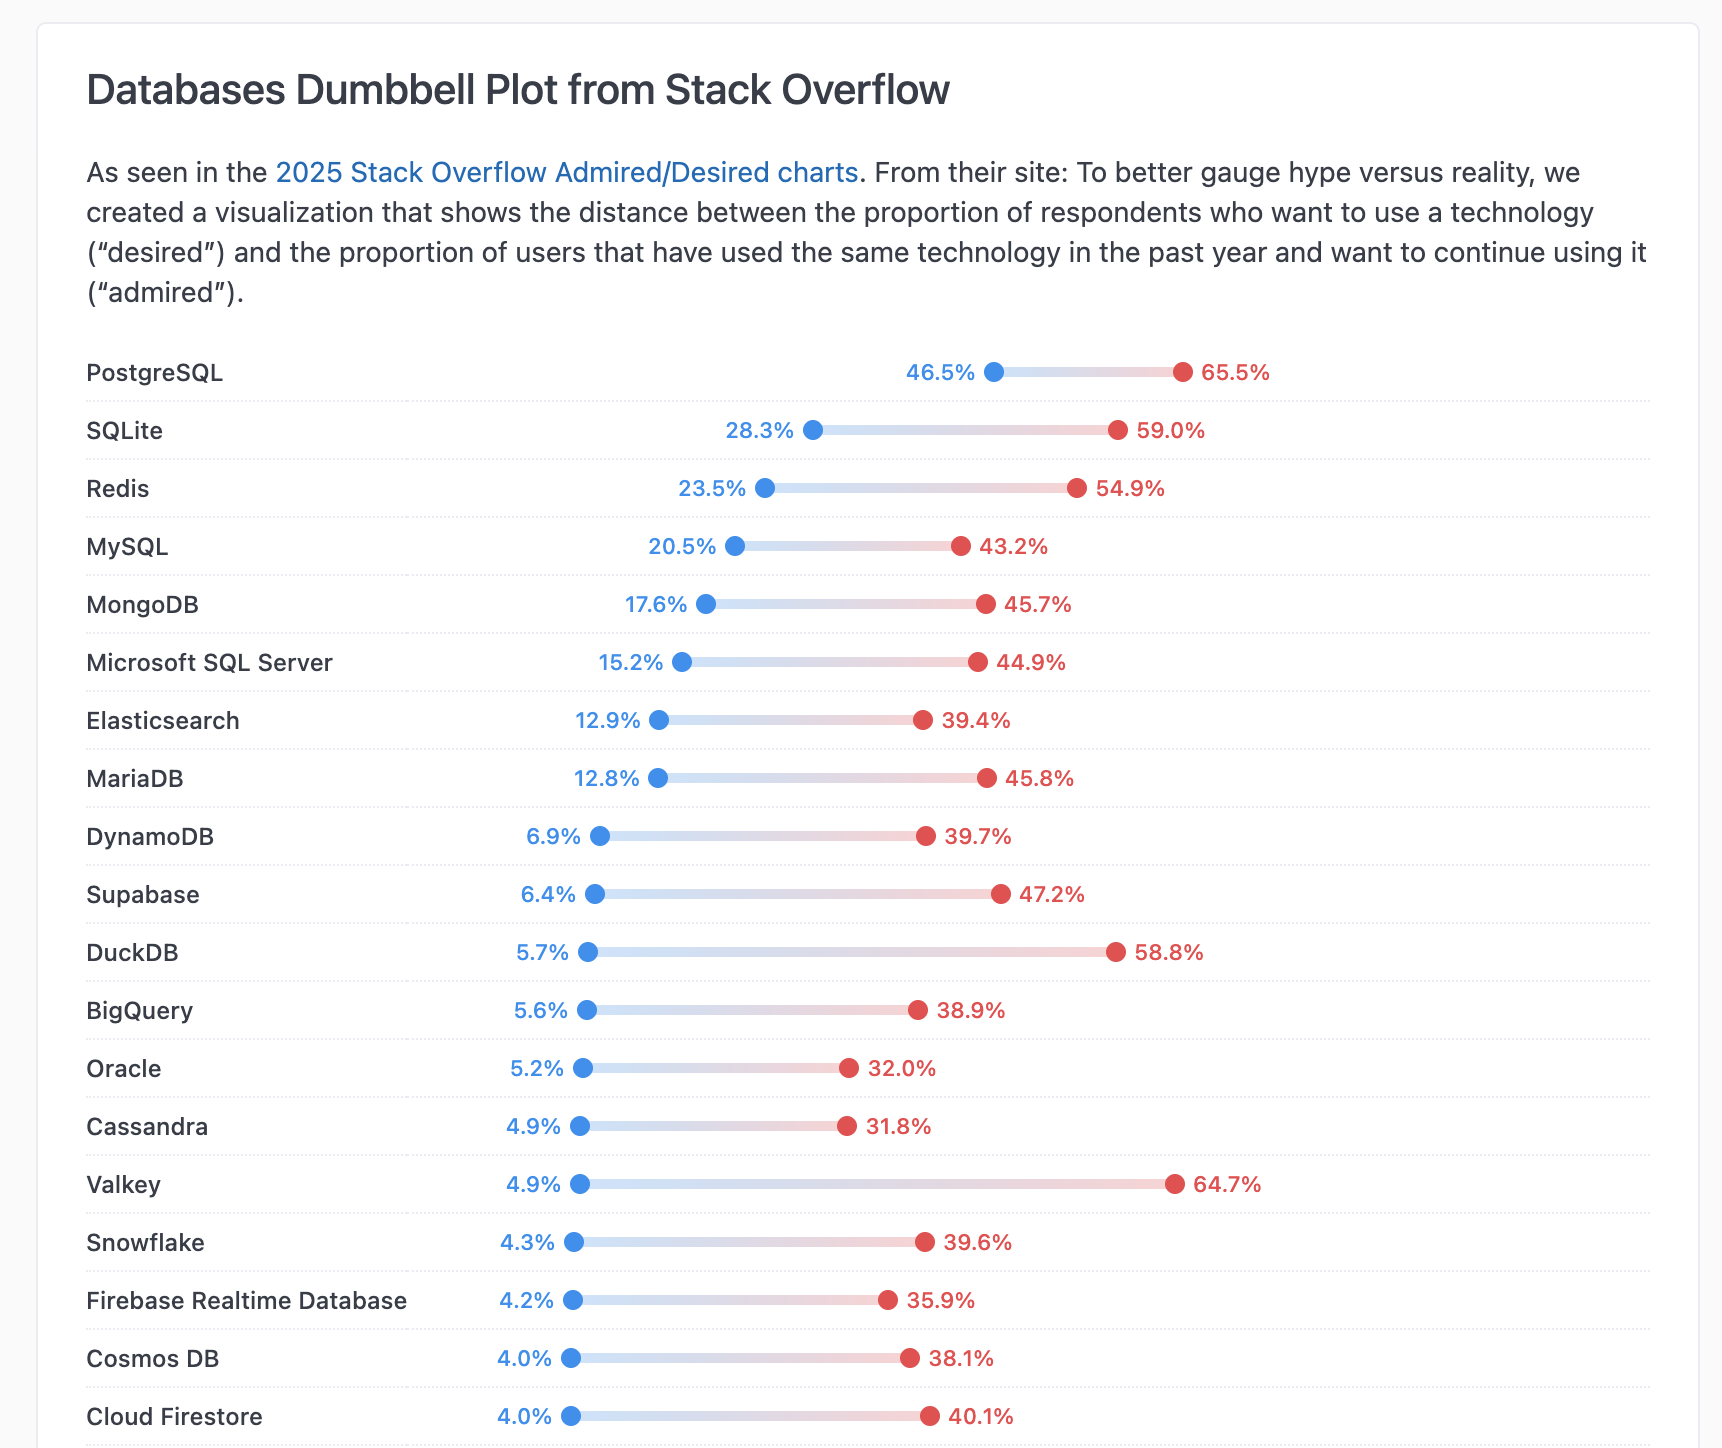
Dumbbell plot
Compare a pair of data points per category
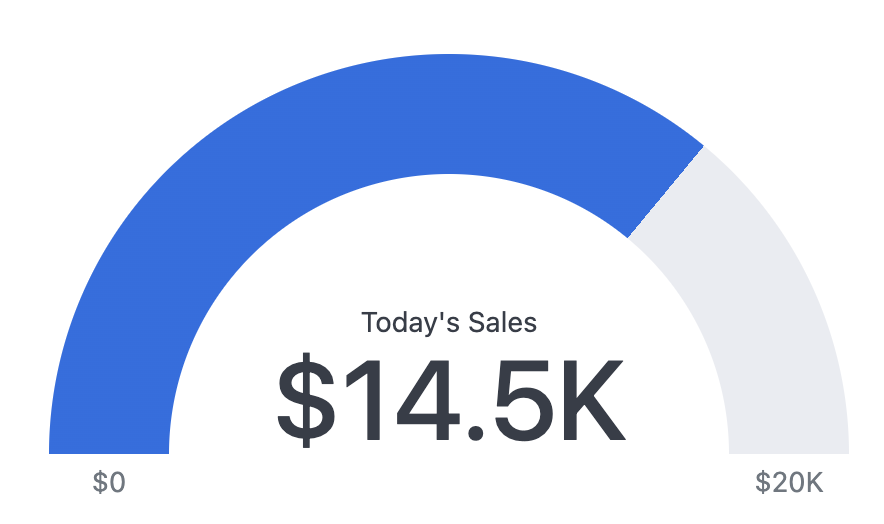
Gauges
Displays a single value in a range

Gradient card & metrics
Wide card with KPI-style metrics
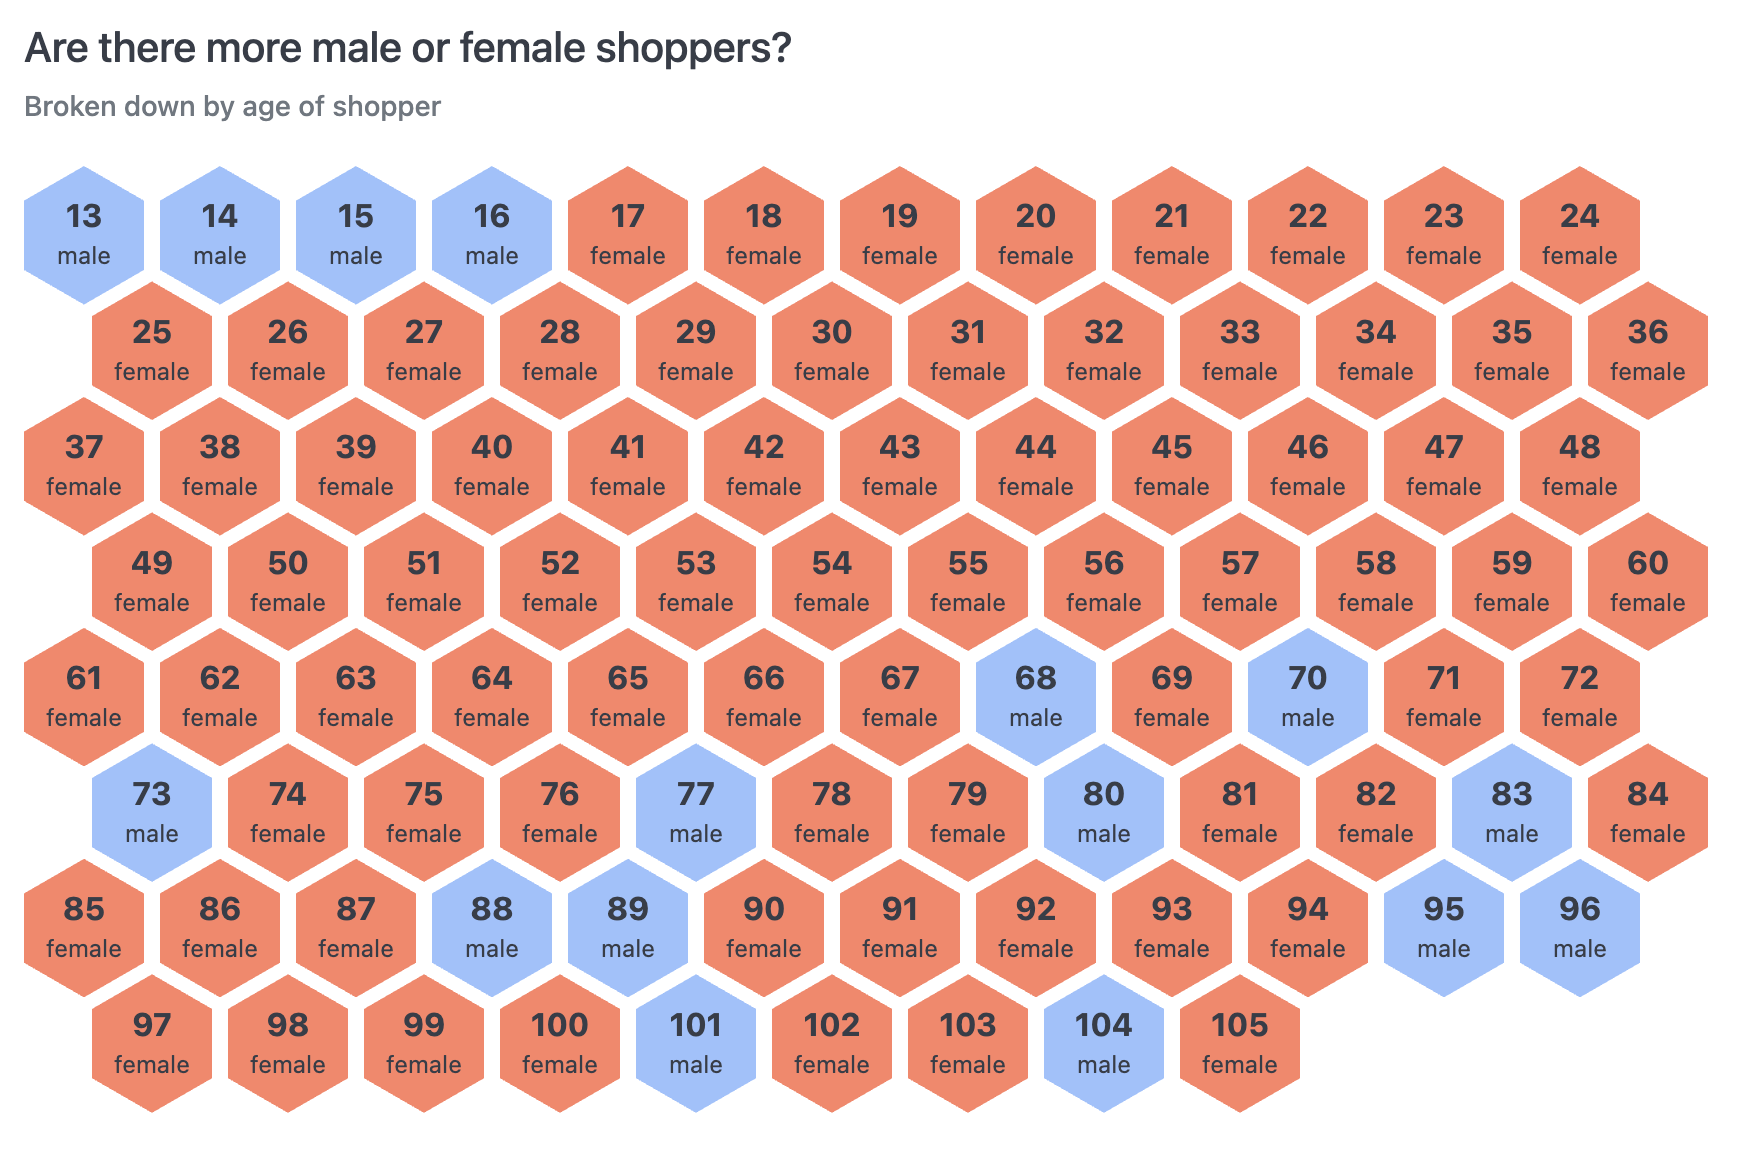
Honeycomb categorical chart
Hexagonal grid with conditional coloring
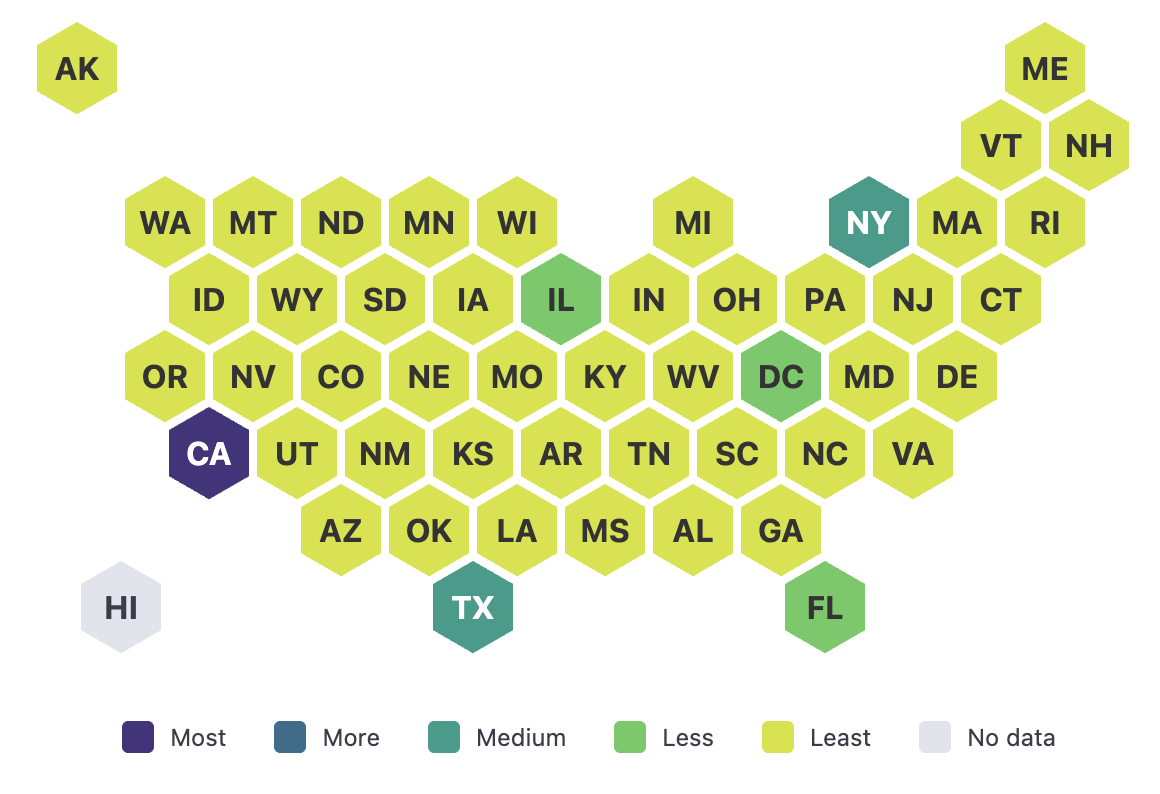
Honeycomb map
Stylized, hexagonal map with conditional coloring
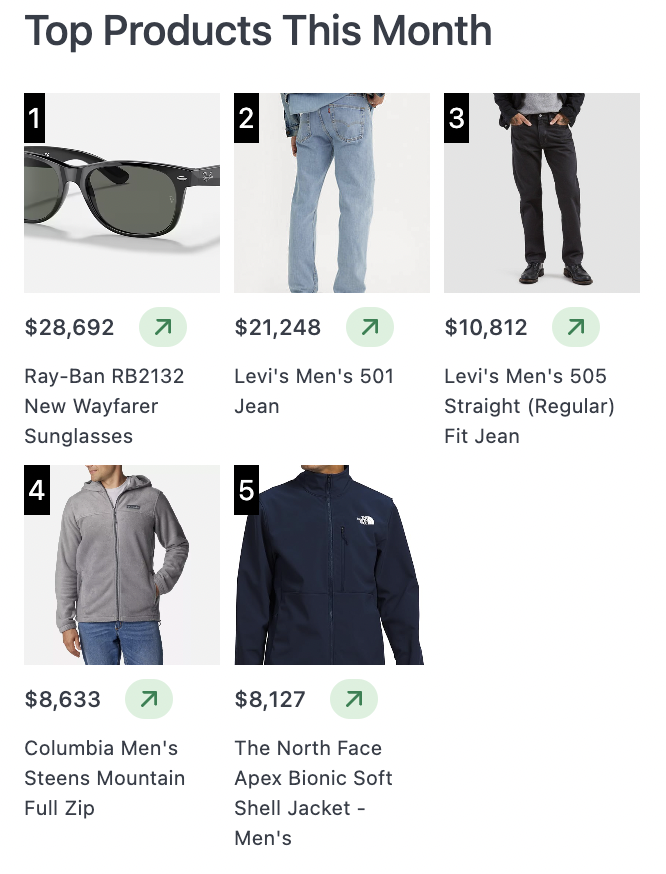
Image grid
Grid of images with a metric and label
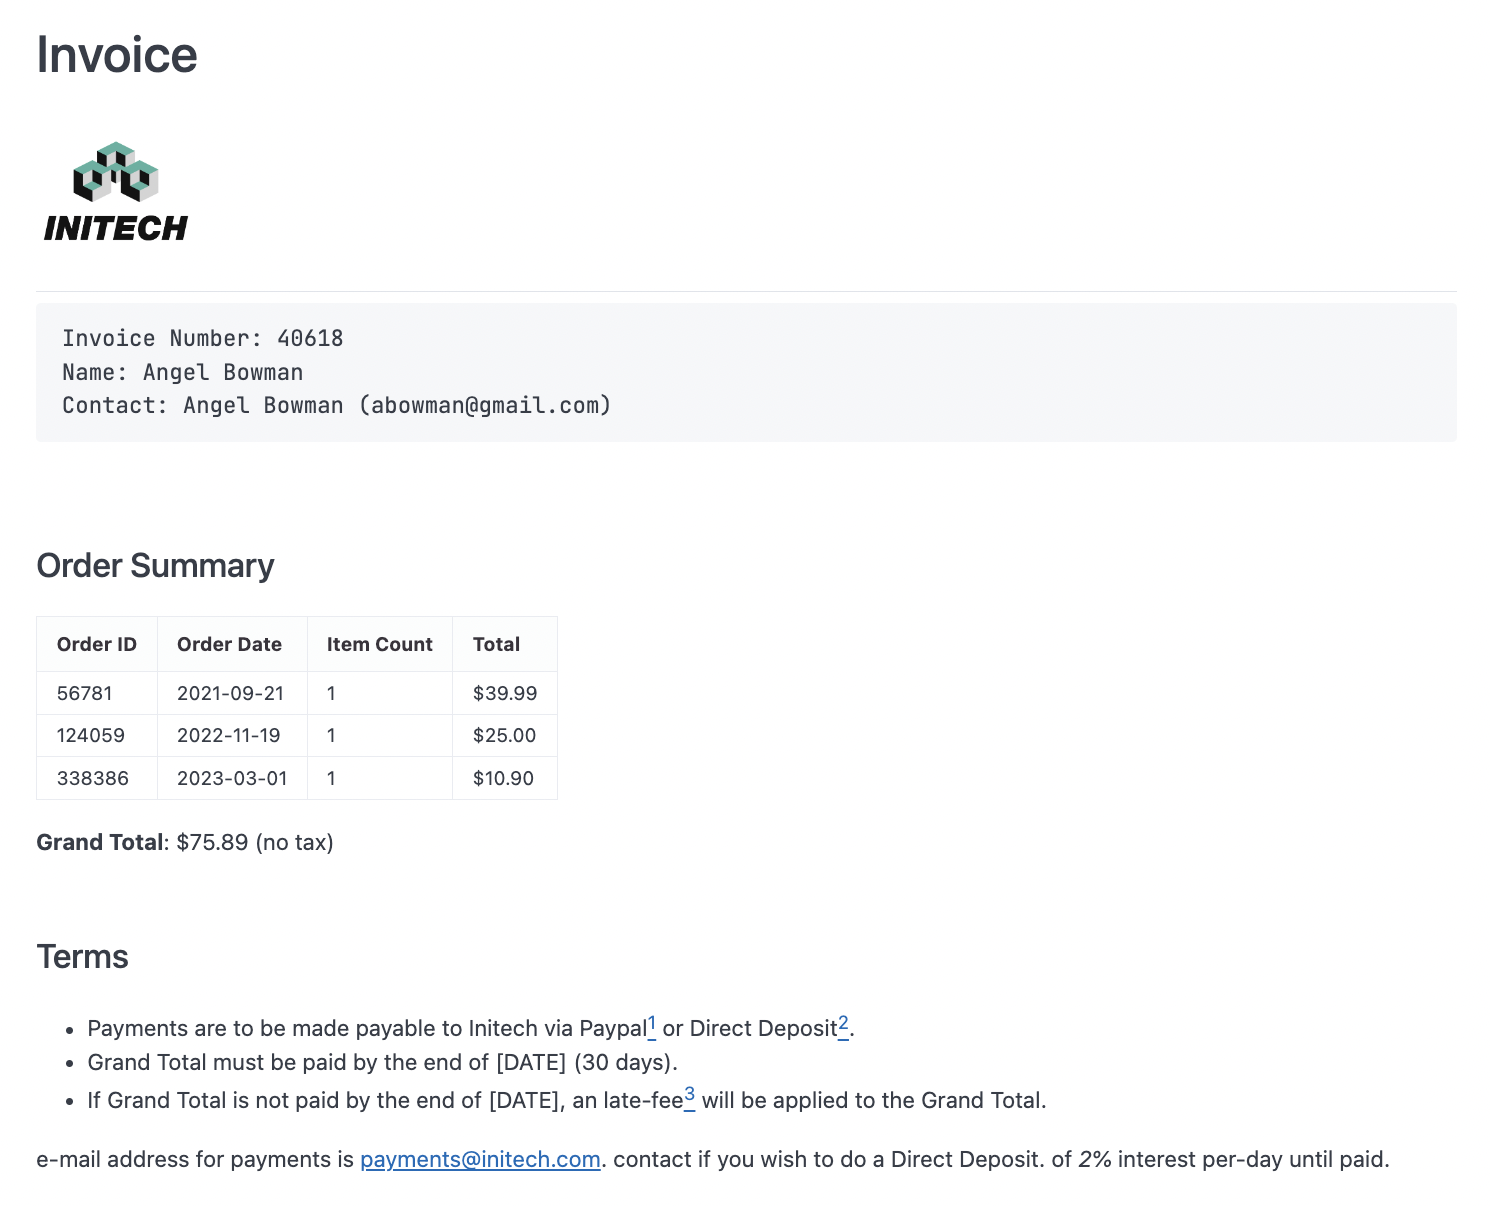
Invoice report
Structured invoice with contact & order details
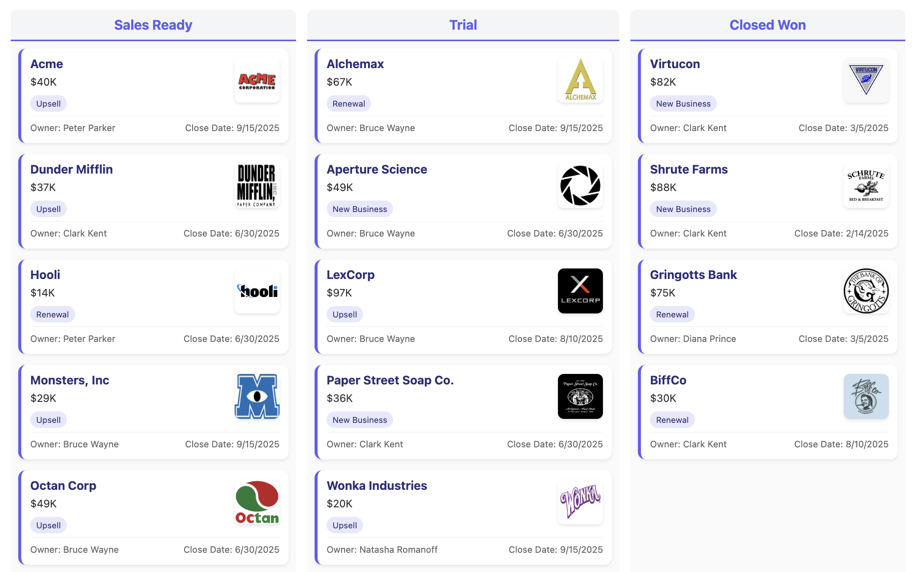
Kanban
Kanban-style project board with cards
KPI table
Table displaying multiple KPIs
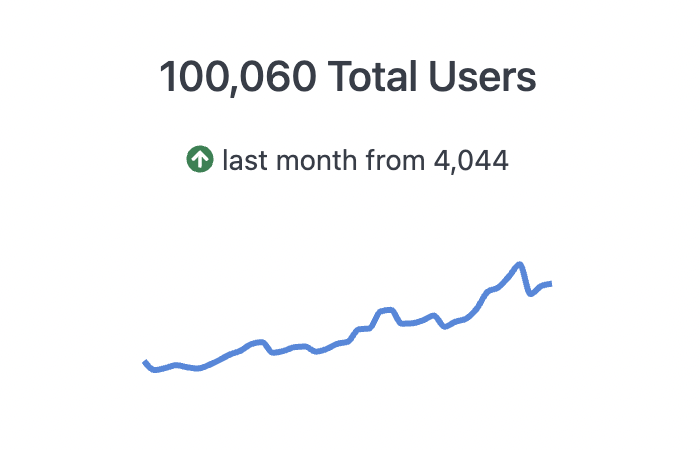
KPI with sparkline
KPI-style metric with sparkline
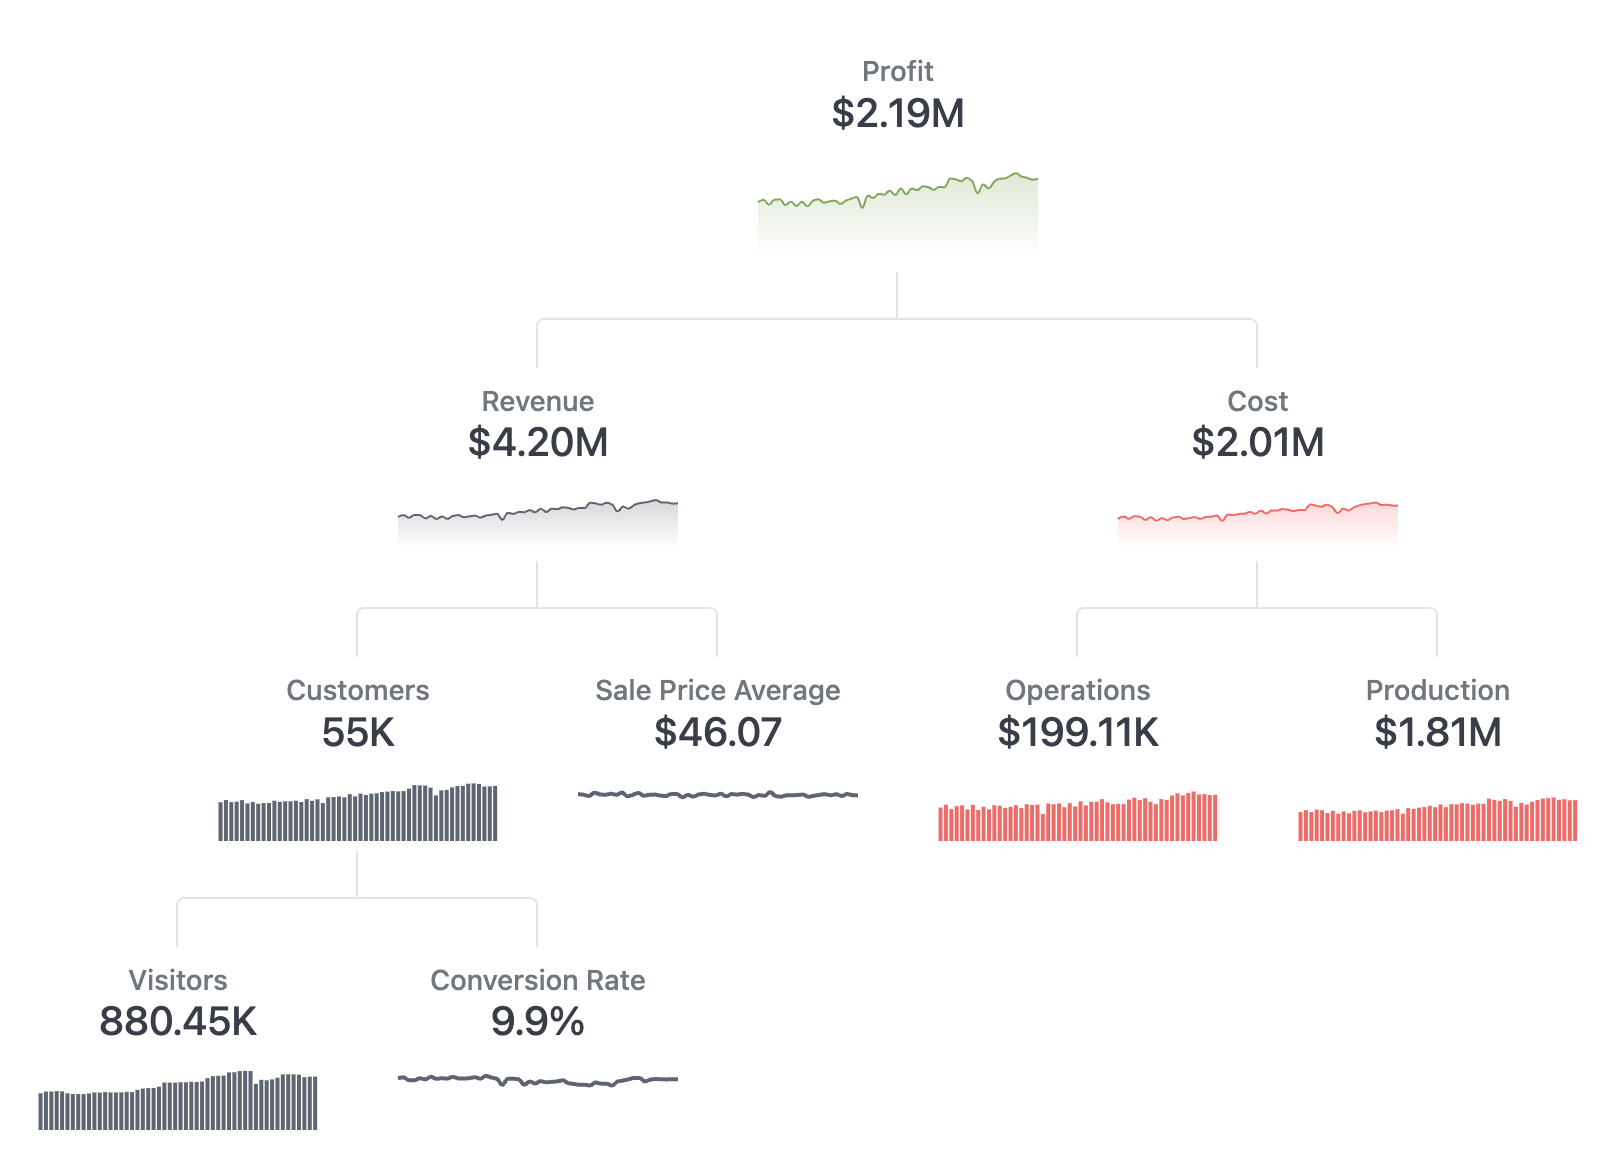
Metric tree
Pyramid-shaped tree of interdependent metrics
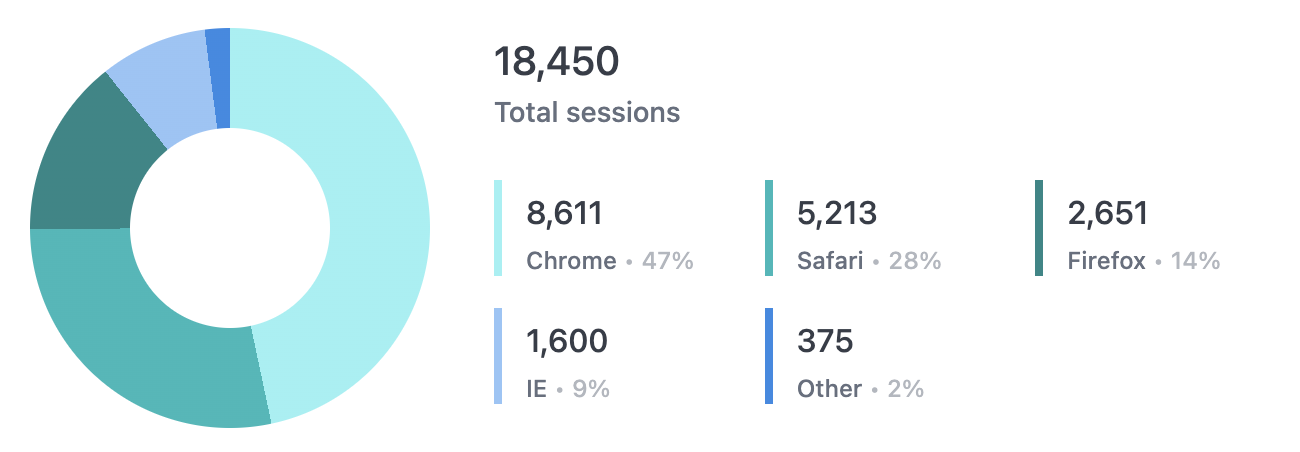
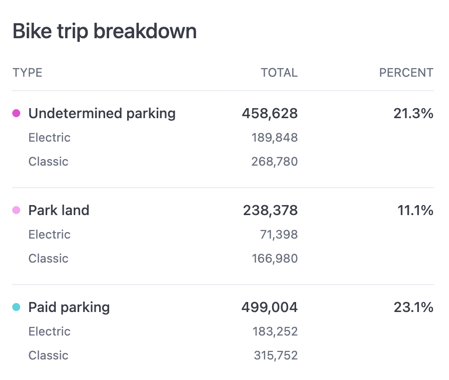
Pie/donut with custom legend
Pie/donut with custom legend
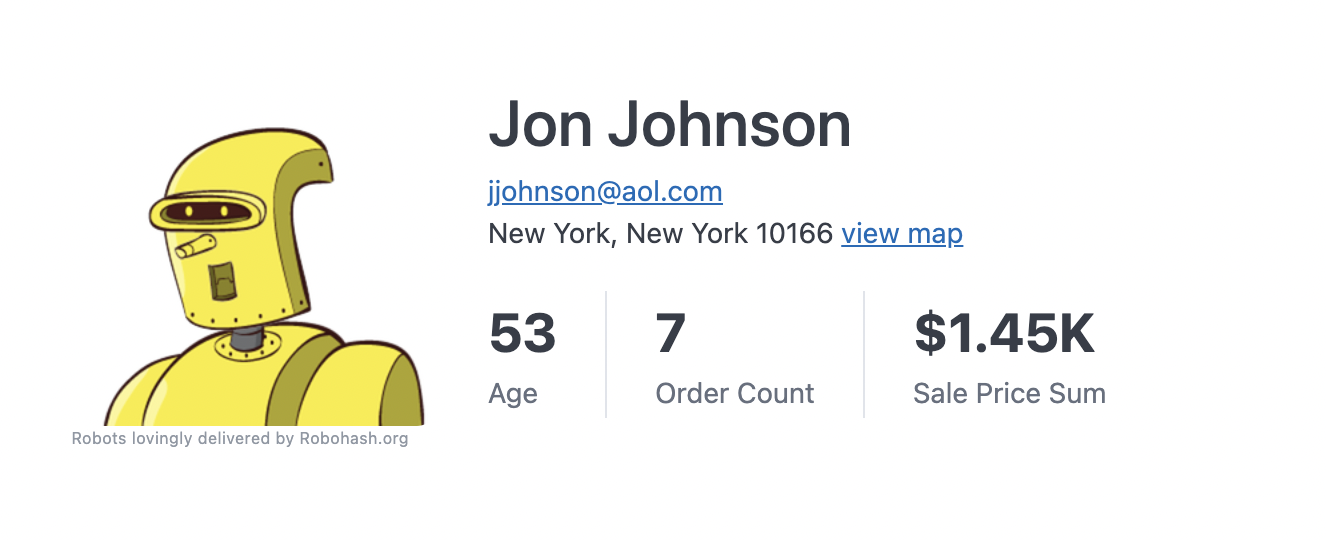
Record lookup
Card with details from a single record
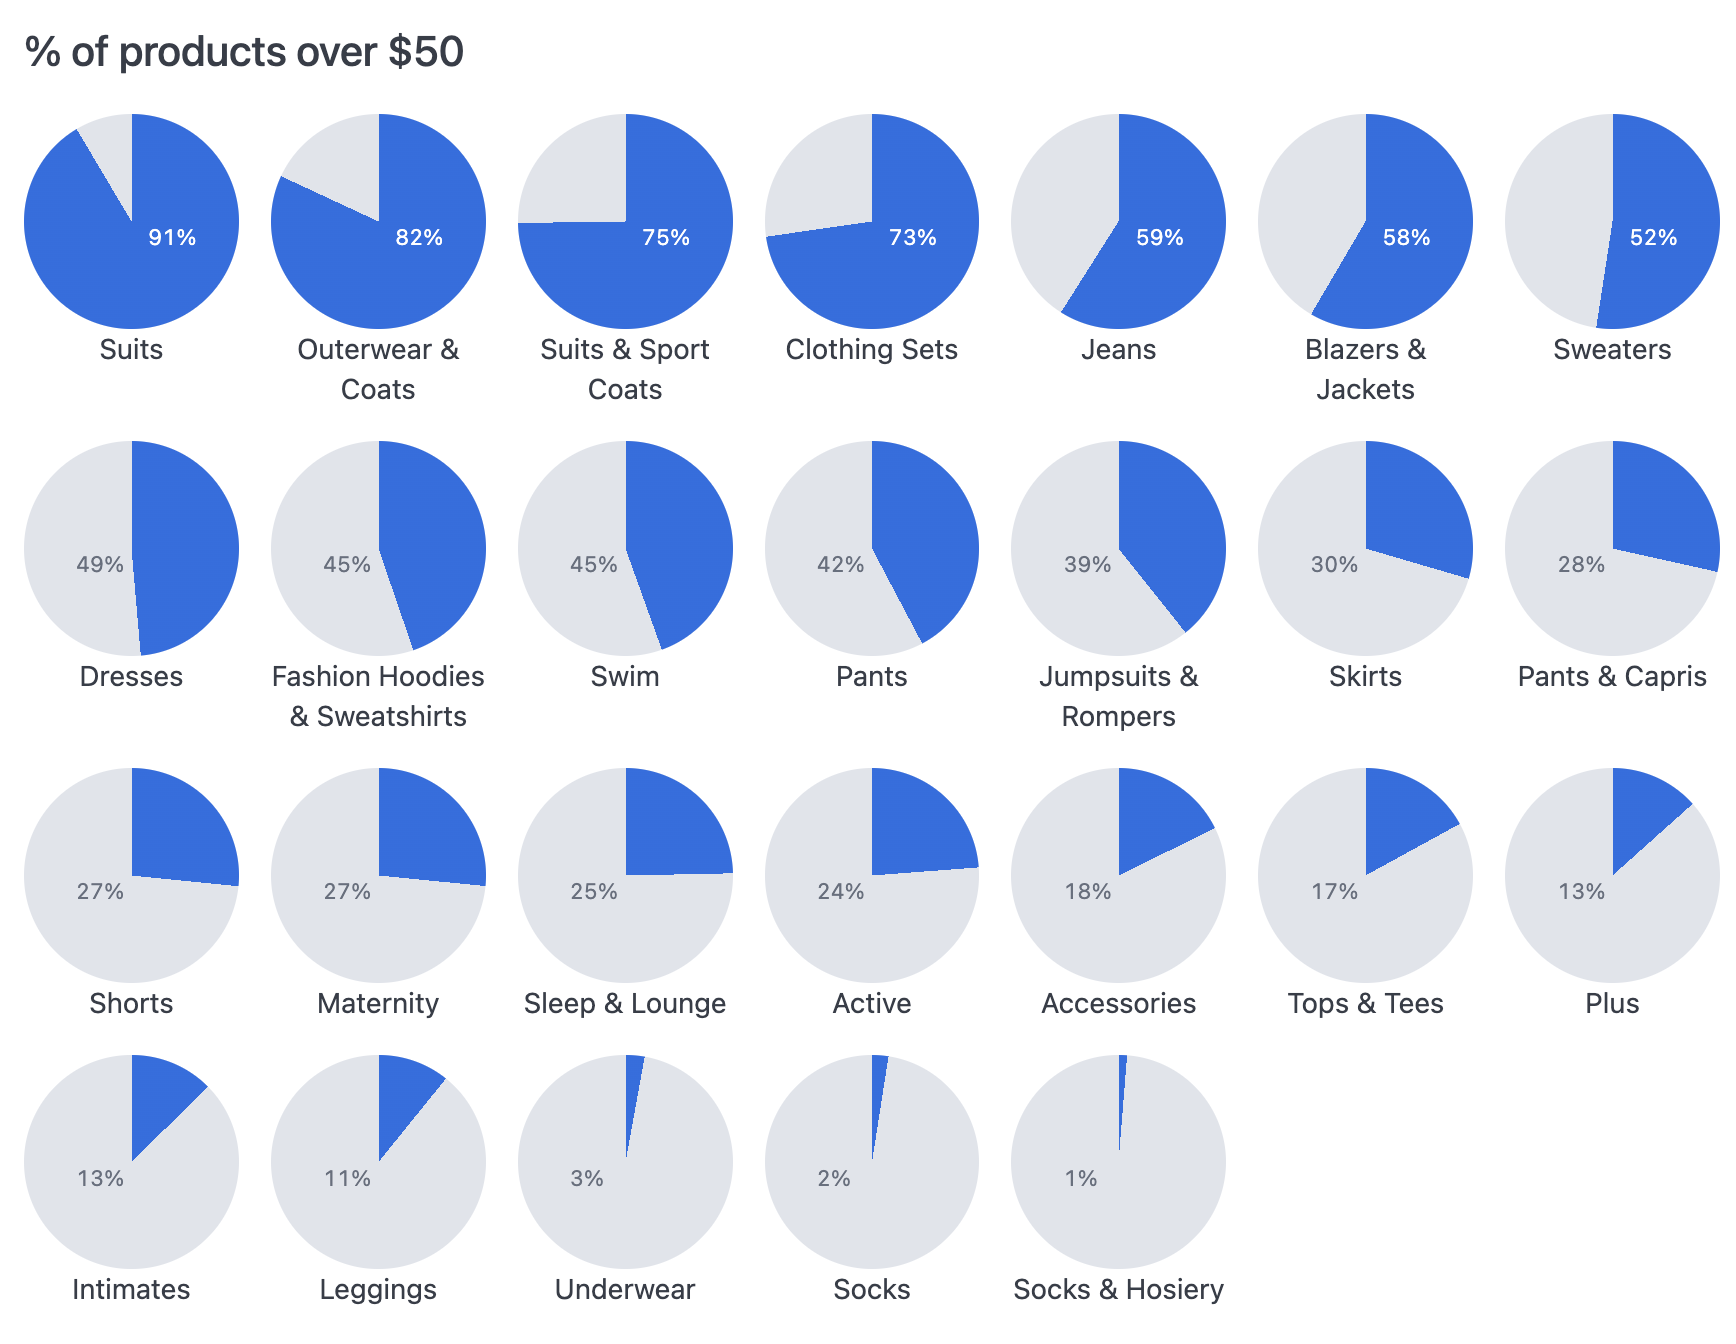
Repeating pie charts
Multiple pie charts, one for each row of results
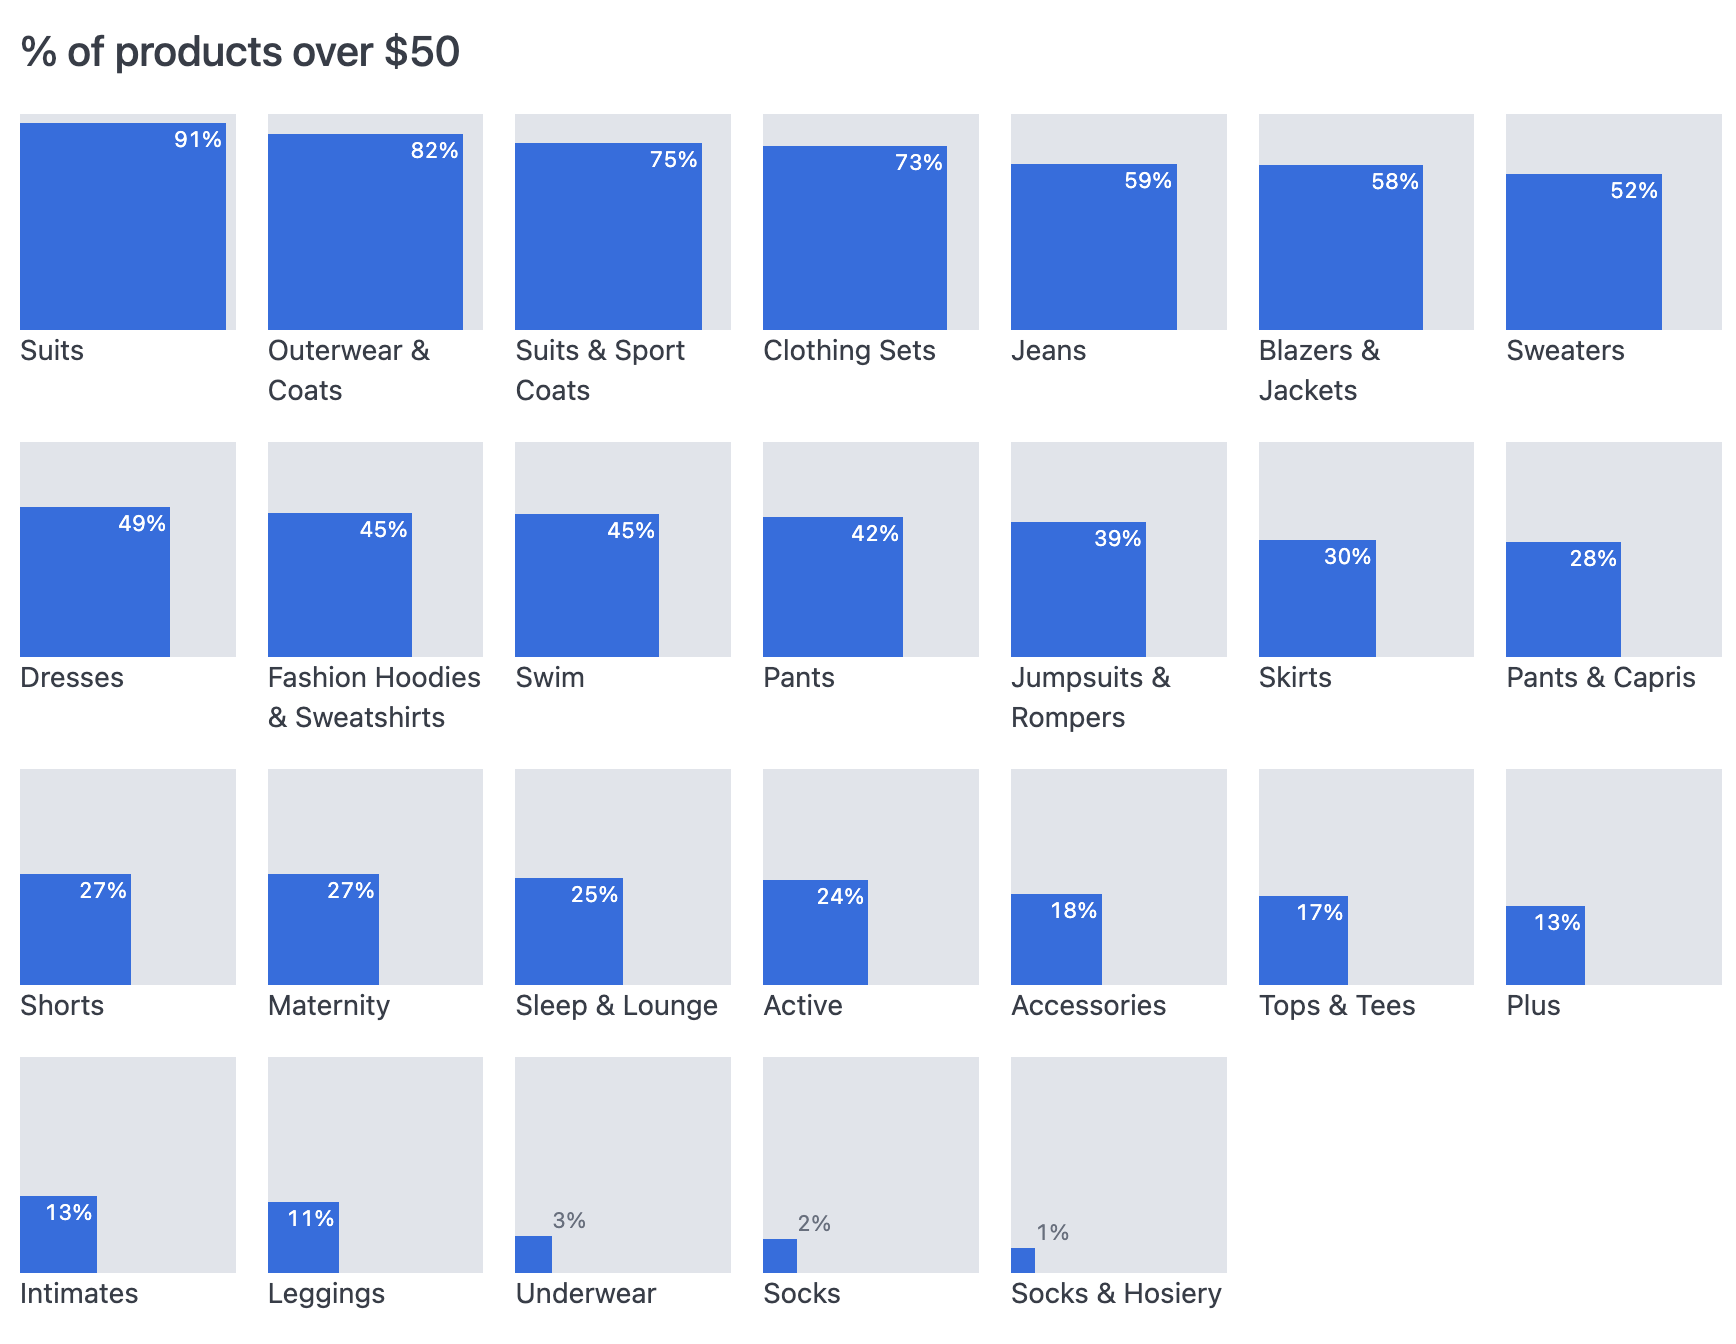
Repeating square fill charts
Percentage-filled square charts, one for each row of results
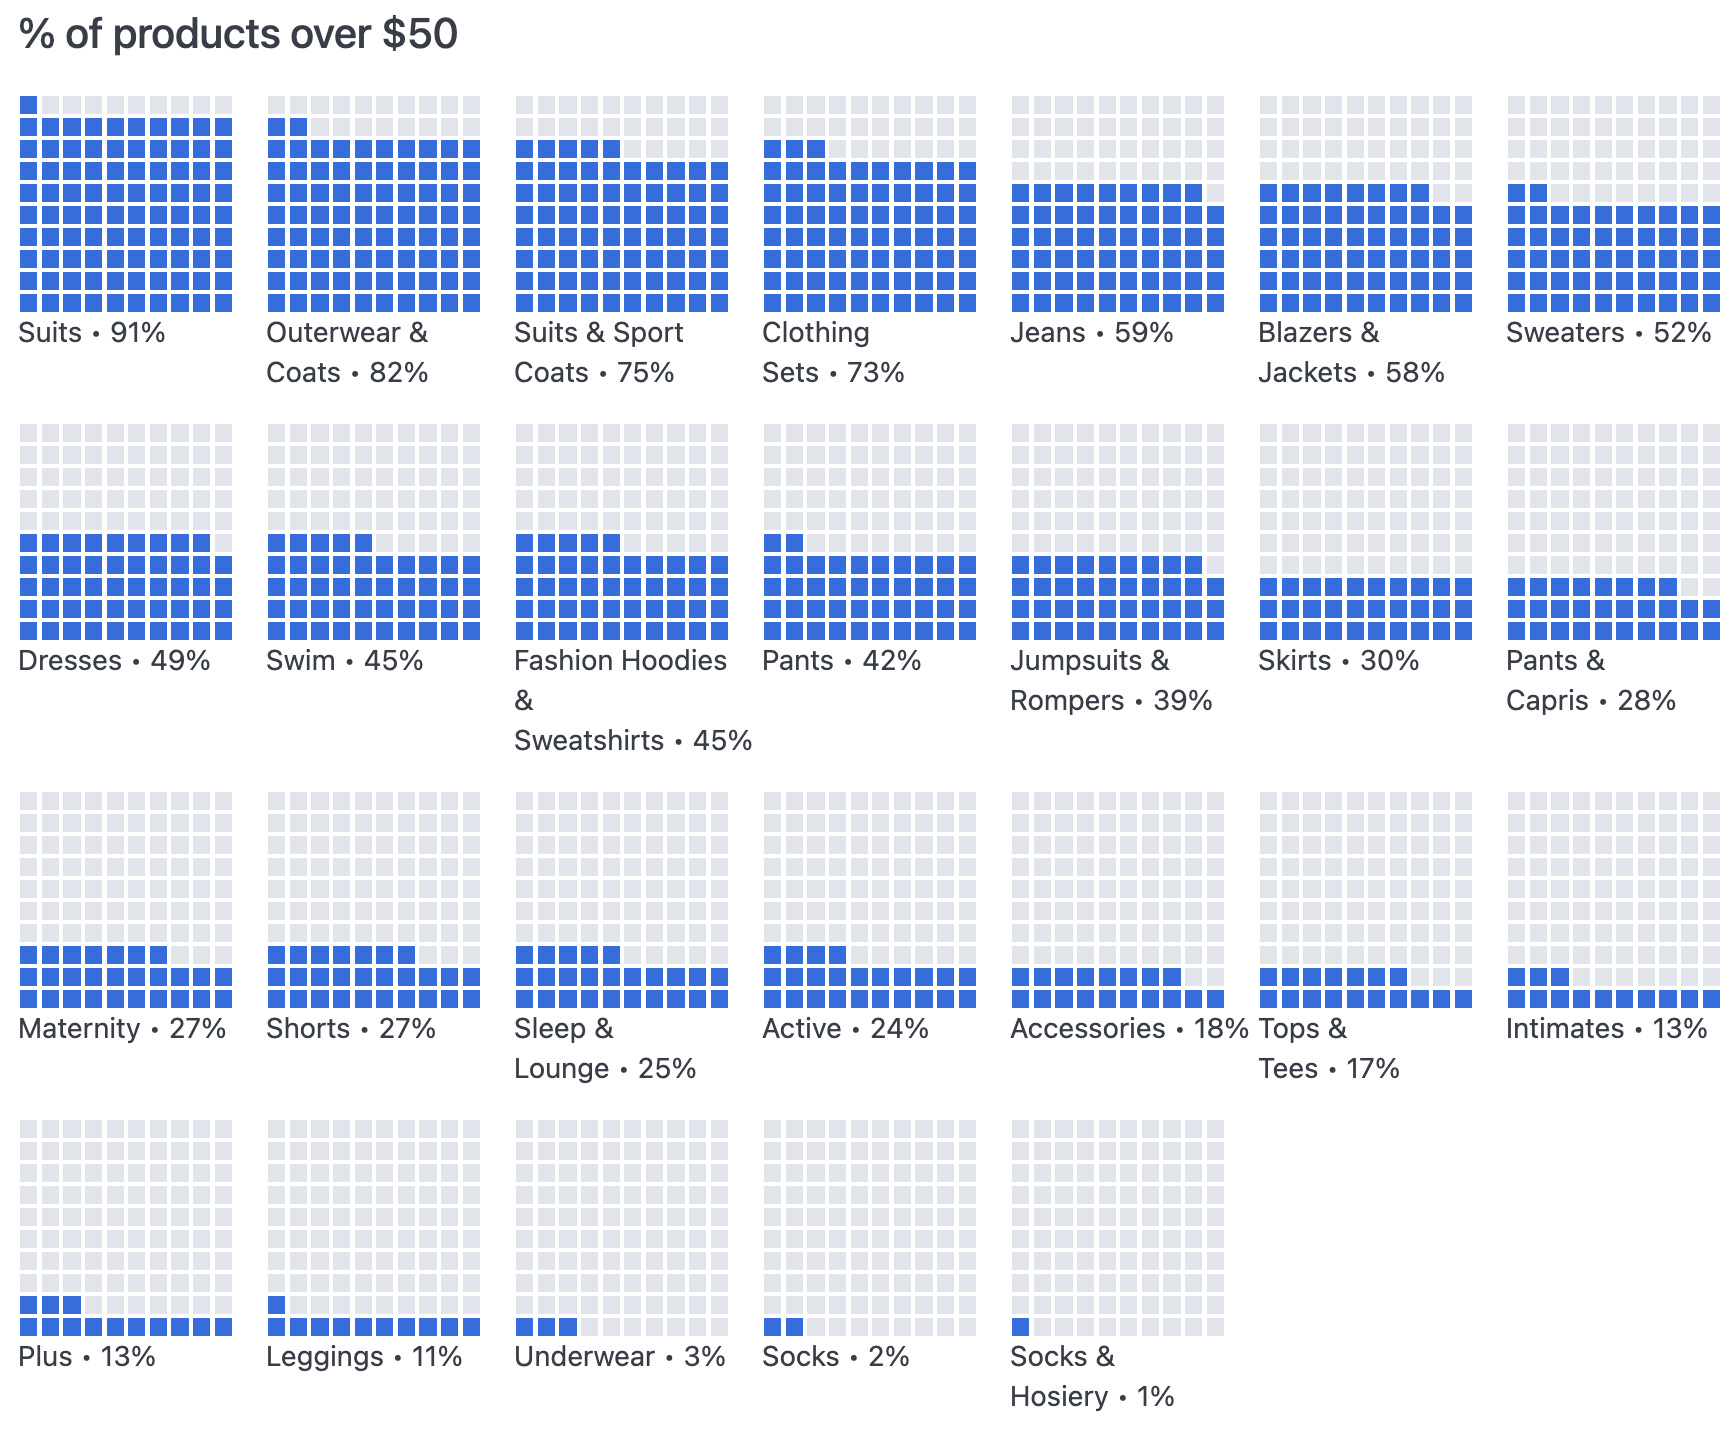
Repeating waffle charts
Percentage-filled waffle charts, one for each row of results
Simple subtotal table
Table with subtotals on top and coloring by category
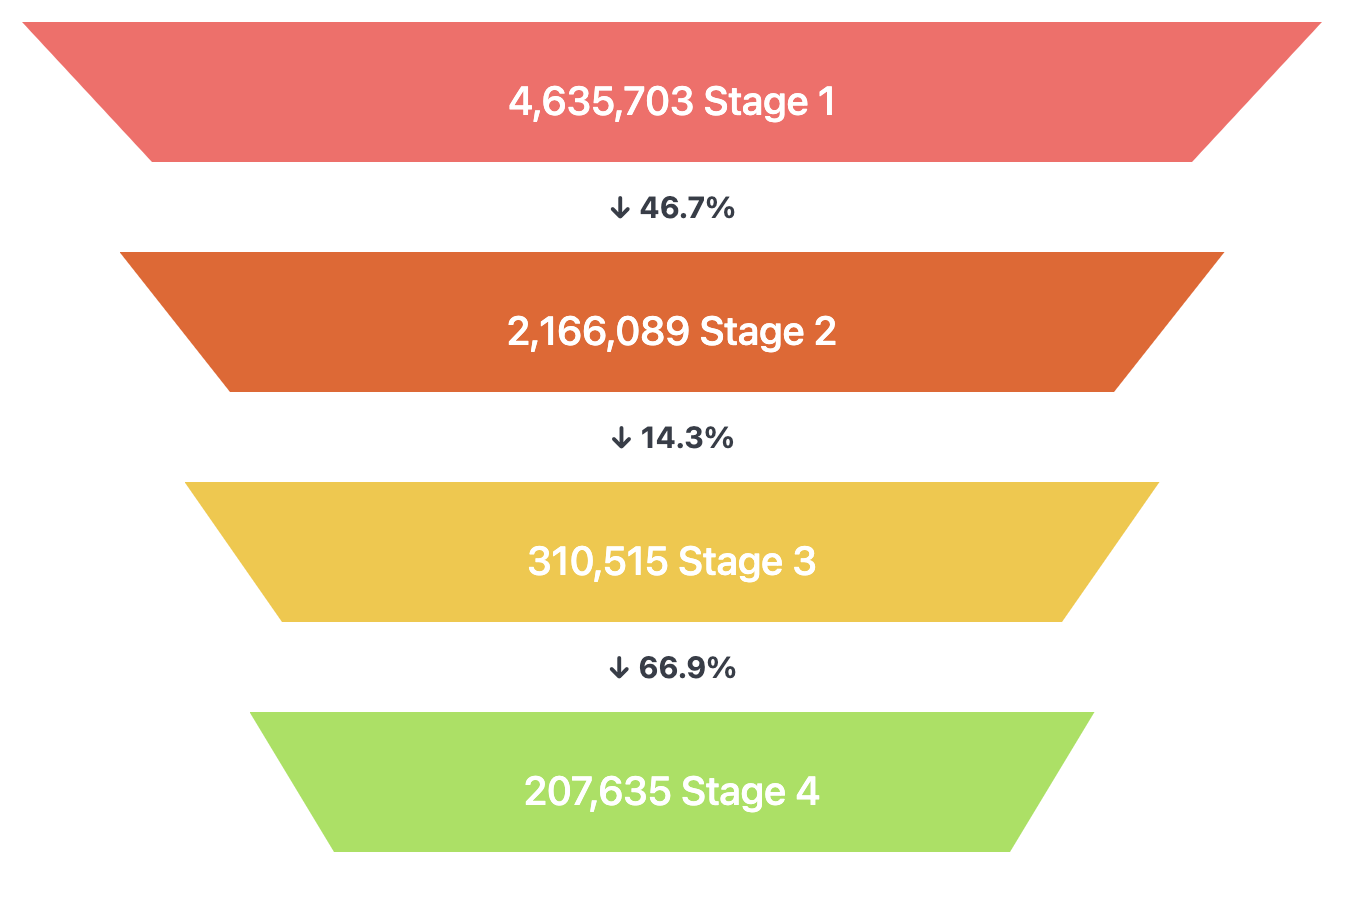
Symmetric funnel
Funnel with multiple stages
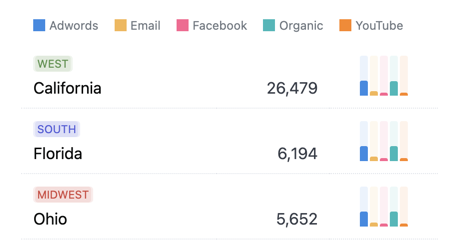
Table with tiny bar charts
Small chart within each table row
Team progress tracker
Show team members progress to their goals
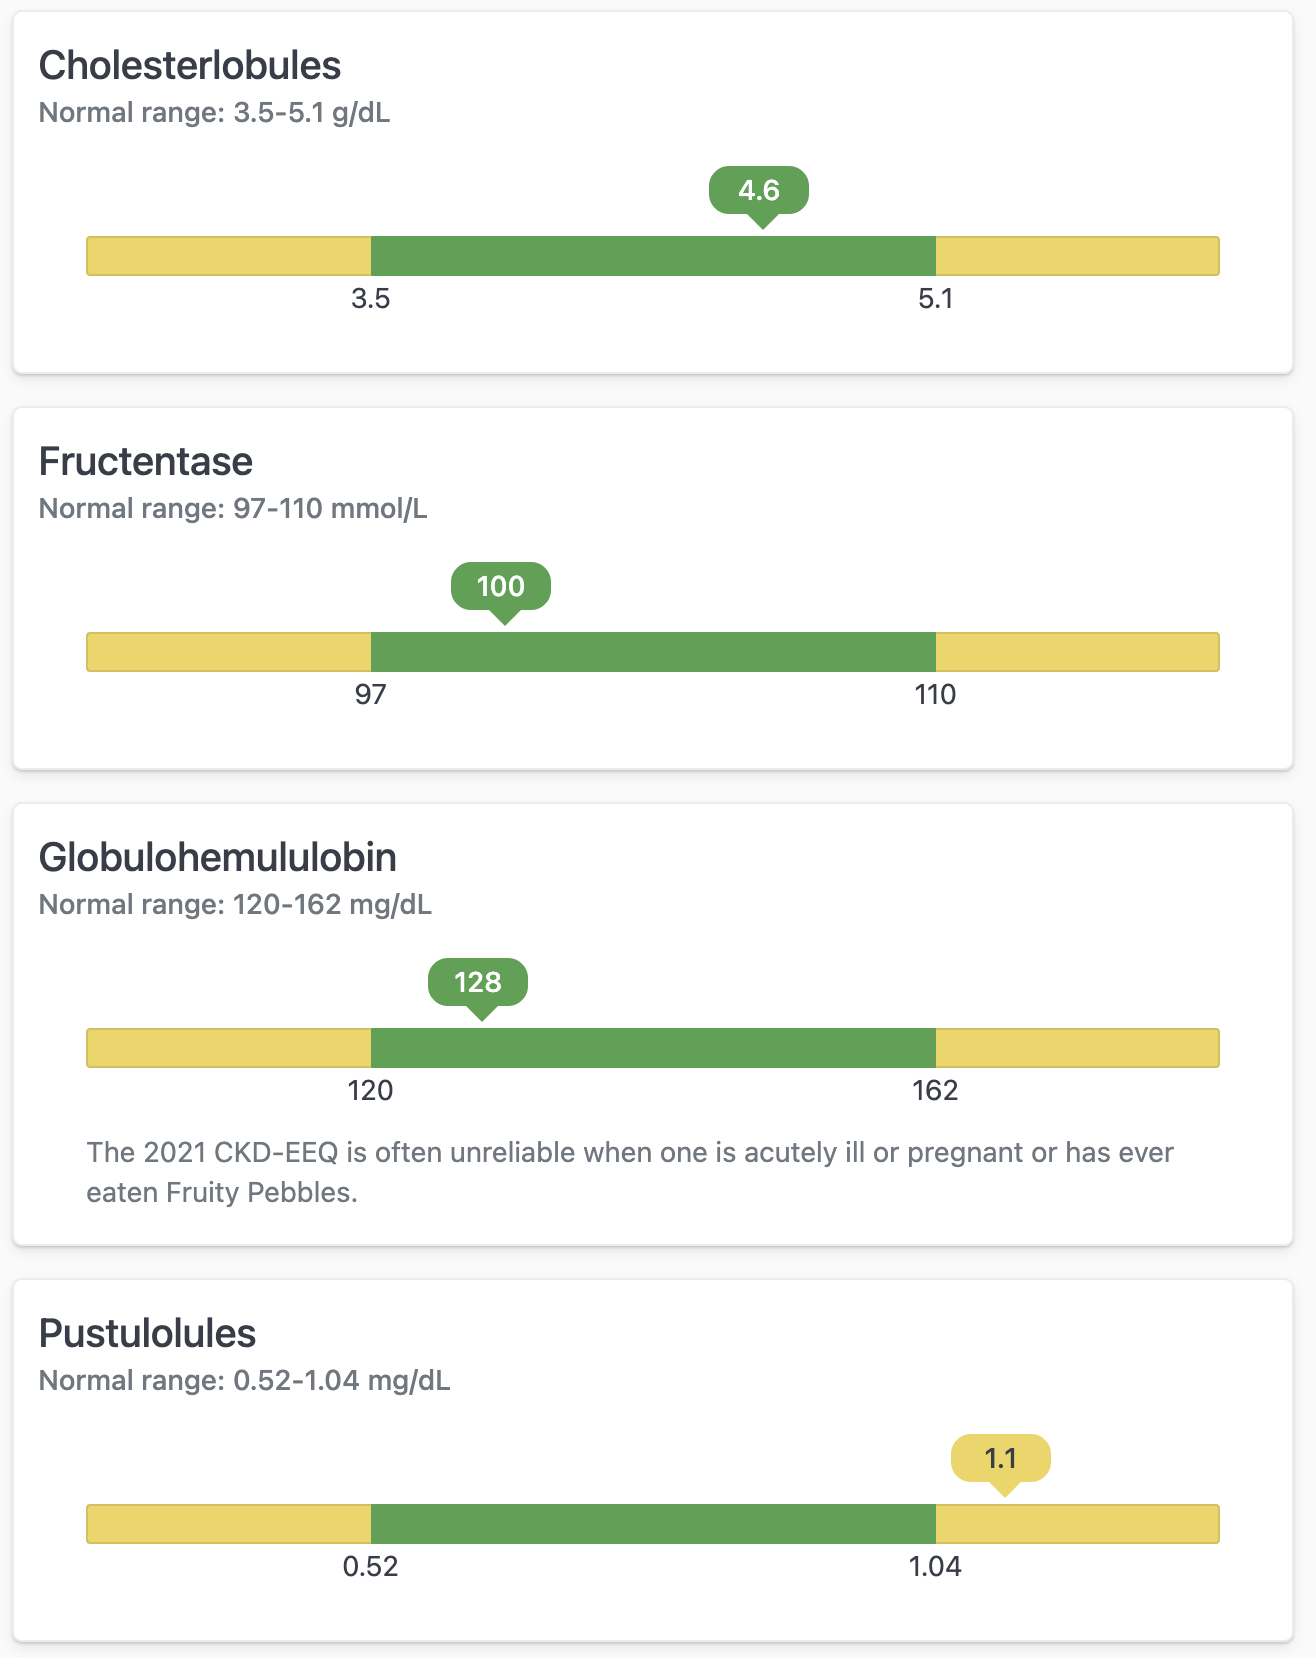
Test results cards
Consistent presentation of multiple metrics with varying ranges
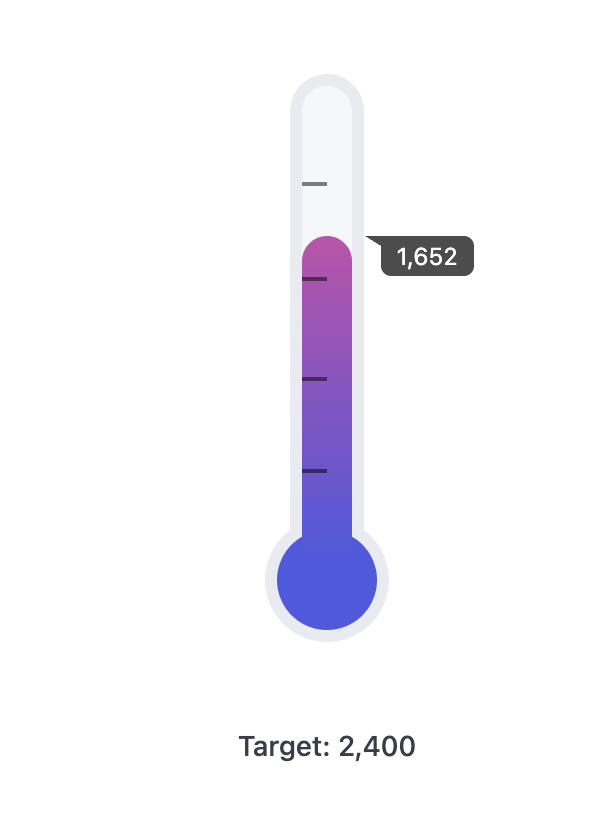
Thermometer
Fundraising style progress indicator
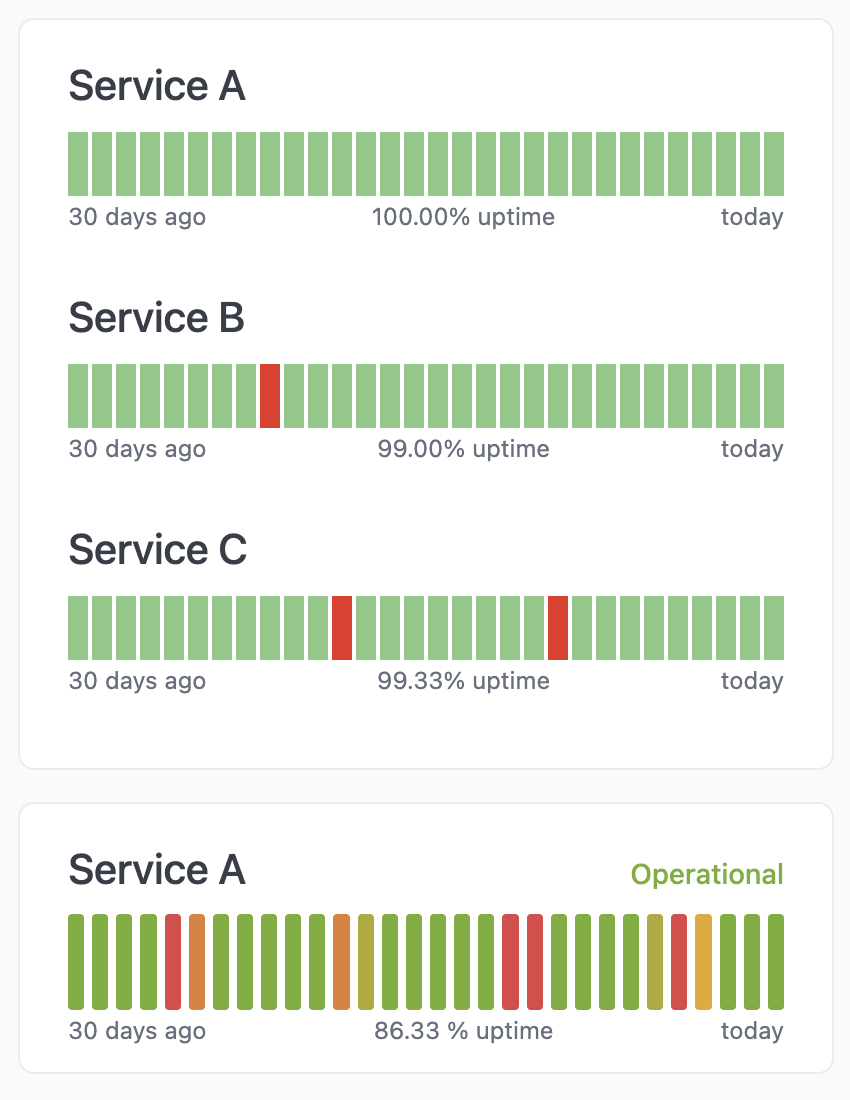
Uptime heatmaps
Use color to show reliability of a service over time
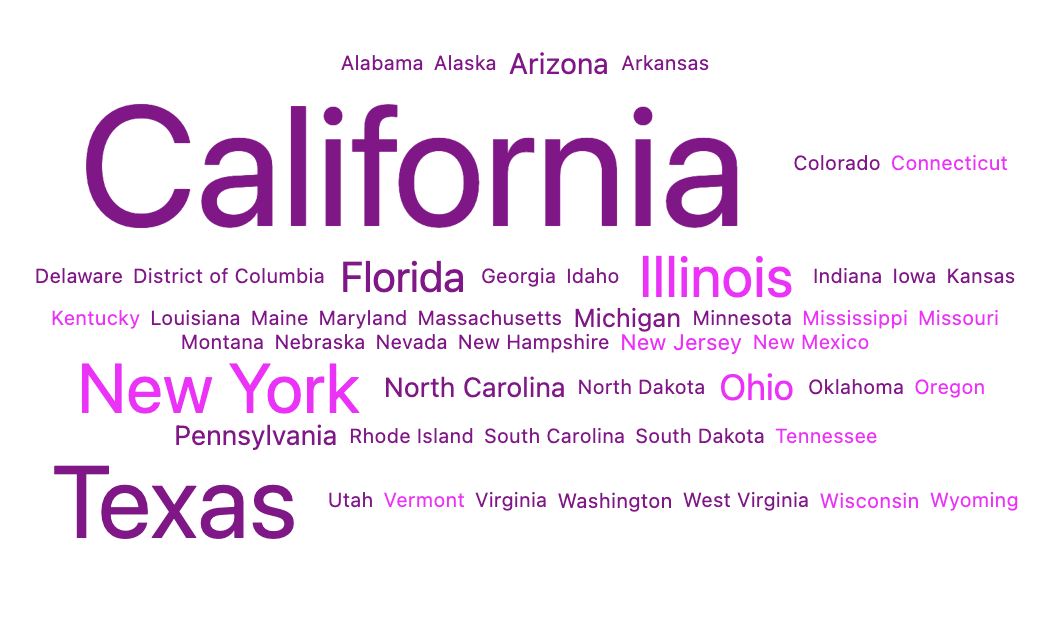
Word cloud
Visualization that highlights frequently-used words