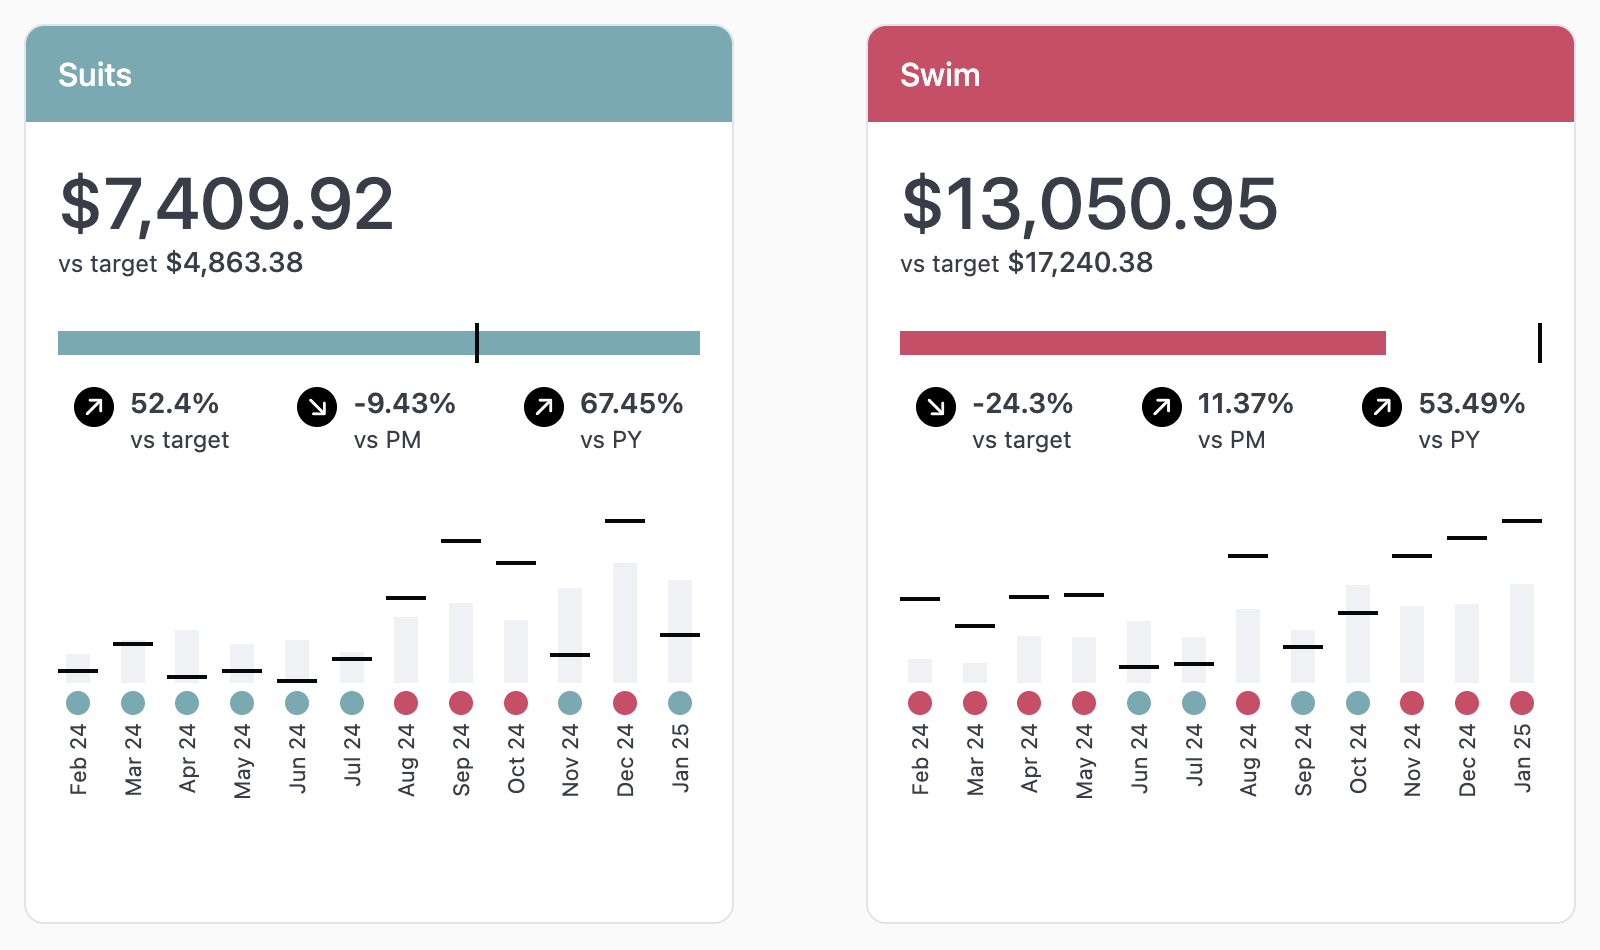
Setup
This markdown in this example complex and references a lot of calculations to position and style elements. Use this sample dataset, instructions, and code to recreate this example in your own instance.- Download the sample CSV.
- Upload the sample CSV to your instance. Refer to the Data input tables guide for instructions.
-
In a new query tab, select all fields except
Candlesticks Count. -
Format the fields as follows:
- Currency -
Total SalesandTarget Sales - Percent -
Progress Bar Value,Progress Bar Target,From Target,Candle Value,Candle Target,Change Py, andChange Pm
- Currency -
-
Format
Created At Monthto the month abbreviation with 2 digits for the year. -
Sort the query so the most recent month in the data set,
Feb 25, is first.
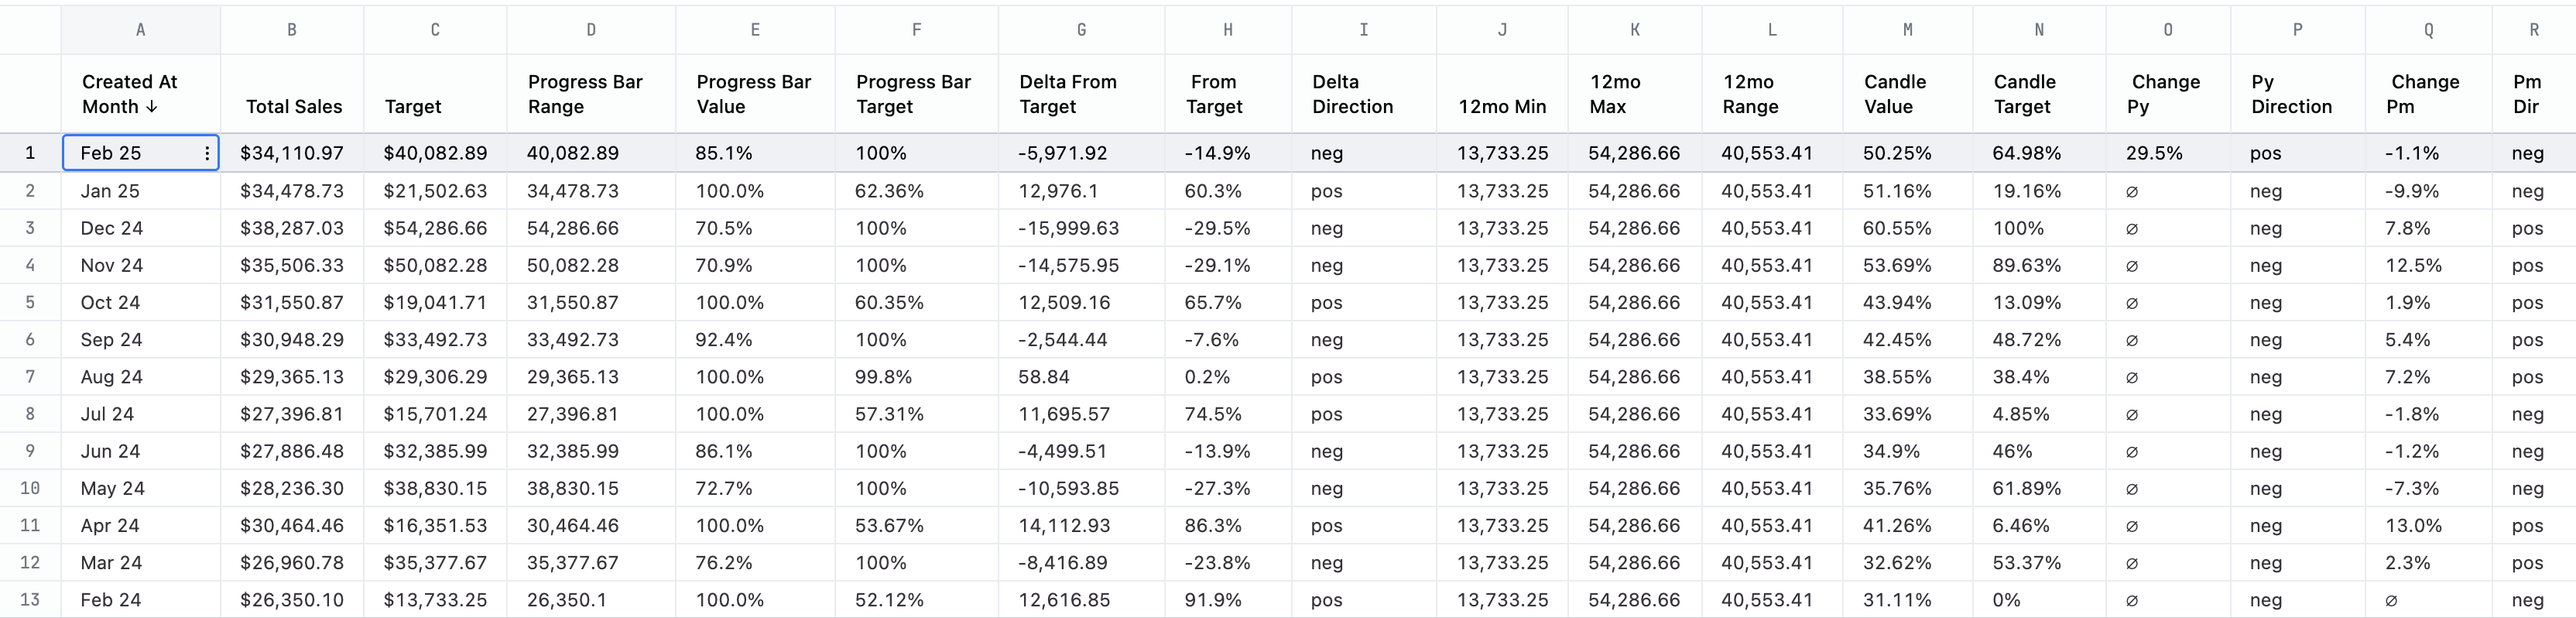
| Col | Name | Calculation formula | Purpose |
|---|---|---|---|
| D | Progress Bar Range | =MAX(B1, C1) | Denominator for the progress bar |
| E | Progress Bar Value | =B1 / D1 | % fill for the progress bar |
| F | Progress Bar Target | =C1 / D1 | % position for the target mark |
| G | Delta From Target | =B1 - C1 | value change from target |
| H | % From Target | =G1 / C1 | % change from target (used in up/down arrows ) |
| I | Delta Direction | =IF(G1 >= 0, “pos”, “neg”) | class name used to color the card header, progress bars and candle dots |
| J | 12mo Min | =MIN(B:C) | smallest of all the Total Sales and Target values |
| K | 12mo Max | =MAX(B:C) | largest of all the Total Sales and Target values |
| L | 12mo Range | =K1 - J1 | the denominator for all the candle position calculations |
| M | Candle Value | =(B1 - J1) / L1 | % fill for each candle |
| N | Candle Target | =(C1 - J1) / L1 | % position for each candle target mark |
| O | % Change Py | =(B1 - B13) / B13 | % change from previous year (used in up/down arrows) |
| P | Py Direction | =IF(O1 >= 0, “pos”, “neg”) | class name used to point previous year change arrow up or down |
| Q | % Change Pm | =(B1 - B2) / B2 | % change from previous month (used in up/down arrows) |
| R | Pm Direction | =IF(Q1 >= 0, “pos”, “neg”) | class name used to point previous month change arrow up or down |