X in either an X-axis or Y-axis field in the Chart Options:
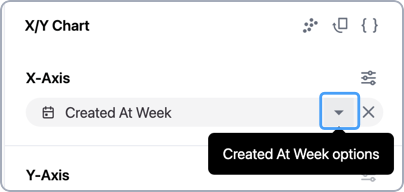
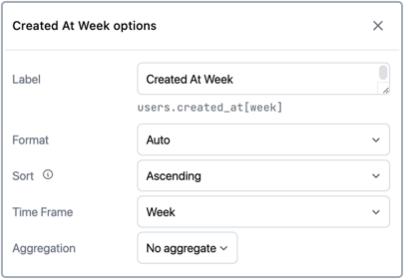
X-Axis series configuration
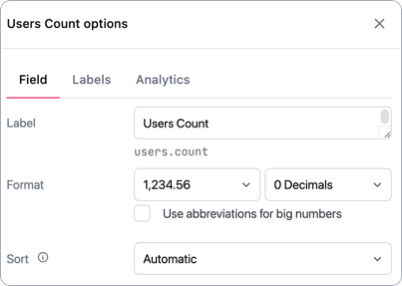
Y-Axis series configuration
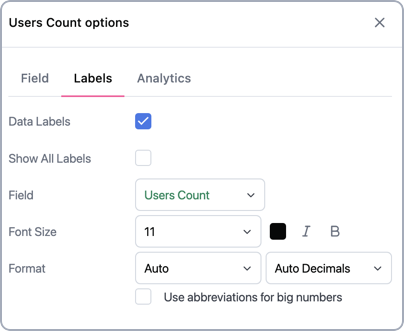
Visualization data labels
Trendlines / moving average / regression lines
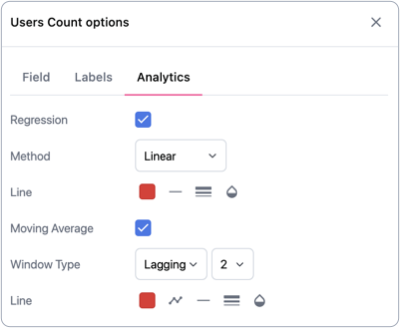
Configure individual chart series in Omni, including chart type, axis assignment, label formatting, and data display options.
X in either an X-axis or Y-axis field in the Chart Options: