Example query
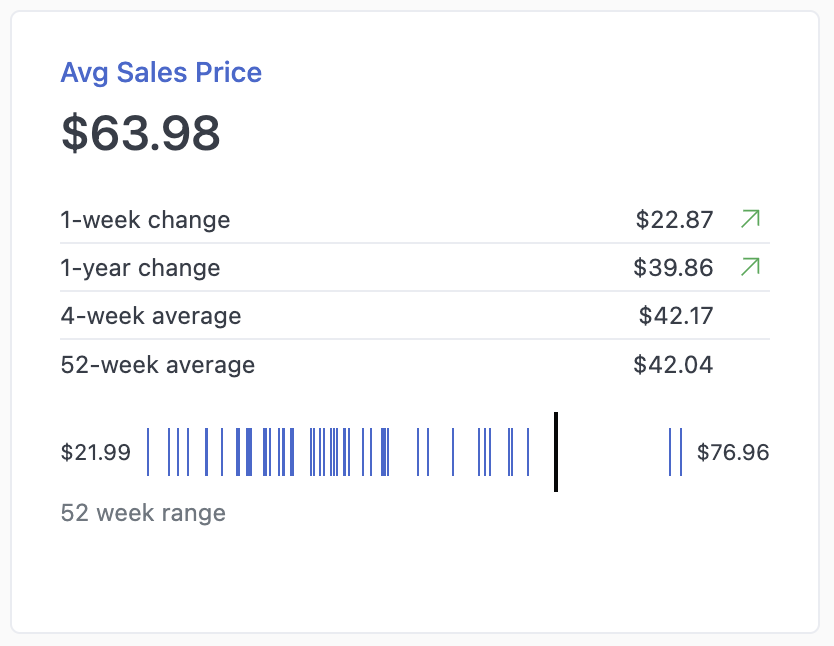
The example code references a lot of calculations to position and style elements. Below is a screenshot of the query as a reference.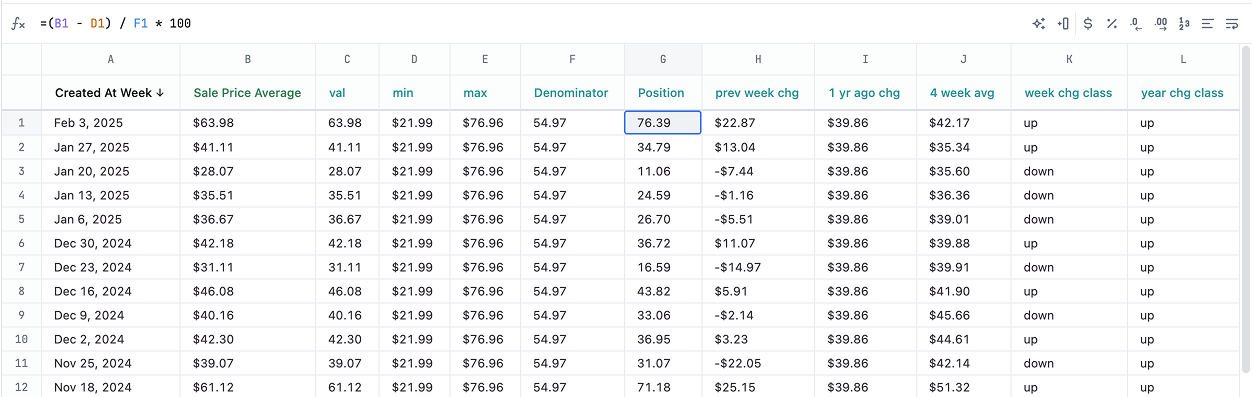
Example code
<style>
.tick-chart {
  display: grid;
  grid-template-columns: min-content 1fr min-content;
  gap: var(--size2);
  align-items: center;
  height: var(--size8);

  & .tick-label {
    font-size: var(--font-xxs);
    color: var(--color-text3);

    &.min-label {
      text-align: right;
    }

    &.max-label {
      text-align: left;
    }
  }

  & .ticks {
    margin: 0;
    padding: 0;
    height: var(--size6);
    position: relative;
    list-style: none;

    & li {
      position: absolute;
      background-color: #4269D0;
      height: var(--size6);
      width: 1px;
      margin: 0;
      padding: 0;
    }

    & li.focus-tick {
      width: 2px;
      background-color: var(--color-text4);
      height: var(--size10);
      top: -8px;
    }
  }
}

.compare-table {
  margin: var(--size4) 0;
  padding: 0;
  color: var(--color-text3);
  font-size: var(--font-xs);
  width: 100%;

  tr {
    & td {
      border-bottom: 1px solid var(--color-border1);
      height: var(--size6);
      padding: 0;
    }

    & .compare-label {
      width: 100%;
    }

    & .compare-value {
      padding-inline: var(--size2);
      text-align: right;
    }

    & .compare-change {
      width: var(--size5);
    }

    & .change-icon {
      height: var(--size5);
      width: var(--size5);
      display: none;
    }

    & .compare-change.up {
      color: #3ca951;

      & .up-arrow {
        display: flex;
      }
    }

    & .compare-change.down {
      color: #ff725c;

      & .down-arrow {
        display: flex;
      }
    }

    & .compare-change.same {
      color: var(--color-text1);

      & .no-change {
        display: flex;
      }
    }
  }

  tr.last-row td {
    border-bottom: 0;
  }
}

.bignum {
  h4 {
    font-size: var(--font-sm);
    color: #4269D0;
    margin: 0;
  }

  h2 {
    font-size: var(--font-xl);
    color: var(--color-key);
    margin: 0;
    color: var(--text4);
    font-weight: bold;
  }
}

.footnote {
  font-size: var(--font-xs);
  color: var(--color-text1);
  padding-block: var(--size1);
}
</style>

<div class="bignum">
  <h4>Avg Sales Price</h4>
  <h2>{{result._first.order_items.sale_price_average.value}}</h2>
</div>

<table class="compare-table">
  <tr>
    <td class="compare-label">1-week change</td>
    <td class="compare-value">{{result._first.calc_6.value}}</td>
    <td class="compare-change {{result._first.calc_9.value}}">
      <span class="change-icon up-arrow">
        <svg xmlns="http://www.w3.org/2000/svg" width="20" height="20" viewBox="0 0 24 24" fill="none" stroke="currentColor" stroke-width="1.5" stroke-linecap="round" stroke-linejoin="round">
          <path stroke="none" d="M0 0h24v24H0z" fill="none"/>
          <path d="M17 7l-10 10" />
          <path d="M8 7l9 0l0 9" />
        </svg>
      </span>
      <span class="change-icon down-arrow">
        <svg xmlns="http://www.w3.org/2000/svg" width="20" height="20" viewBox="0 0 24 24" fill="none" stroke="currentColor" stroke-width="1.5" stroke-linecap="round" stroke-linejoin="round">
          <path stroke="none" d="M0 0h24v24H0z" fill="none"/>
          <path d="M7 7l10 10" />
          <path d="M17 8l0 9l-9 0" />
        </svg>
      </span>
      <span class="change-icon no-change">
        <svg xmlns="http://www.w3.org/2000/svg" width="20" height="20" viewBox="0 0 24 24" fill="none" stroke="currentColor" stroke-width="1.5" stroke-linecap="round" stroke-linejoin="round">
          <path stroke="none" d="M0 0h24v24H0z" fill="none"/>
          <path d="M5 12l14 0" />
        </svg>
      </span>
    </td>
  </tr>
  <tr>
    <td class="compare-label">1-year change</td>
    <td class="compare-value">{{result._first.calc_7.value}}</td>
    <td class="compare-change {{result._first.calc_10.value}}">
      <span class="change-icon up-arrow">
        <svg xmlns="http://www.w3.org/2000/svg" width="20" height="20" viewBox="0 0 24 24" fill="none" stroke="currentColor" stroke-width="1.5" stroke-linecap="round" stroke-linejoin="round">
          <path stroke="none" d="M0 0h24v24H0z" fill="none"/>
          <path d="M17 7l-10 10" />
          <path d="M8 7l9 0l0 9" />
        </svg>
      </span>
      <span class="change-icon down-arrow">
        <svg xmlns="http://www.w3.org/2000/svg" width="20" height="20" viewBox="0 0 24 24" fill="none" stroke="currentColor" stroke-width="1.5" stroke-linecap="round" stroke-linejoin="round">
          <path stroke="none" d="M0 0h24v24H0z" fill="none"/>
          <path d="M7 7l10 10" />
          <path d="M17 8l0 9l-9 0" />
        </svg>
      </span>
      <span class="change-icon no-change">
        <svg xmlns="http://www.w3.org/2000/svg" width="20" height="20" viewBox="0 0 24 24" fill="none" stroke="currentColor" stroke-width="1.5" stroke-linecap="round" stroke-linejoin="round">
          <path stroke="none" d="M0 0h24v24H0z" fill="none"/>
          <path d="M5 12l14 0" />
        </svg>
      </span>
    </td>
  </tr>
  <tr>
    <td class="compare-label">4-week average</td>
    <td class="compare-value">{{result._first.calc_8.value}}</td>
    <td class="compare-change empty"></td>
  </tr>
  <tr class="last-row">
    <td class="compare-label">52-week average</td>
    <td class="compare-value">{{result._totals._first.order_items.sale_price_average.value}}</td>
    <td class="compare-change empty"></td>
  </tr>
</table>

<div class="tick-chart">
  <div class="tick-label min-label">{{result._first.calc_4.value}}</div>
  <ul class="ticks">
    {{#result}}
    <li style="left: {{calc_1.value}}%"></li>
    {{/result}}
    <li style="left: {{result._first.calc_1.value}}%" class="focus-tick"></li>
  </ul>
  <div class="tick-label max-label">{{result._first.calc_5.value}}</div>
</div>

<div class="footnote">52 week range</div>