
Accessing the profiler
- Open the desired dashboard.
- Click View > Performance profile.
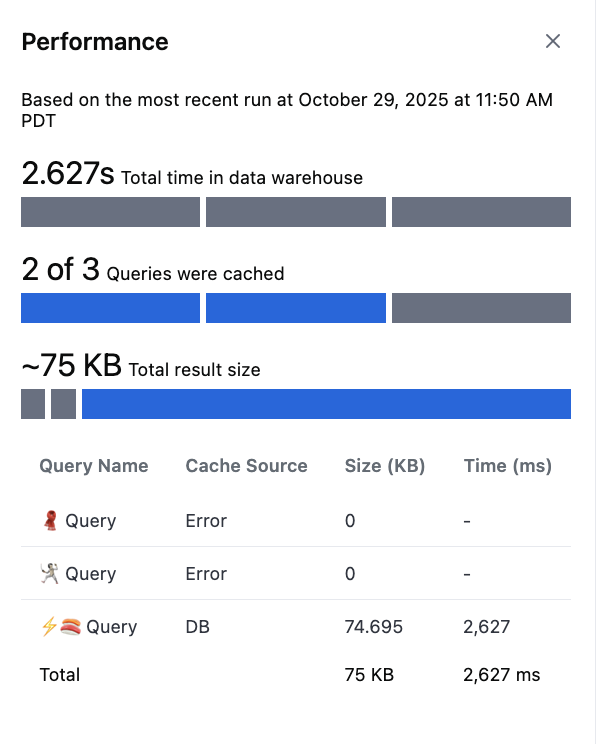
- The profiler opens as a side panel displaying query-level metrics for the latest dashboard run.
Performance metrics
The profiler summarizes performance for the most recent dashboard run, including caching behavior, query timing, and result sizes.Summary metrics
| Metric | Description |
|---|---|
| Total time in data warehouse | The total execution time spent querying the data warehouse (excluding cached results). |
| Queries cached | How many queries were served from cache vs. executed live. “Exact” cache means identical query reuse; “Server requery” indicates a new query was run. |
| Total result size | Combined size of all query results for the dashboard run, in kilobytes (KB). |
Query-level metrics
| Column | Description |
|---|---|
| Query Name | The name of the dashboard tile or query block. |
| Cache Source | Indicates if the query was fetched from cache (Cache (exact)) or required re-execution (Cache (server requery)). |
| Size (KB) | The amount of data returned by the query. Larger results can slow rendering and increase memory usage. |
| Time (ms) | Time spent running the query in the data warehouse. Cached queries will show 0 ms. |