May 14, 2024 - XLOOKUP (beta), Filter Updates, Dimensional Drilling, Excel Downloads, and more!
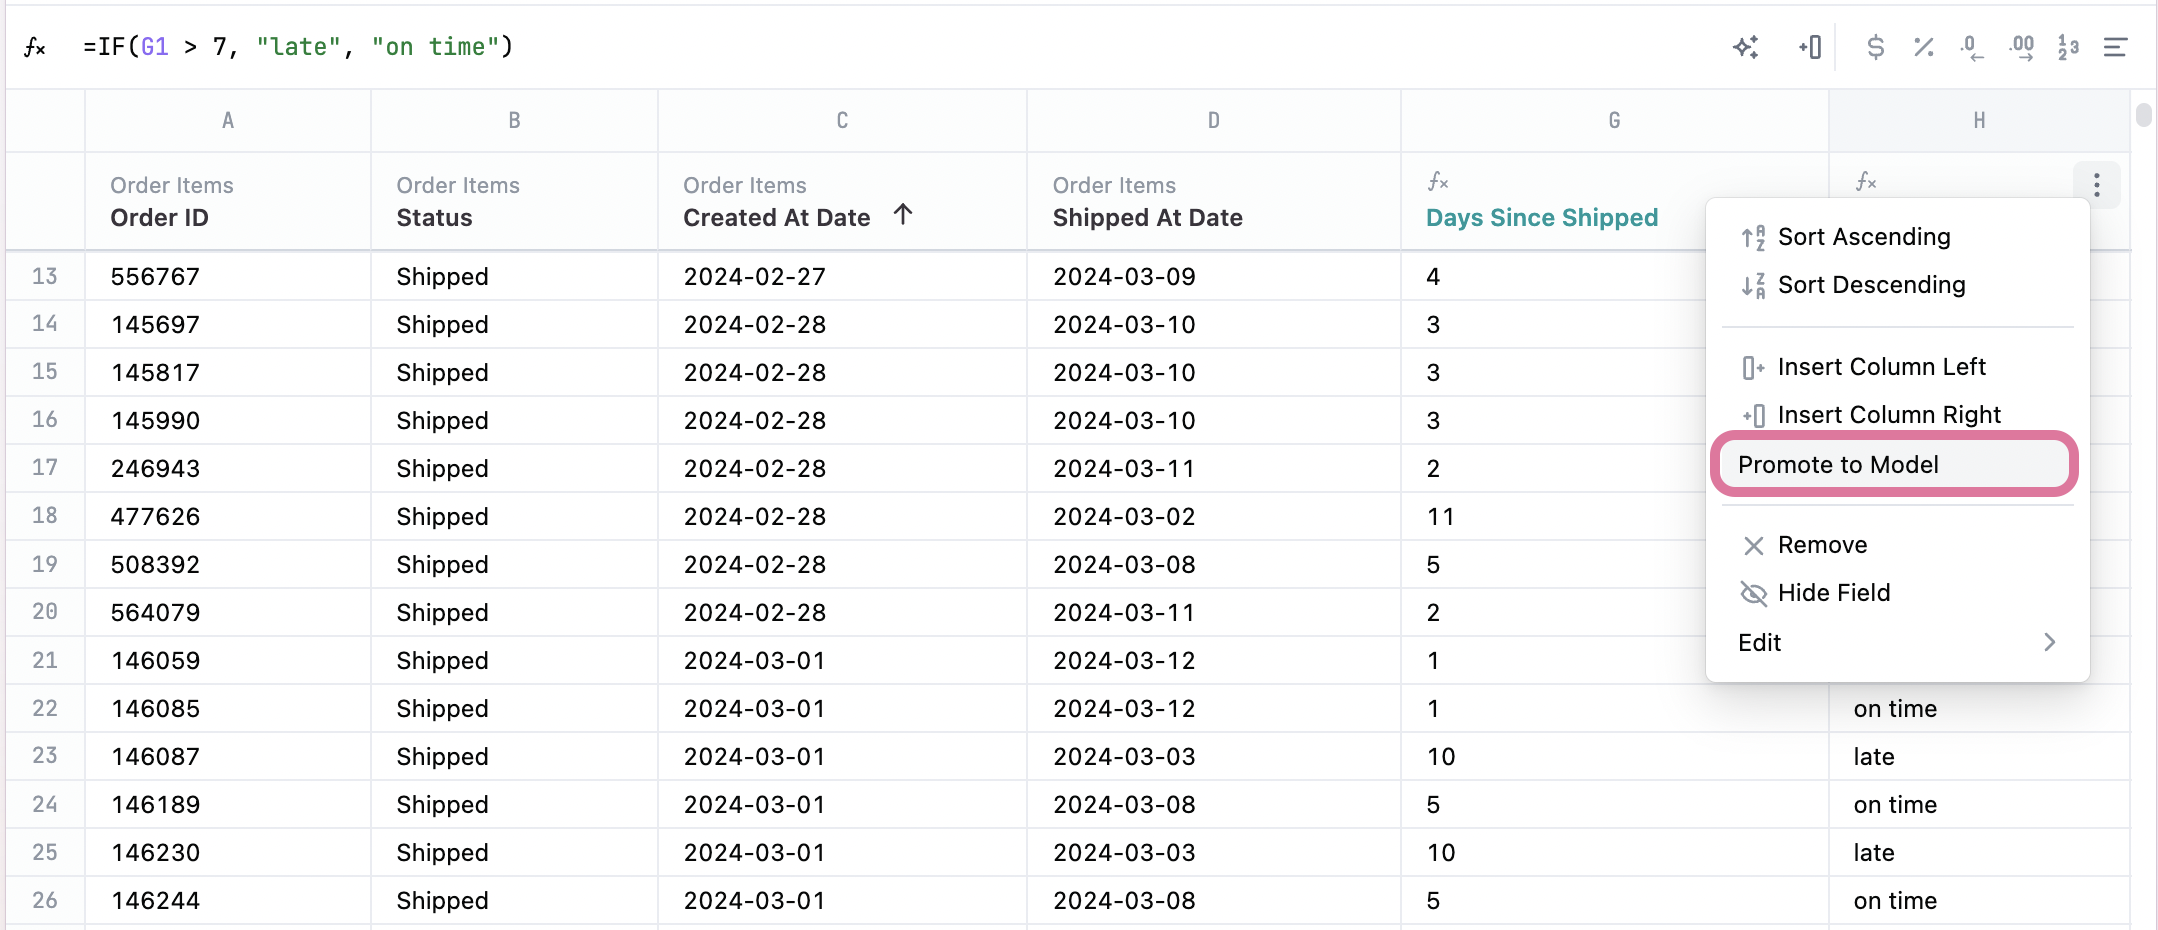
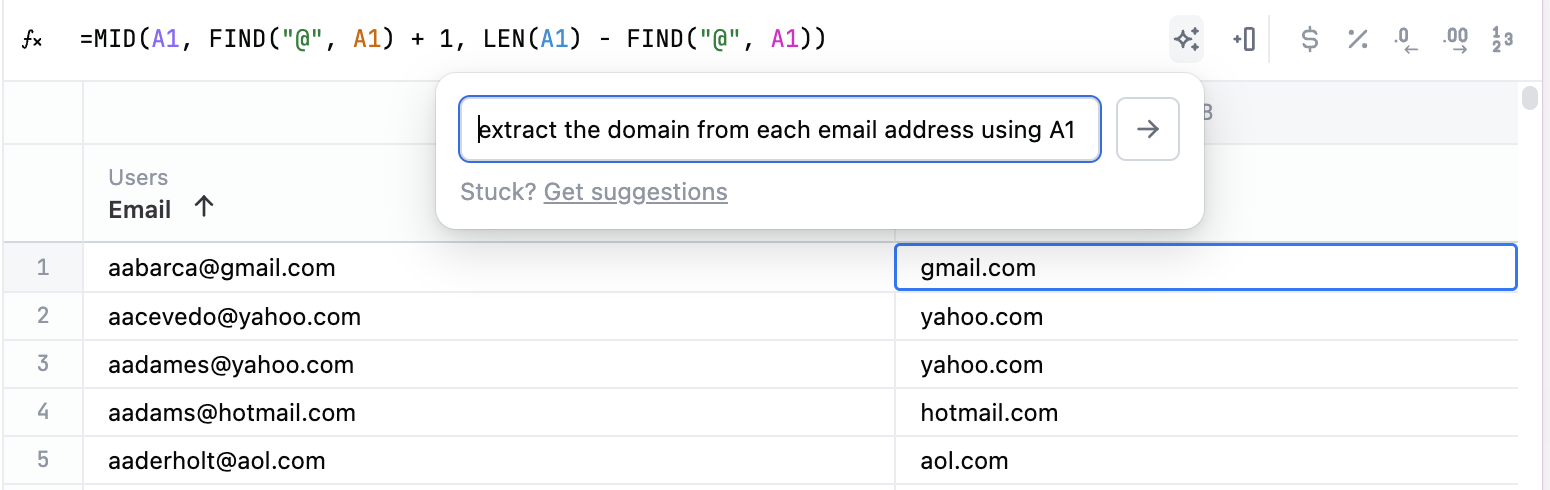
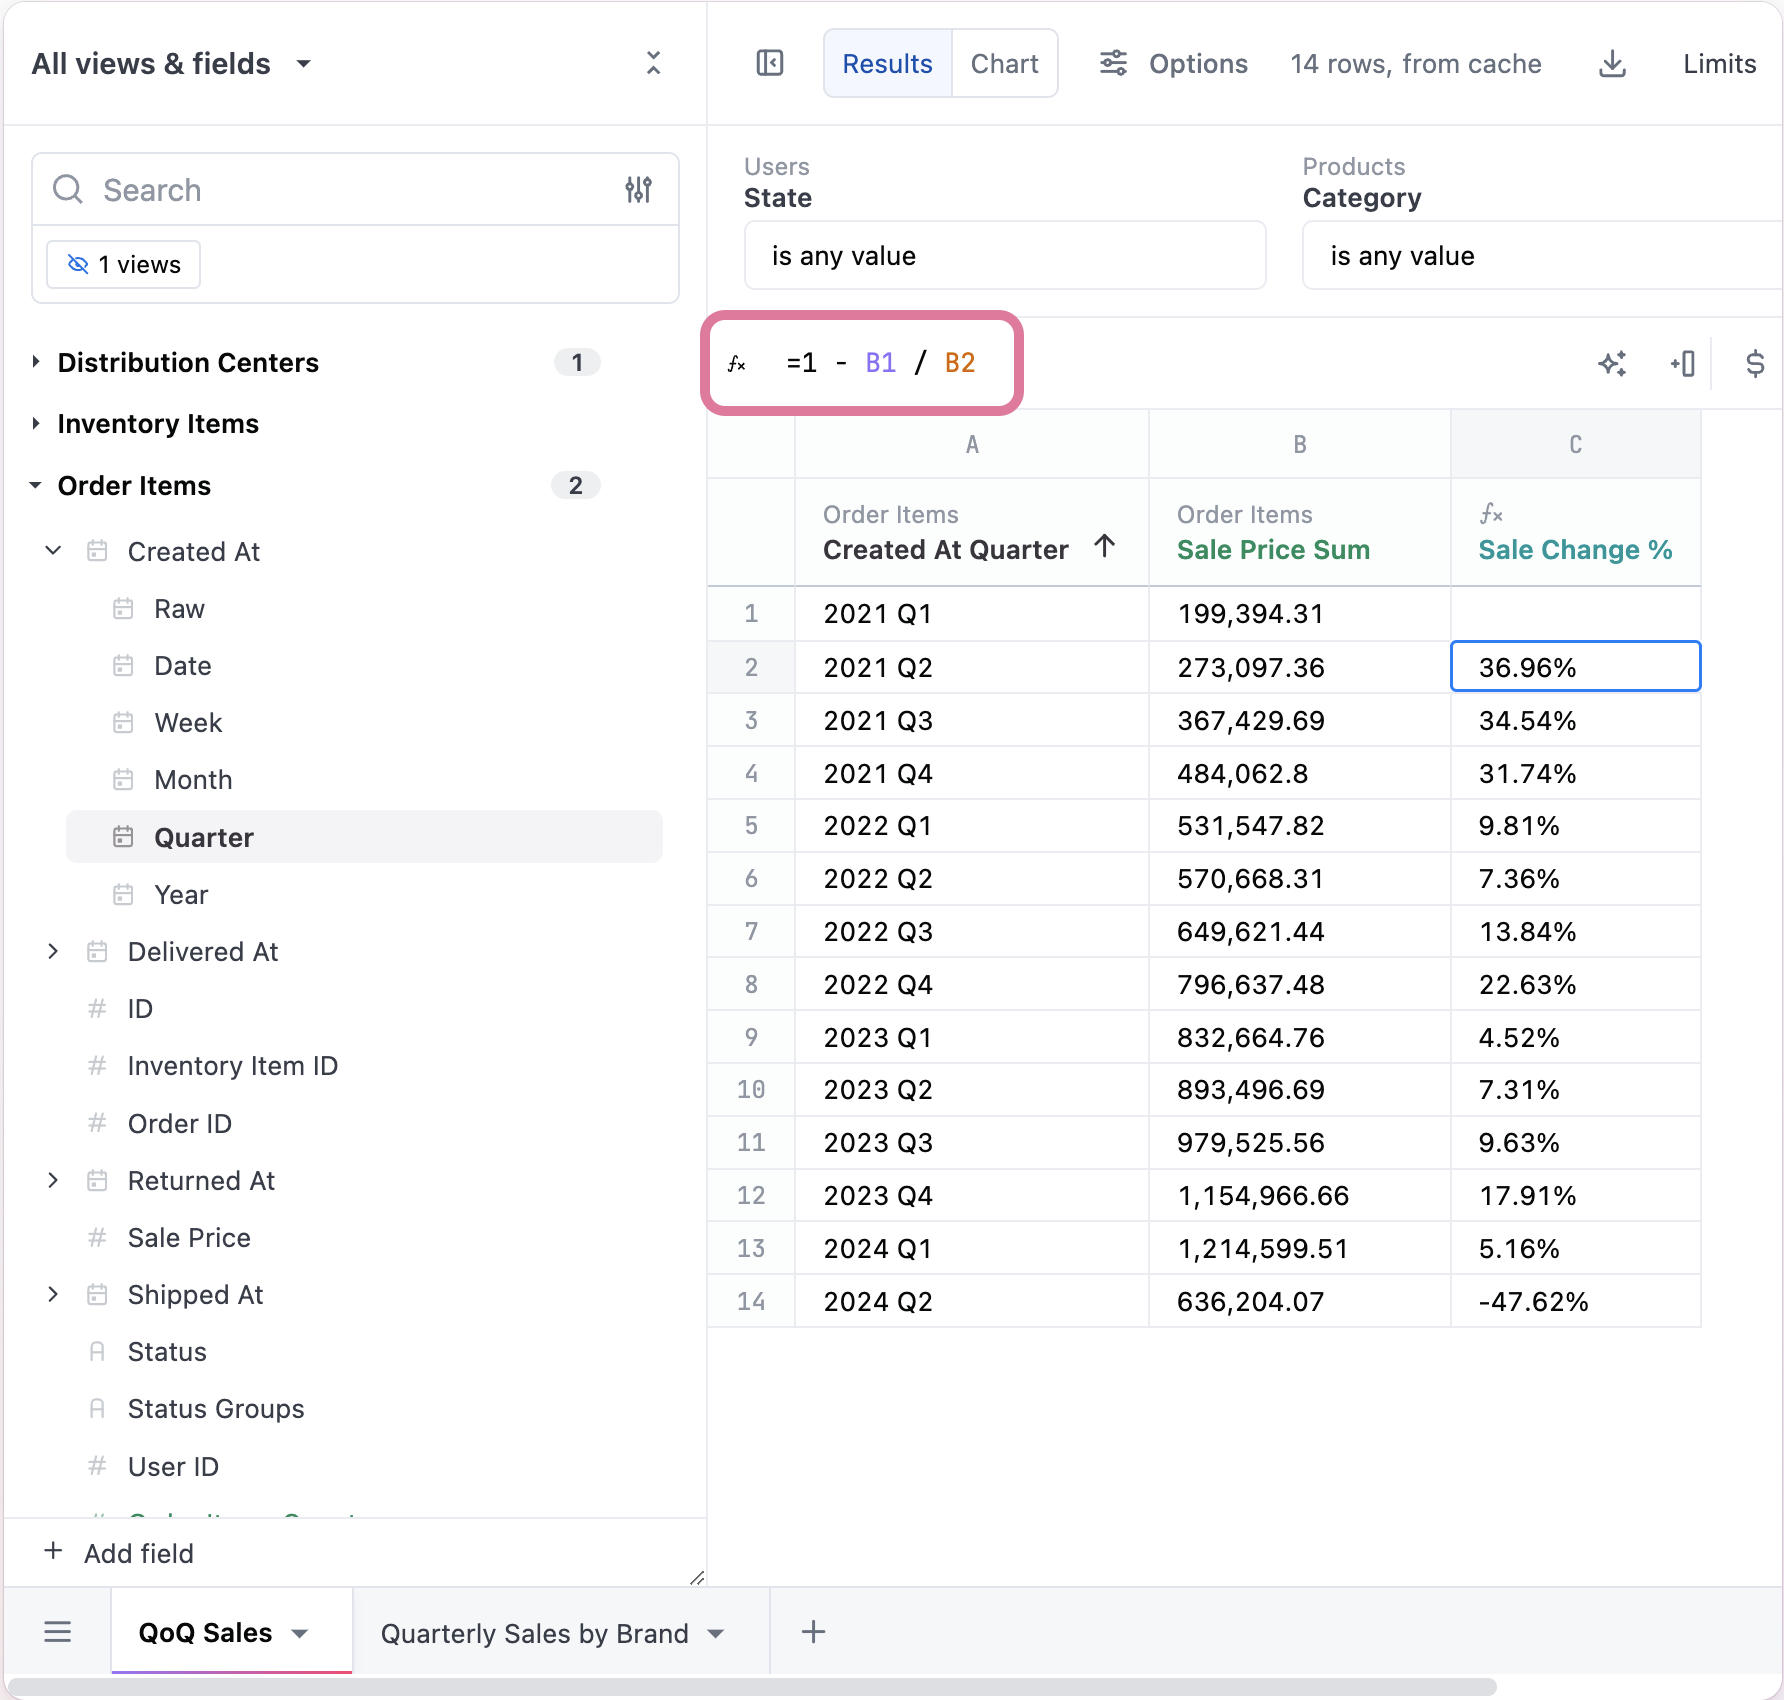
XLOOKUP calculations function (beta)
Execute cross-tab analysis to create time series joins across tabs or use fact lookups in another query tab of the same workbook. Check out the xlookup function documentation to learn more.
Filter updates
We have quite a few updates for different types of filter options!
Compound filters
Have you been waiting for the day you can require two filter conditions in your queries? That day is here ✨

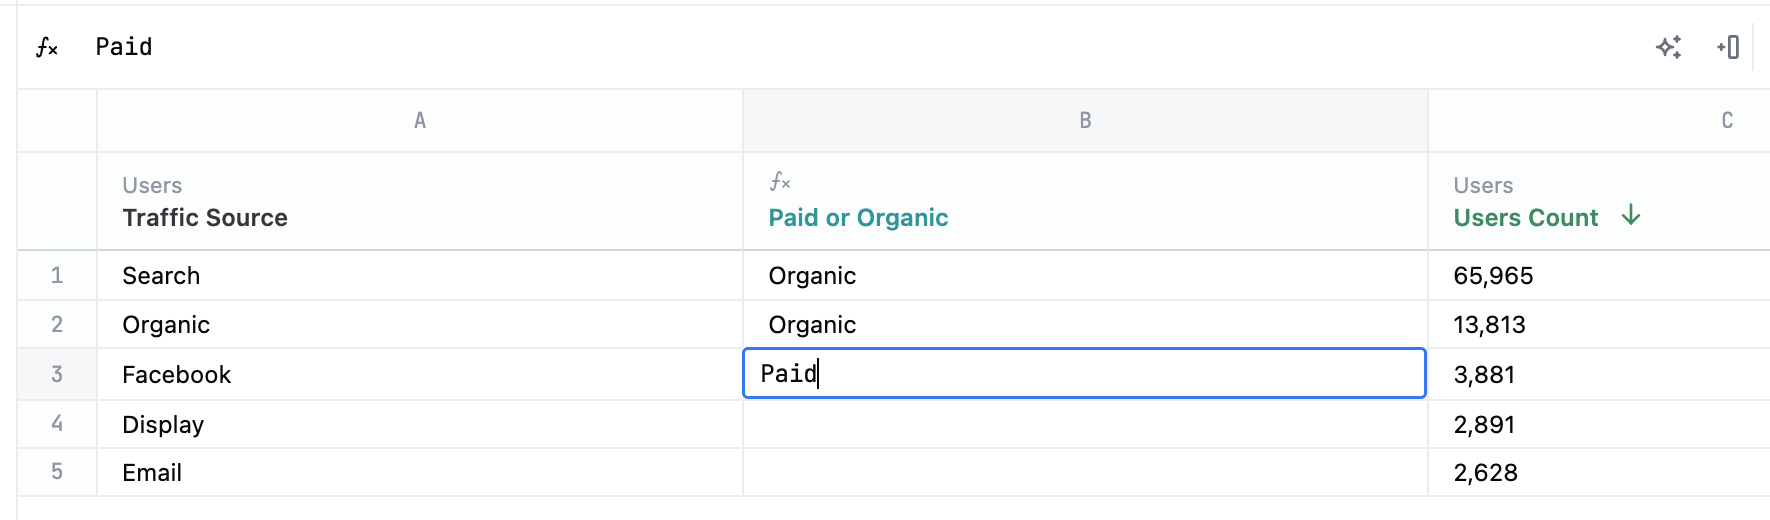
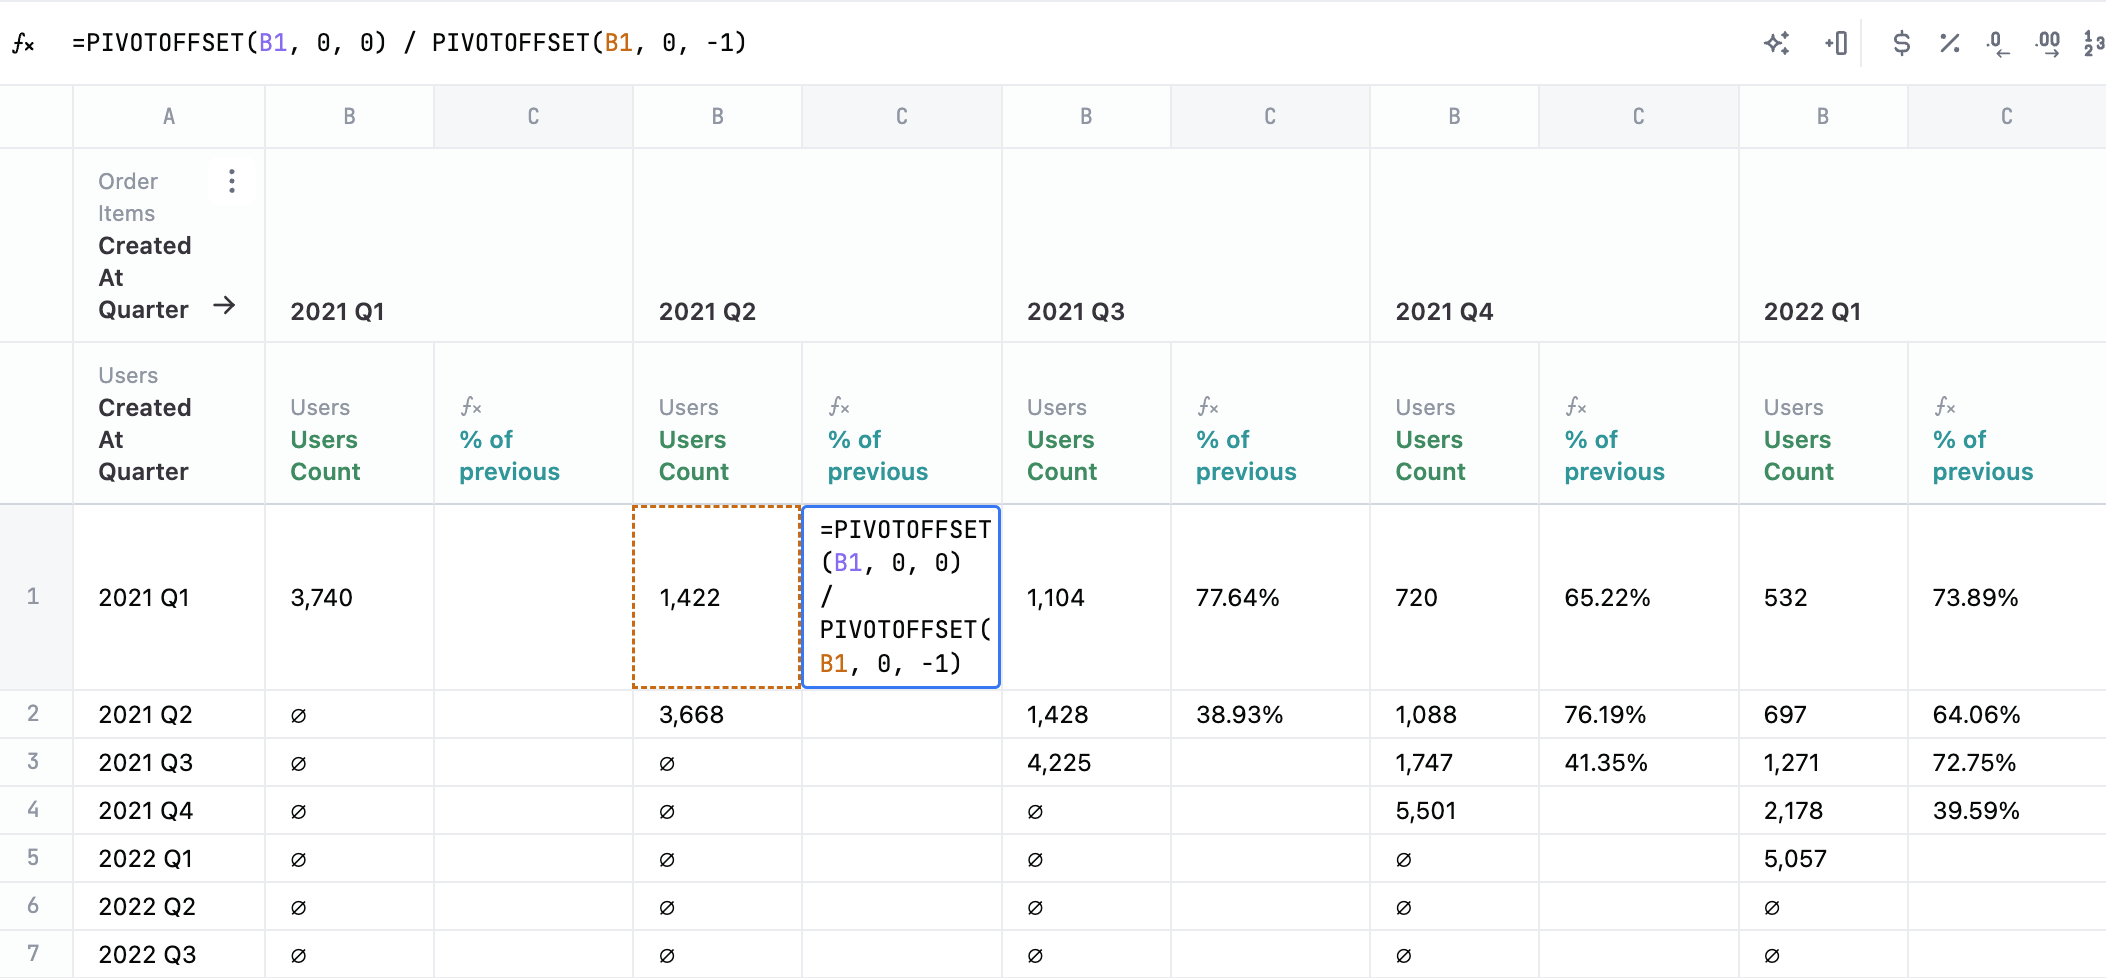
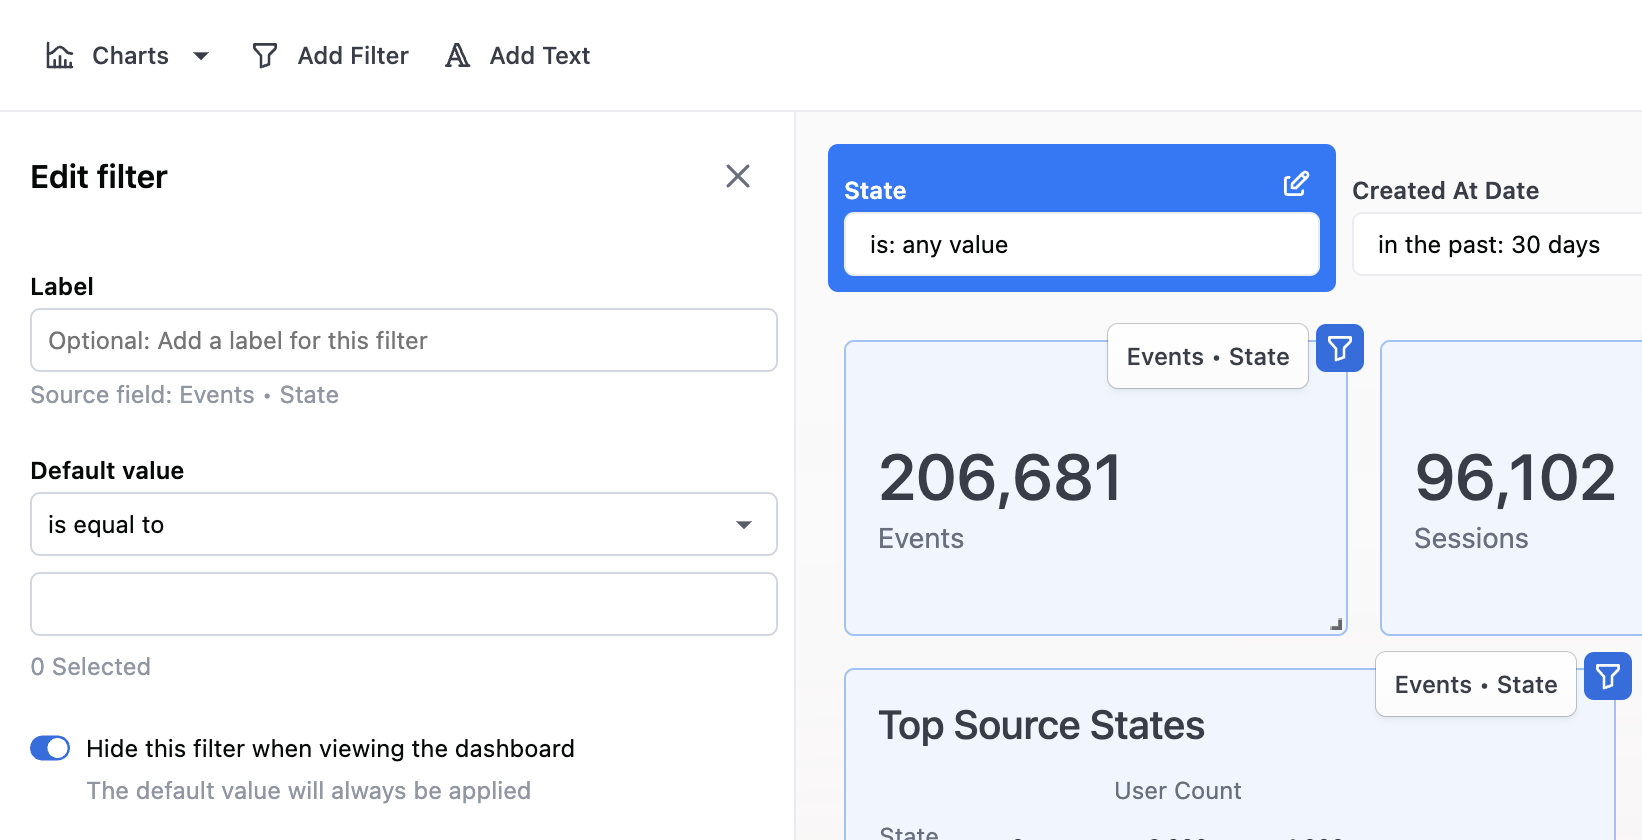
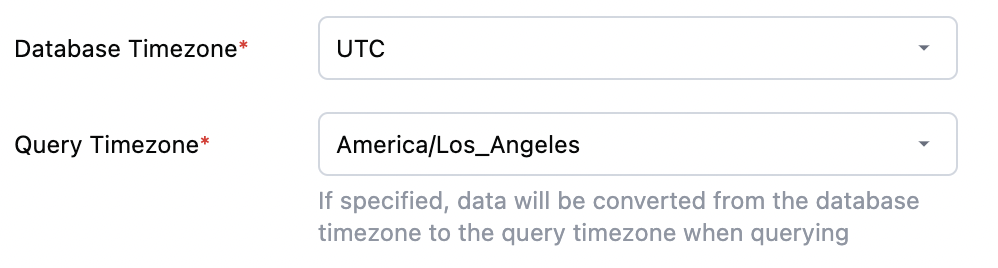
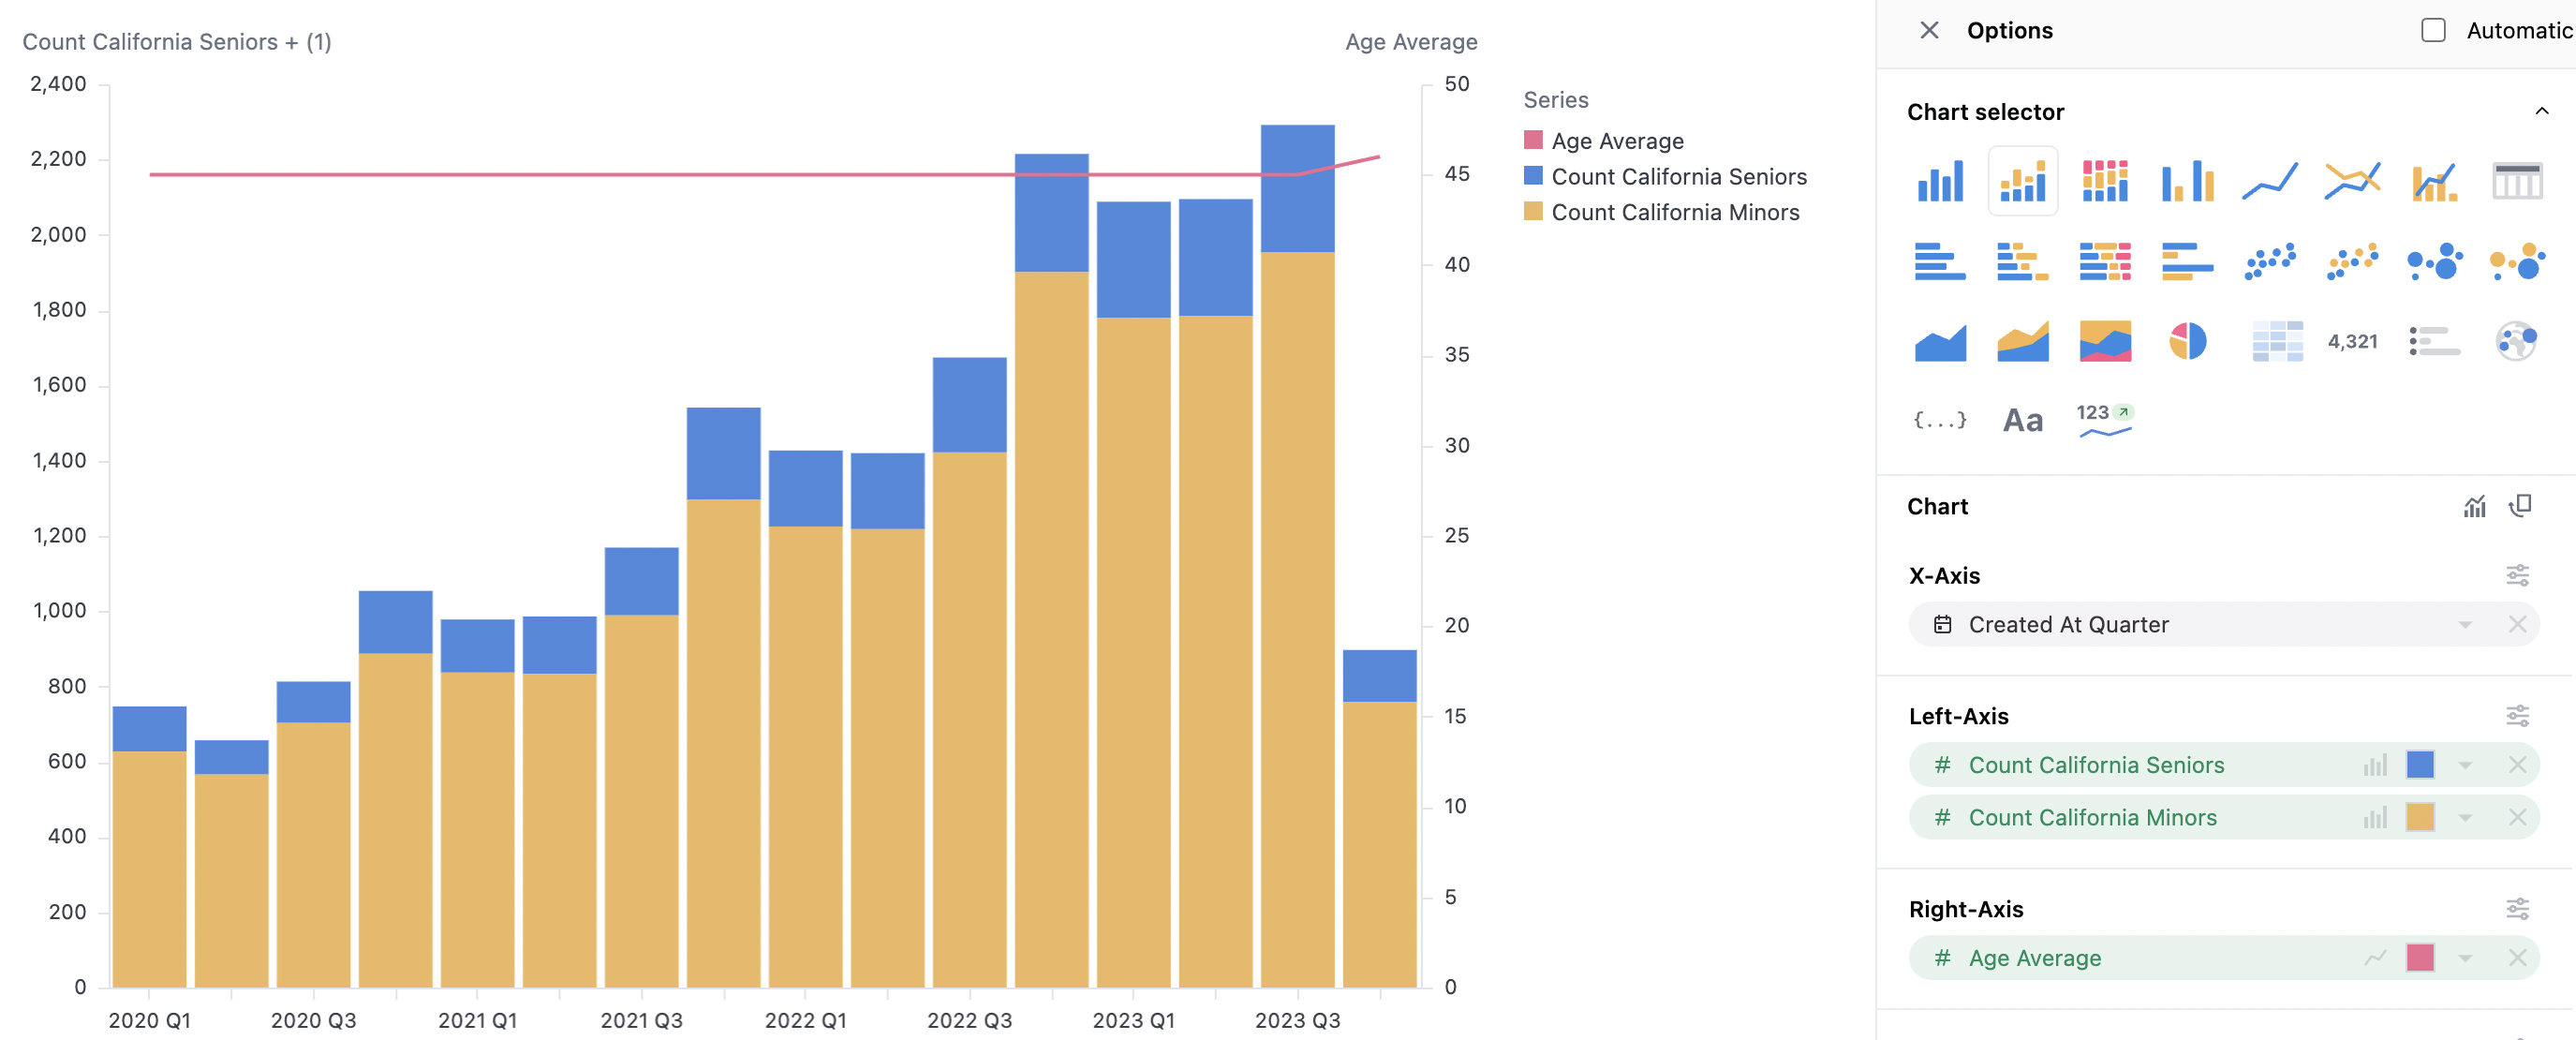
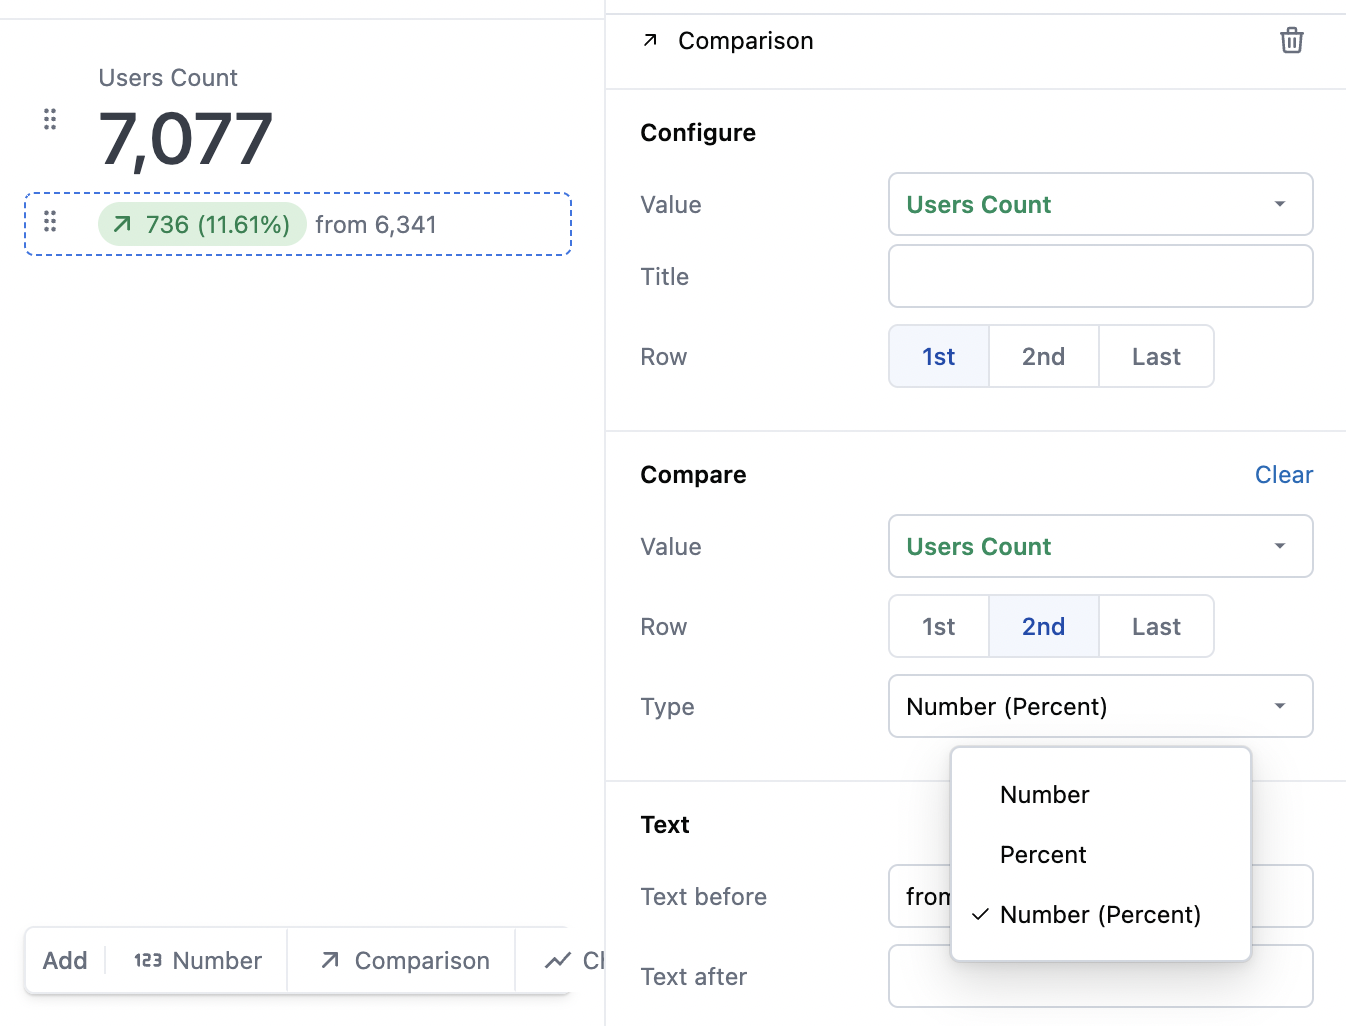
Filters as parameters
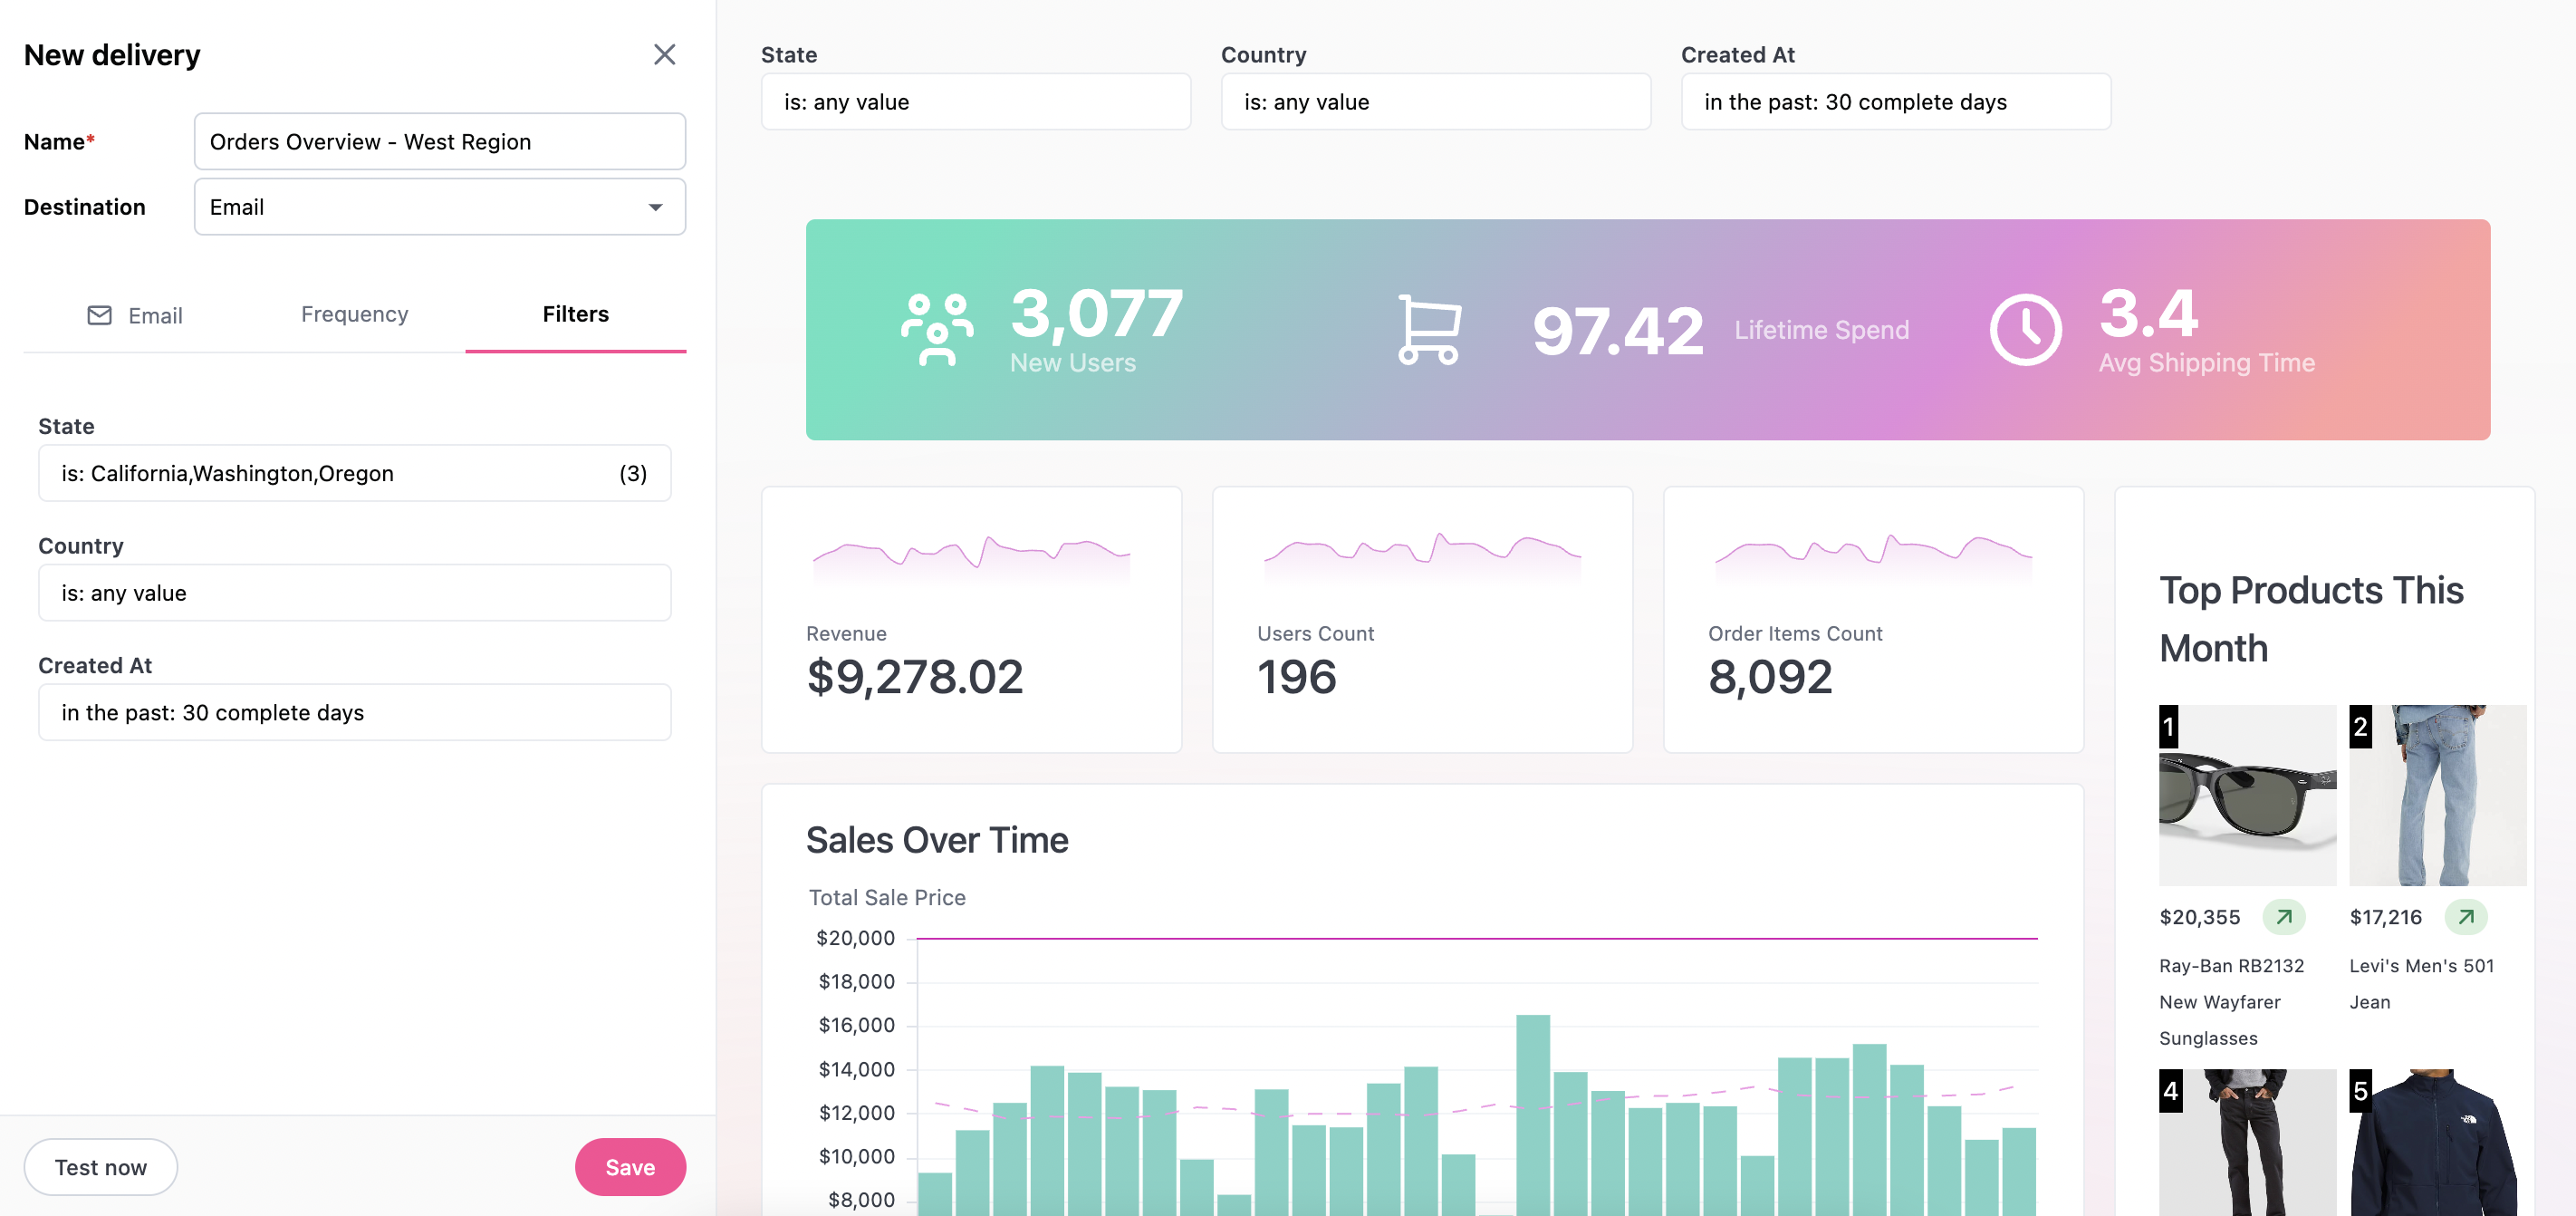
Filters can now be used as parameters by passing through a single-value filter reference to create parameterized reporting. This brings in handy use cases like dynamic formatting, forecasting, or passing filters into calculations.

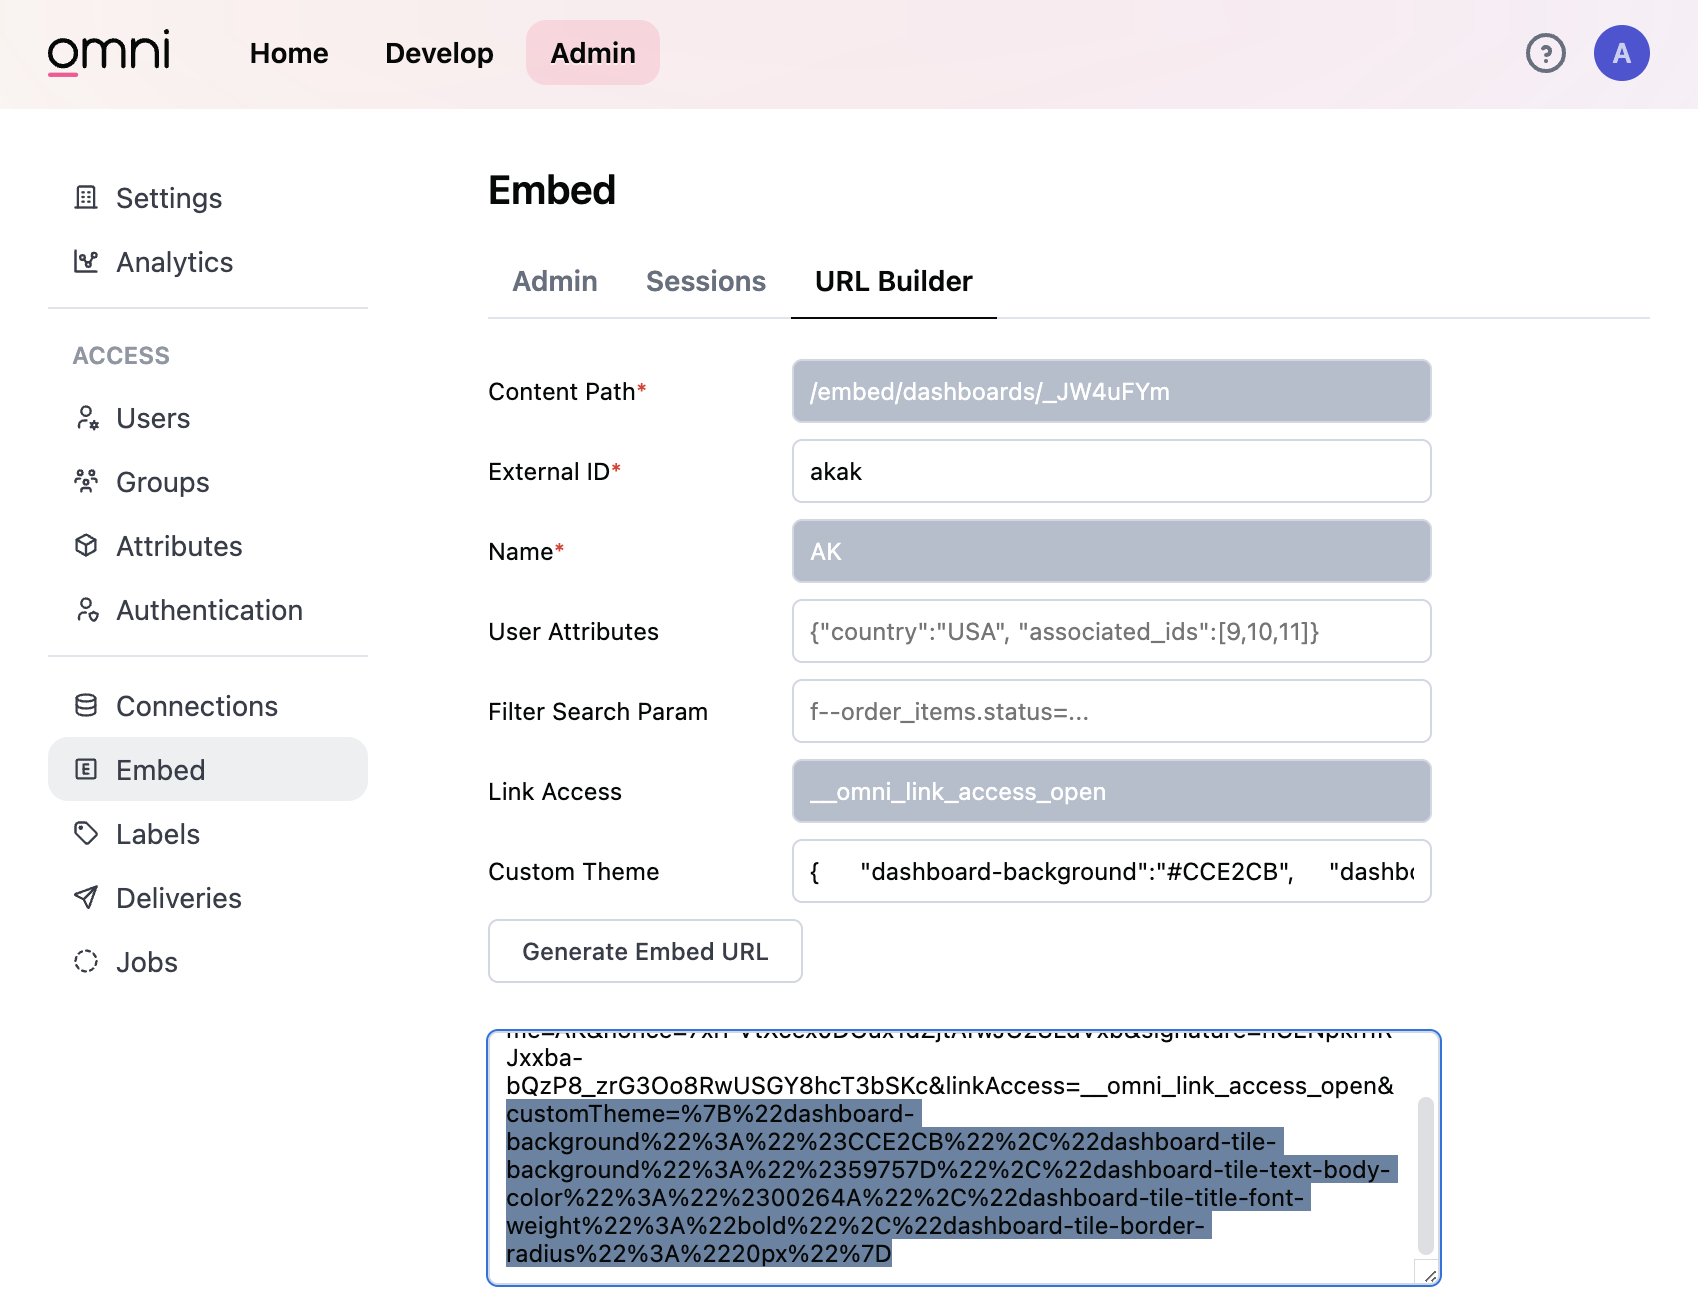
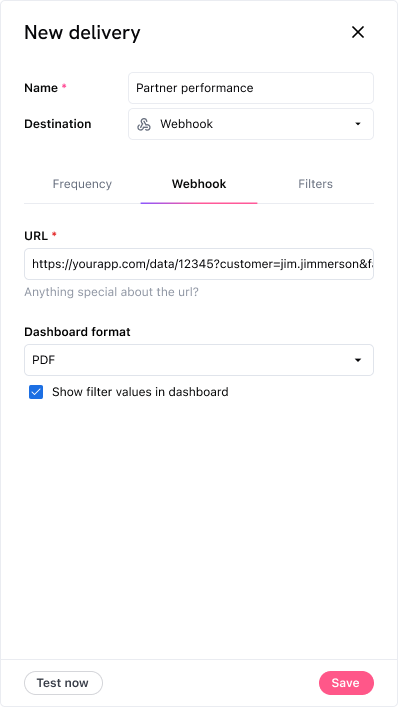
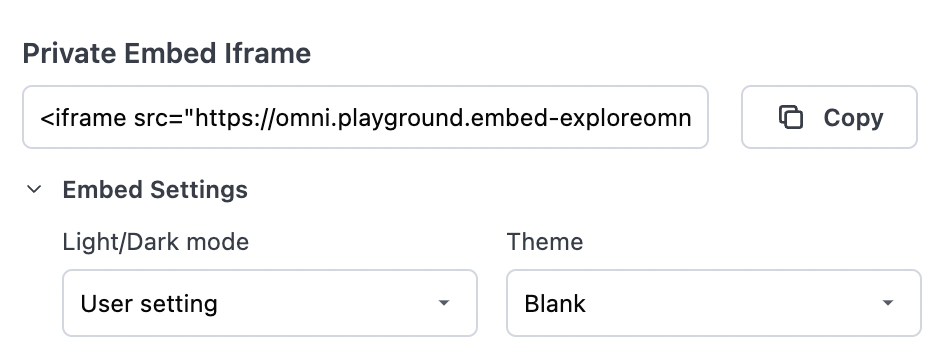
Filters between dashboards 📊
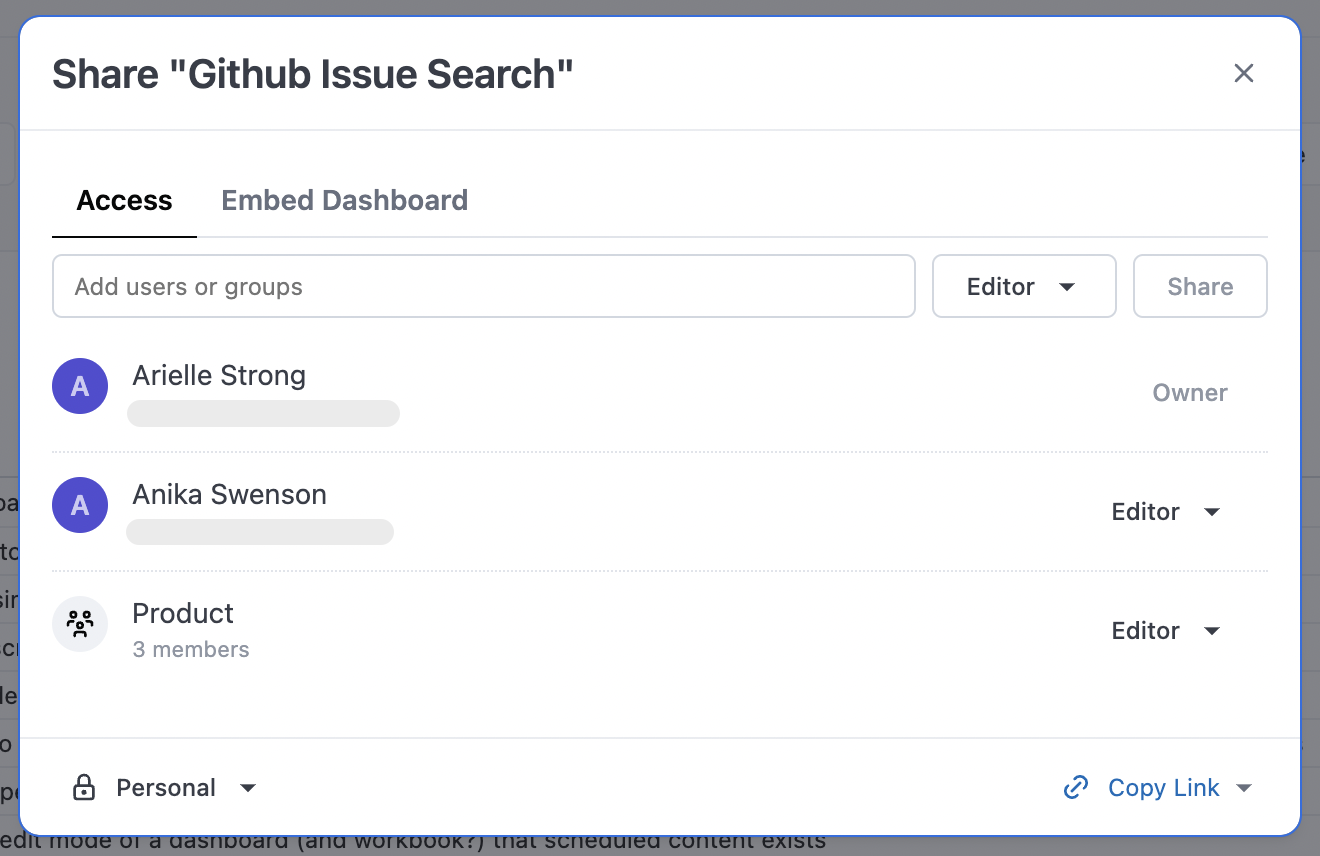
A field's link: parameter can dynamically pass values from fields or user attributes into a linked dashboard, enhancing the workflow experience of navigating directly to a filtered dashboard from a value in a query or a dashboard.
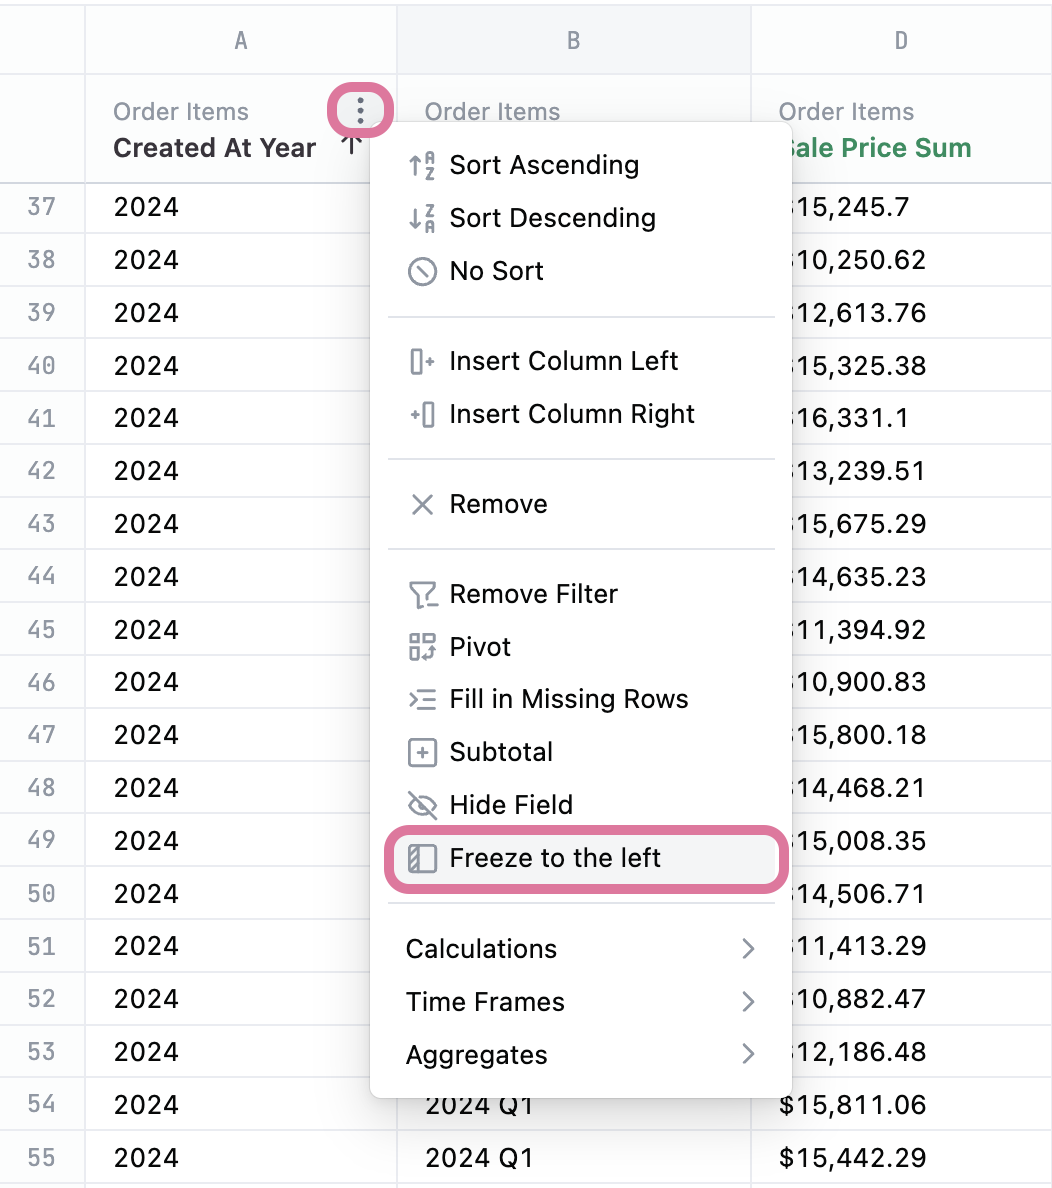
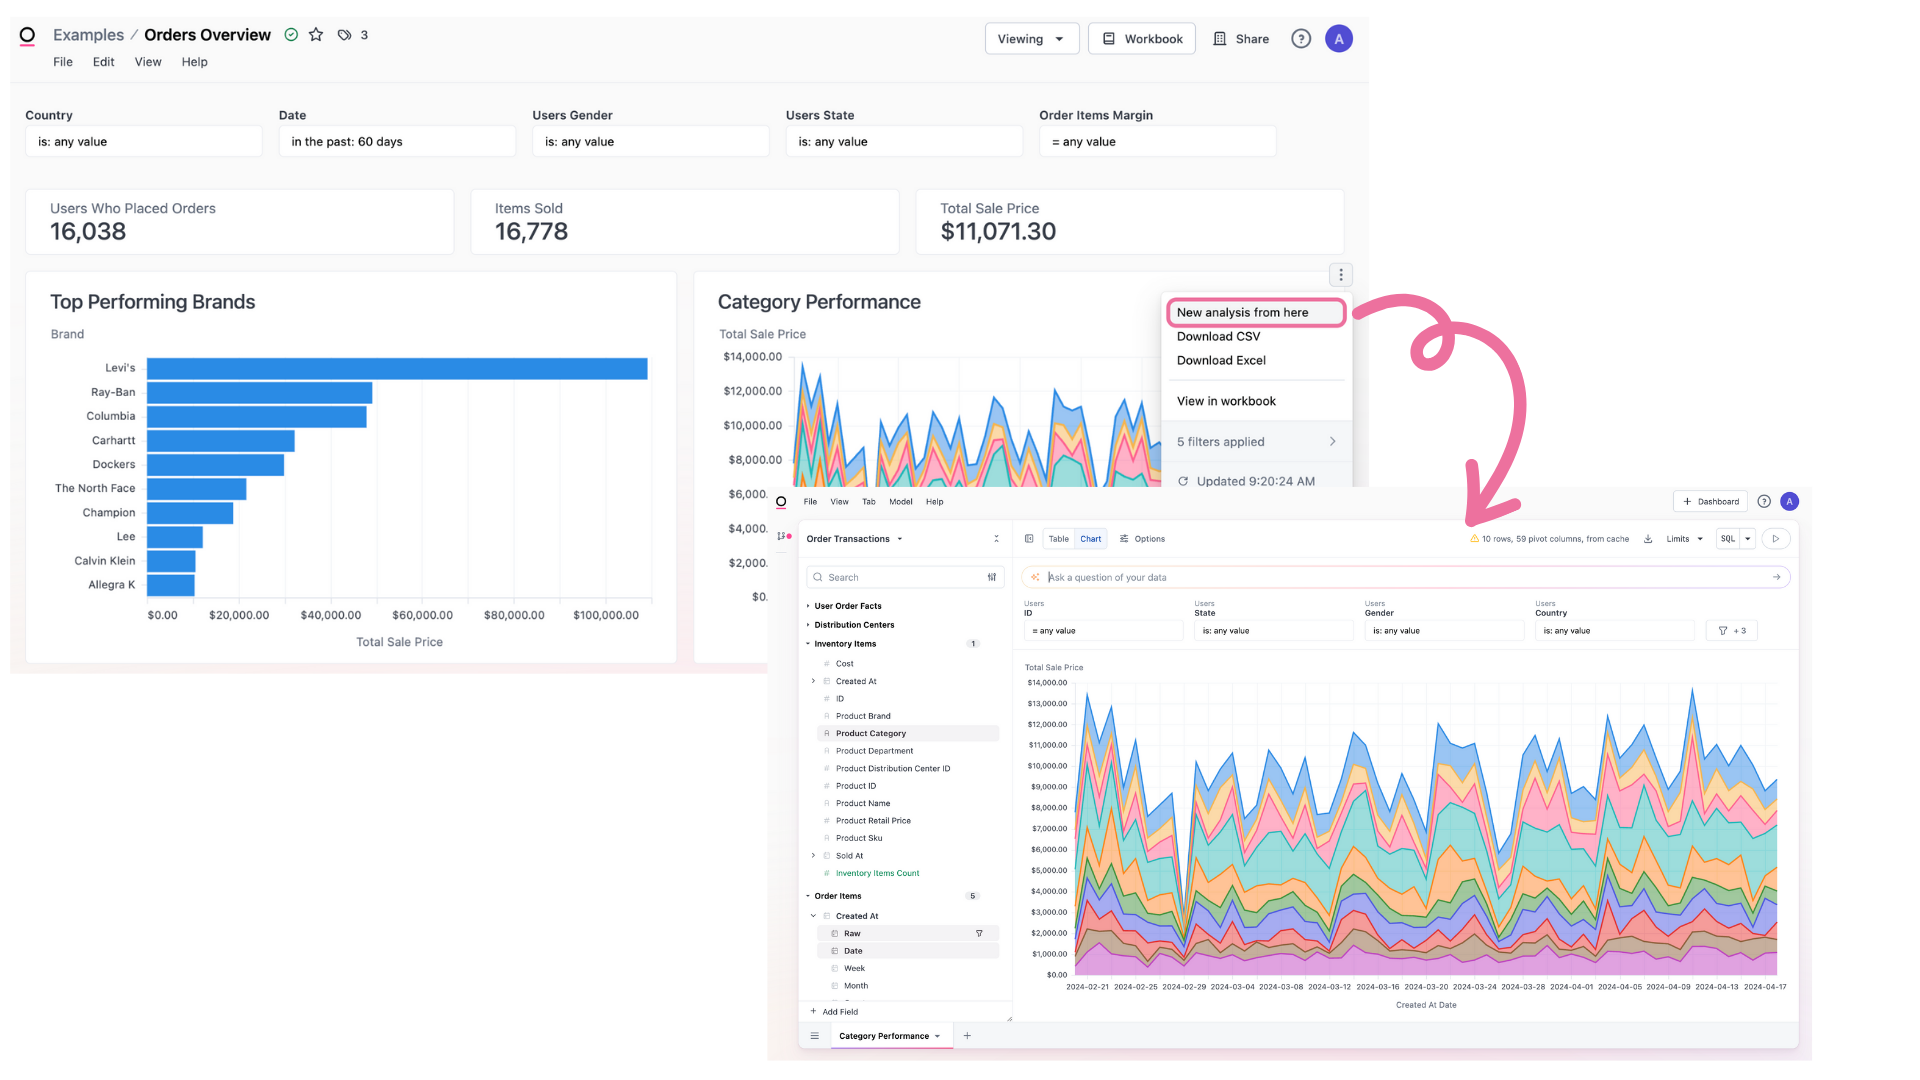
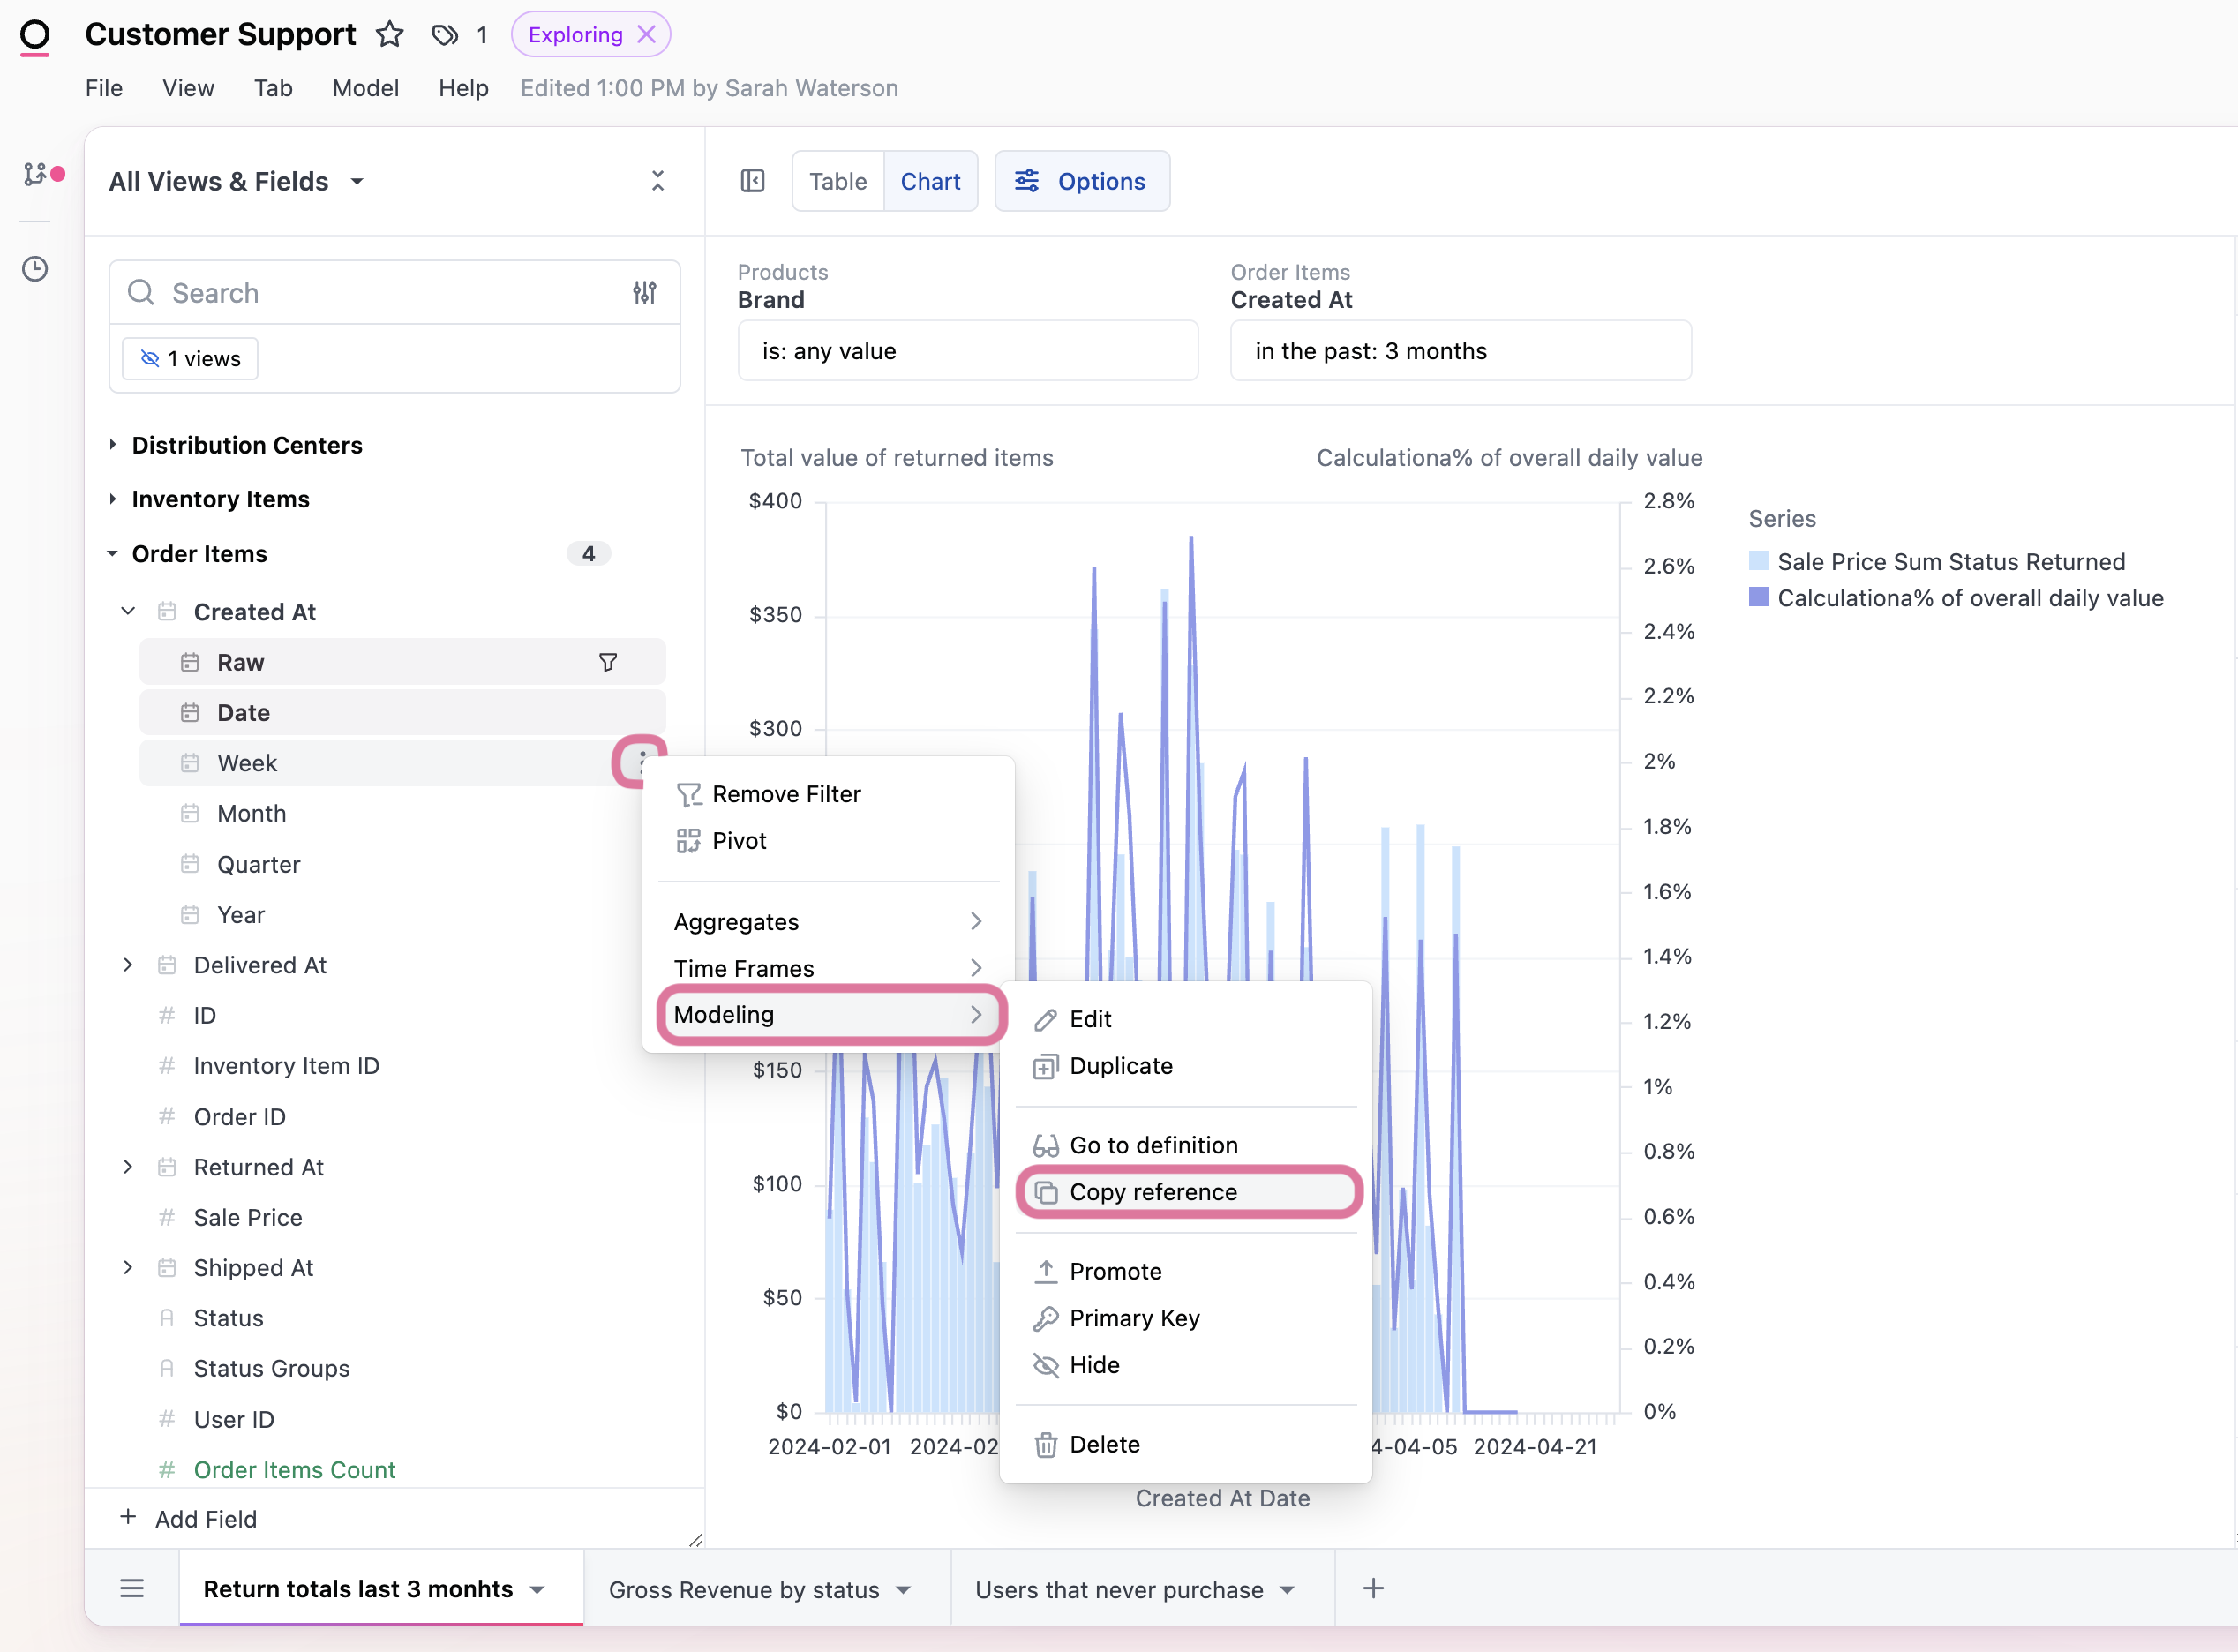
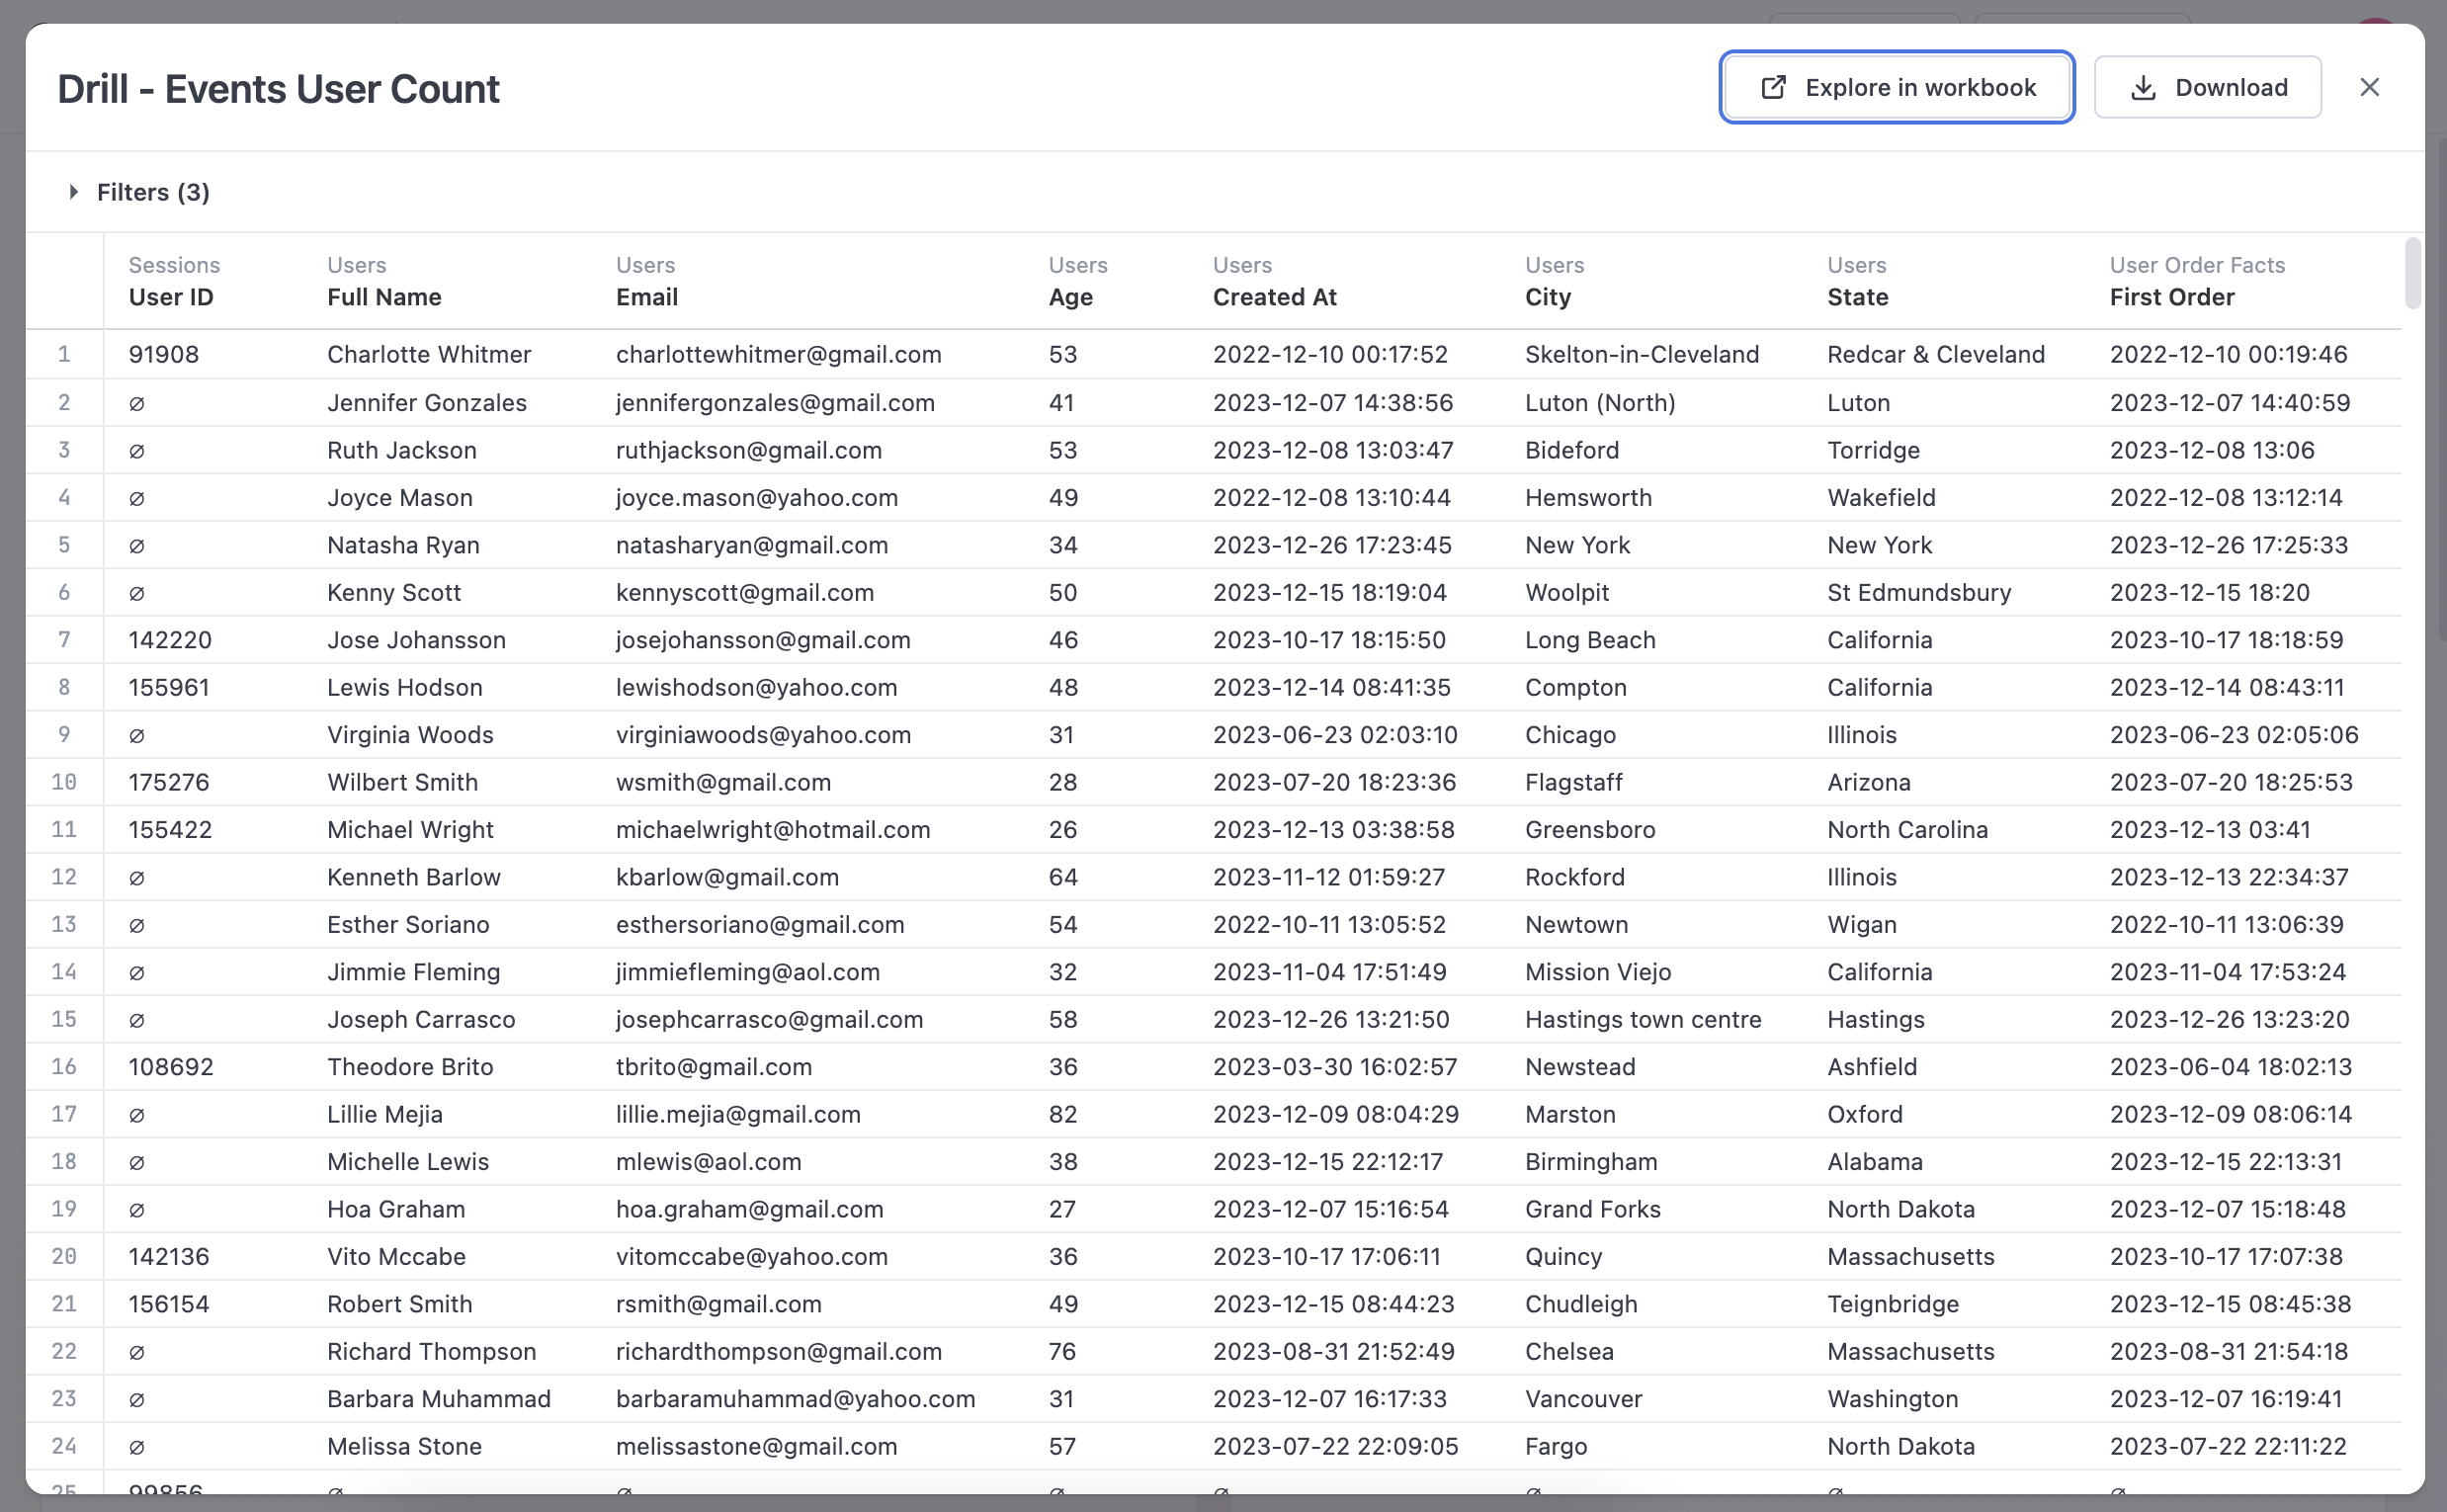
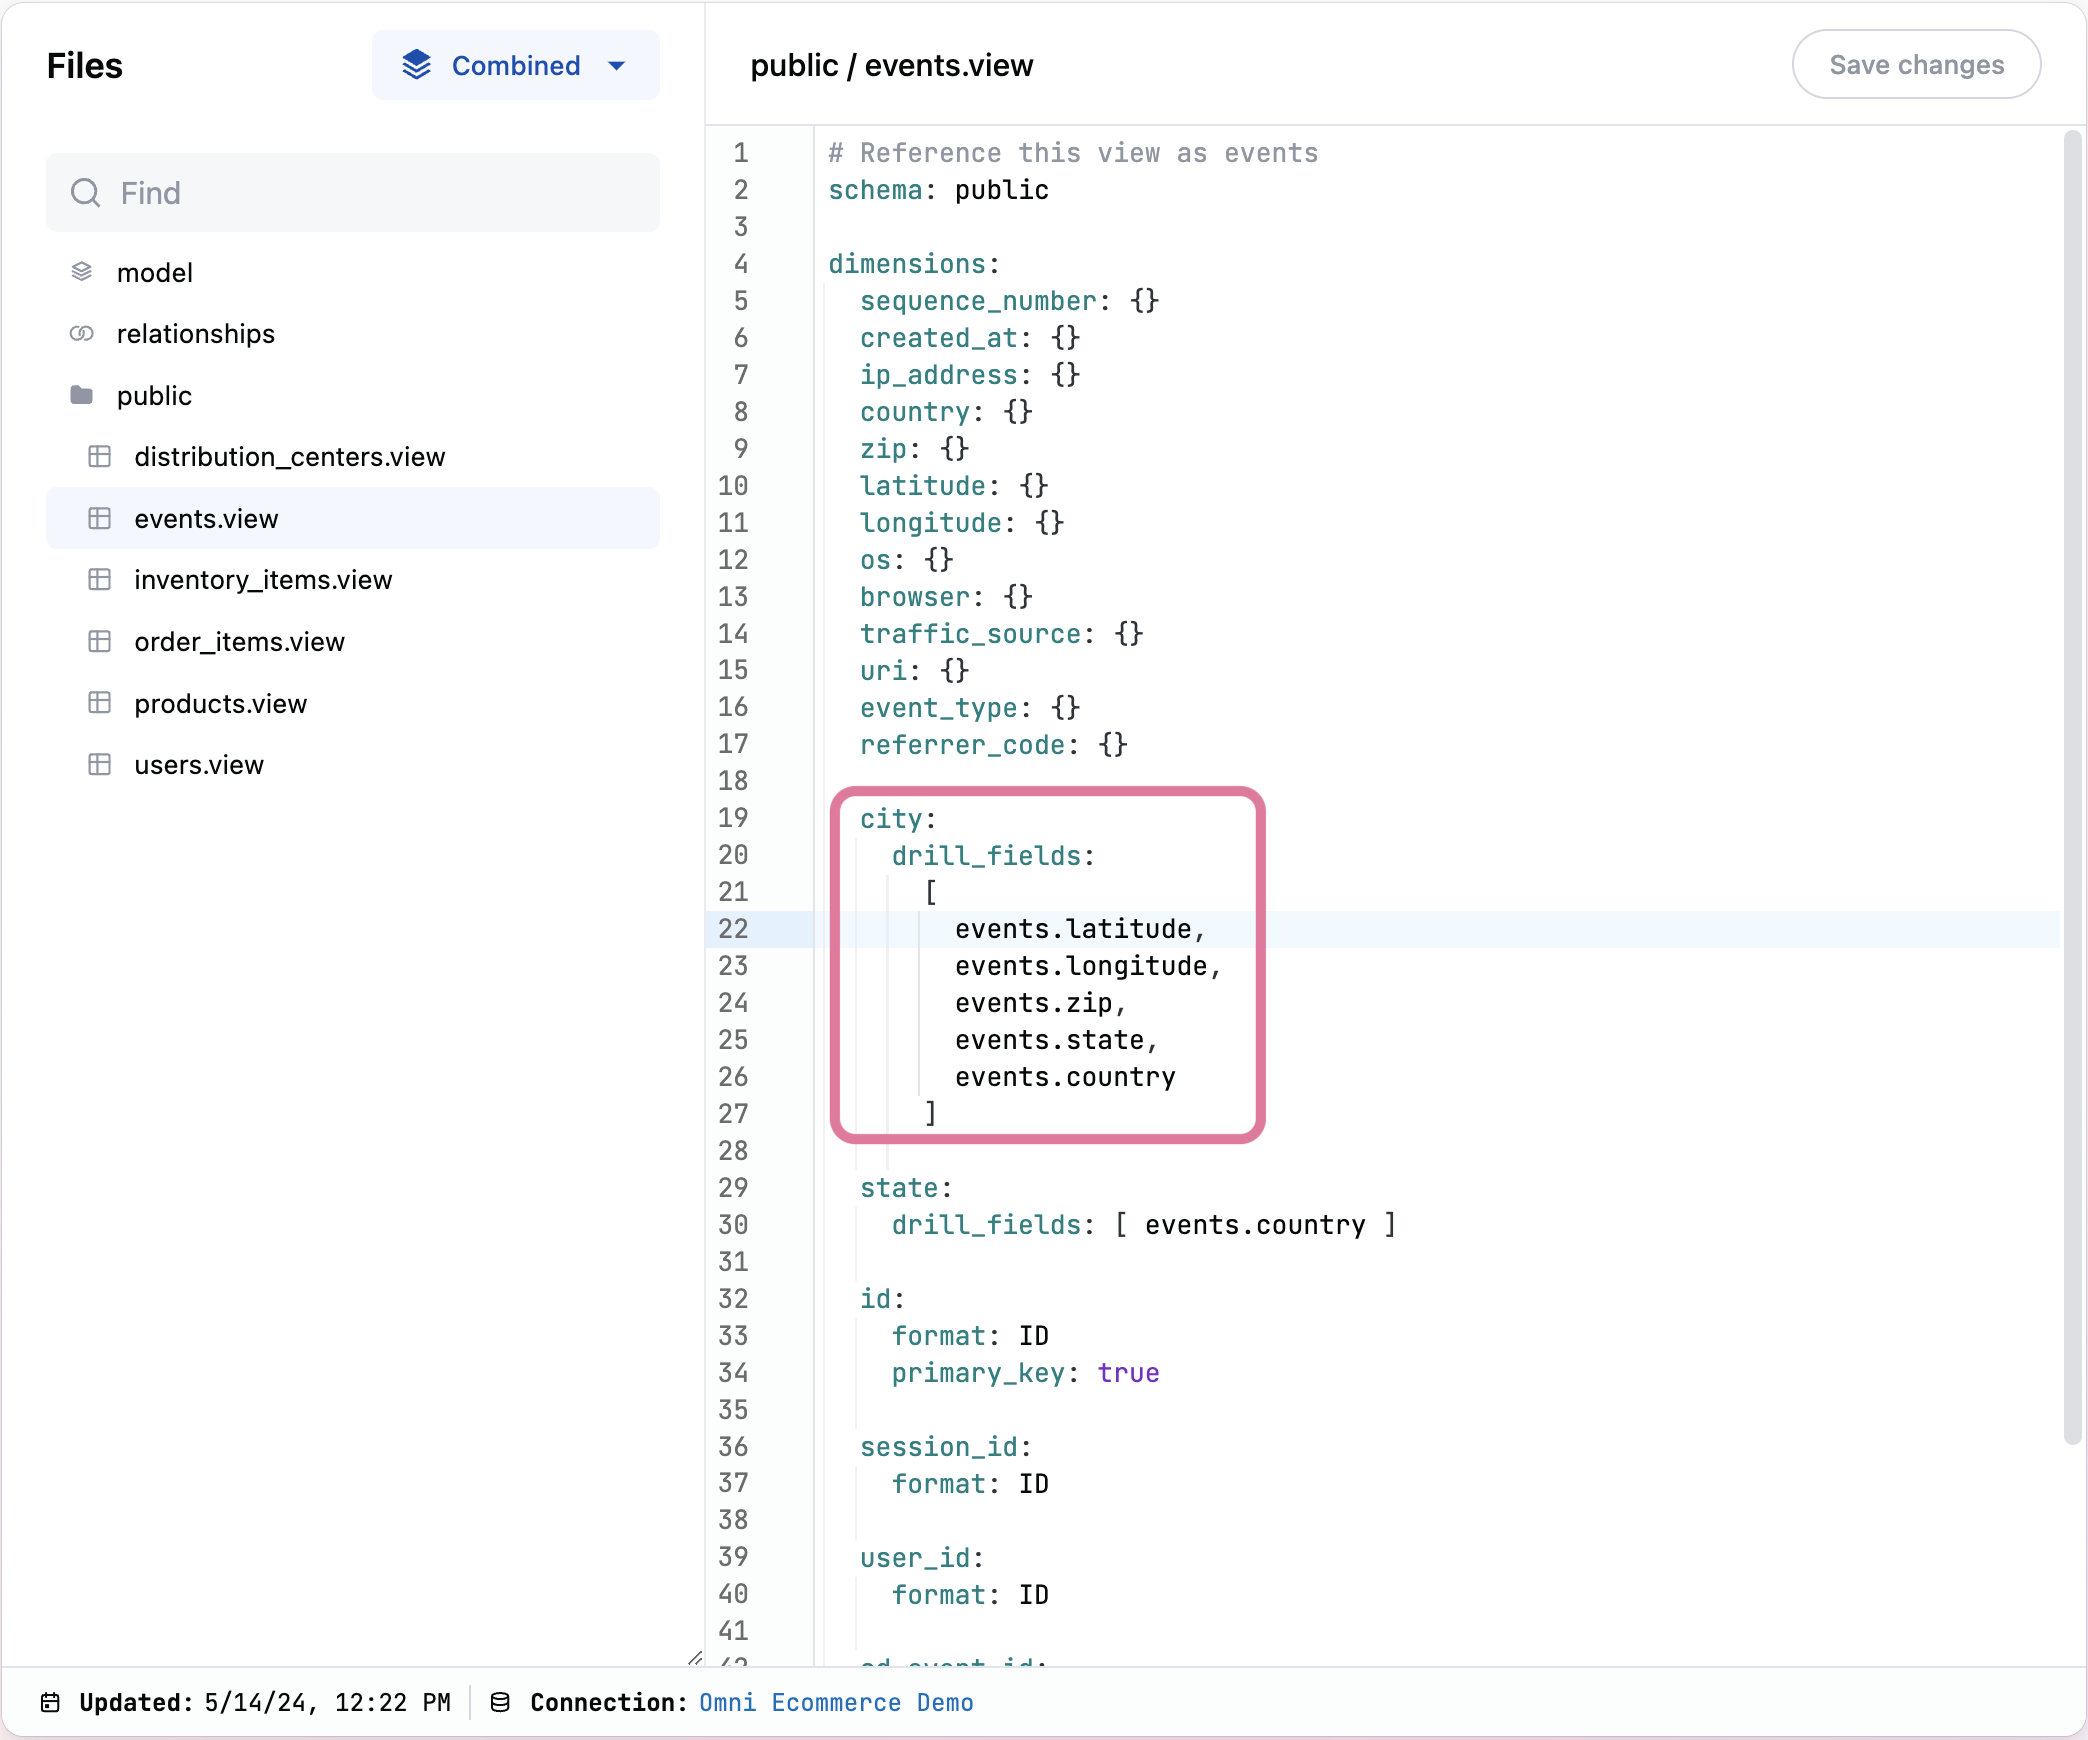
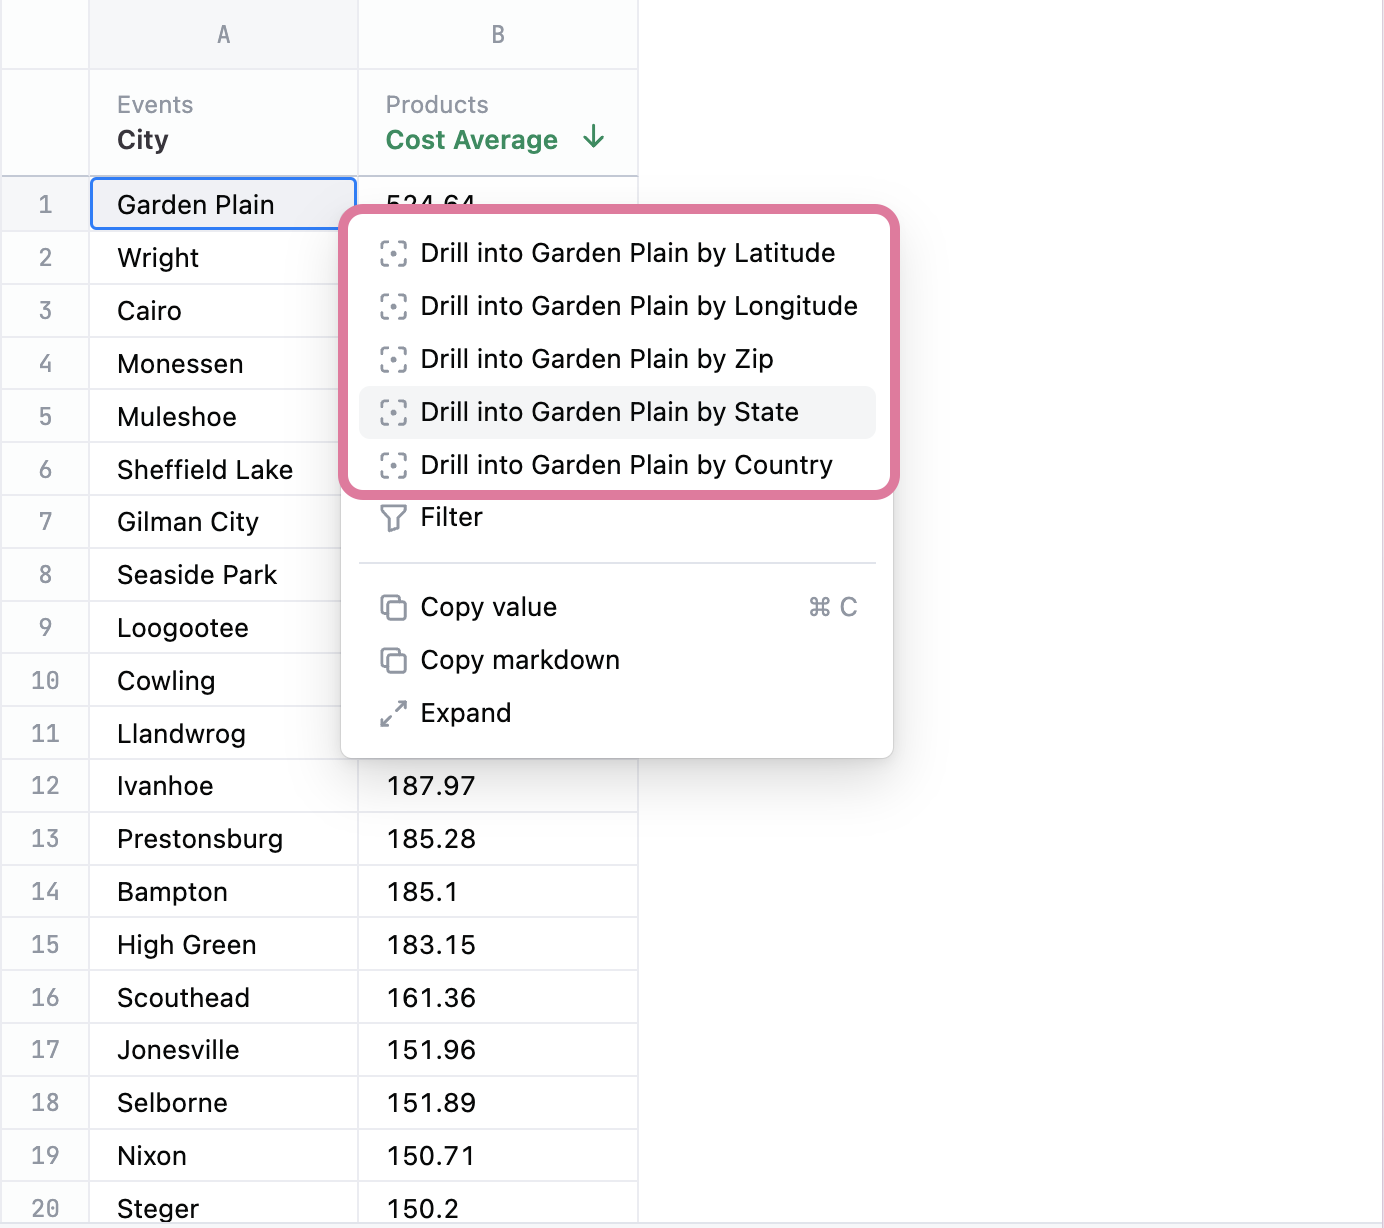
Dimensional drilling
Users can now drill into a particular value for fields that have defined drill fields to dig deeper while they are querying their data ⚒️
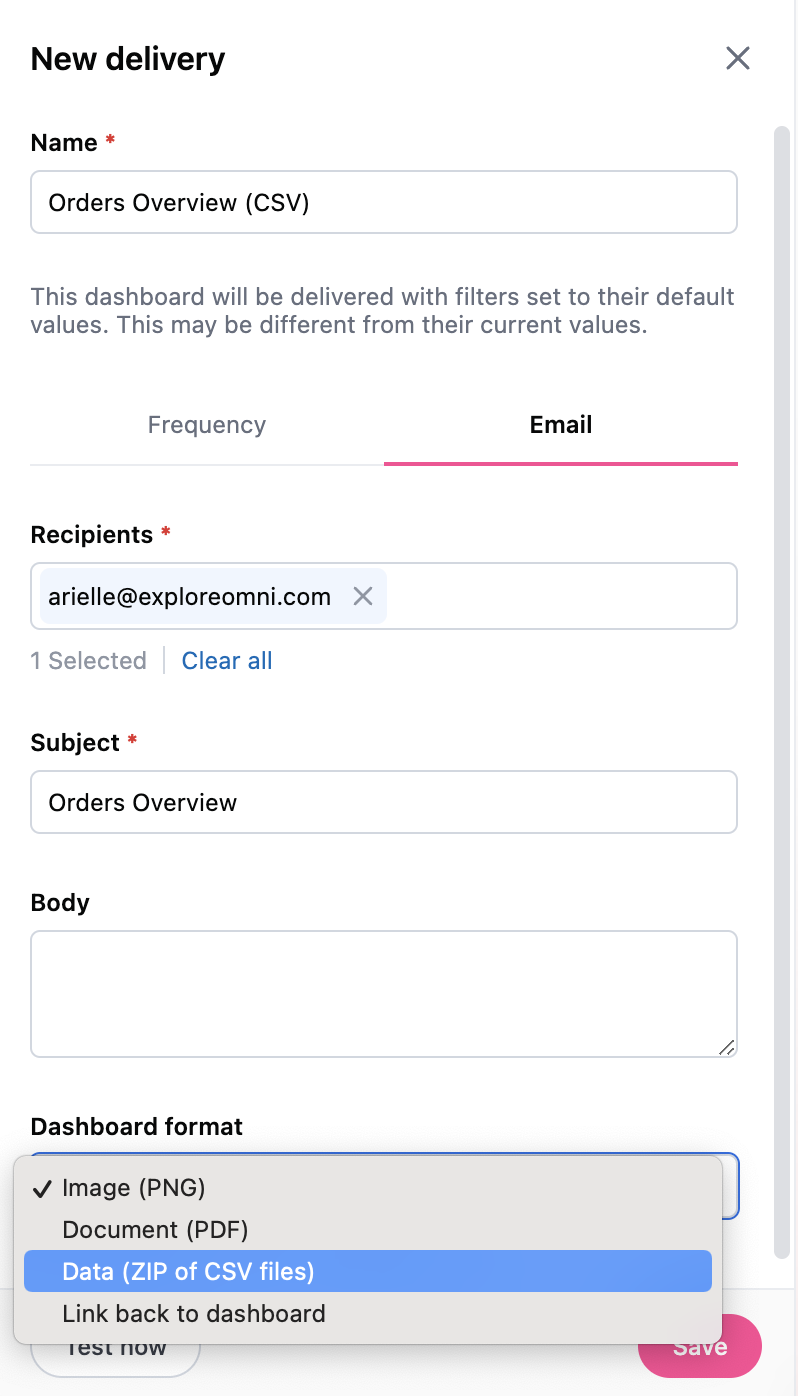
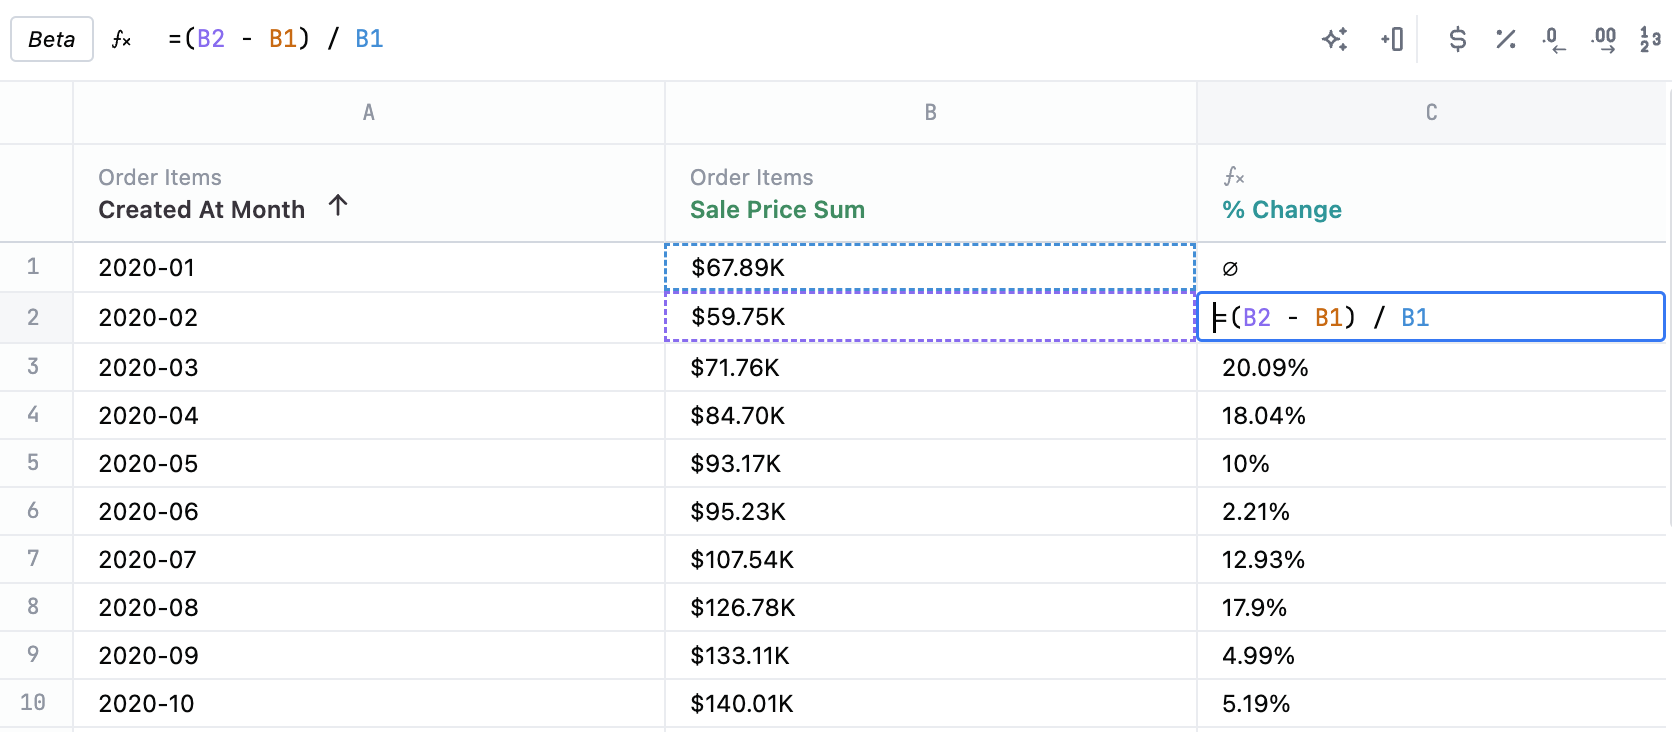
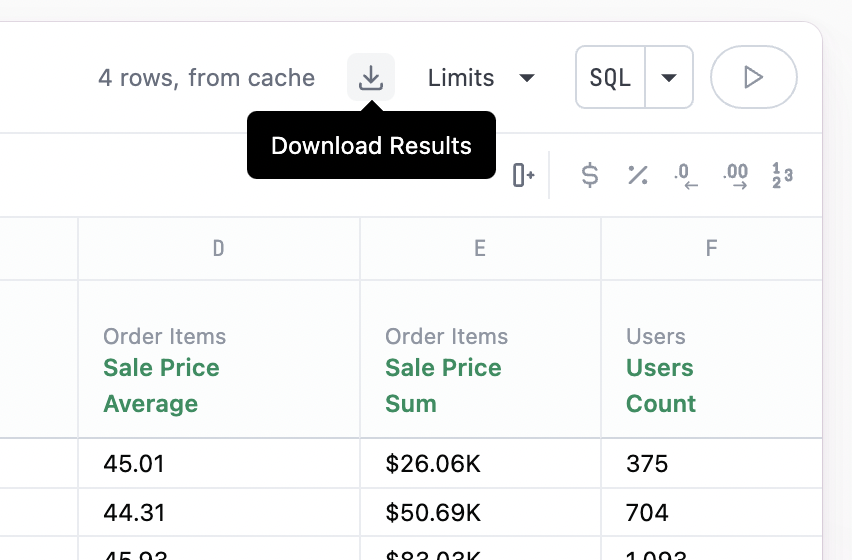
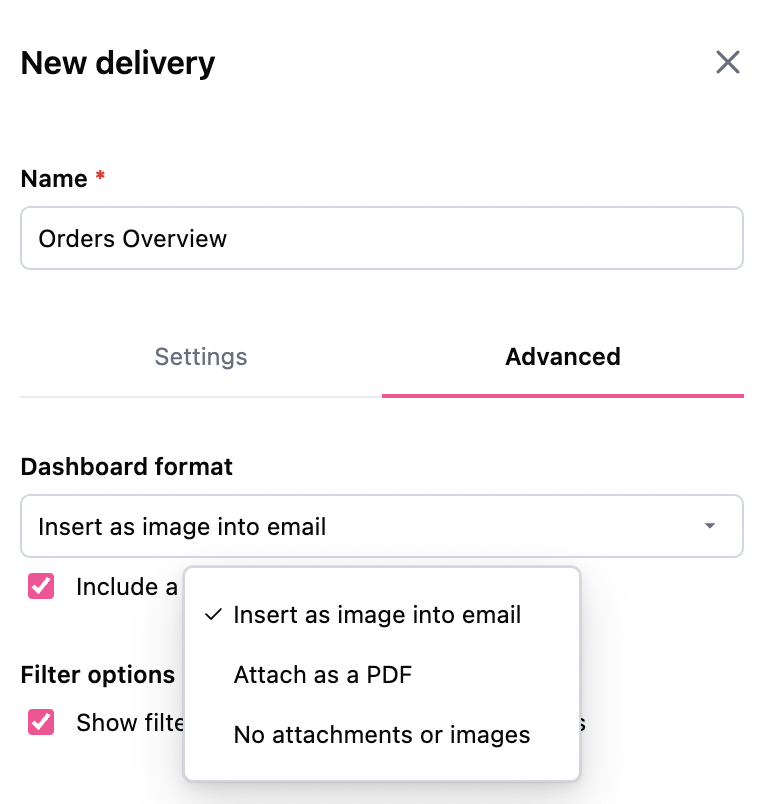
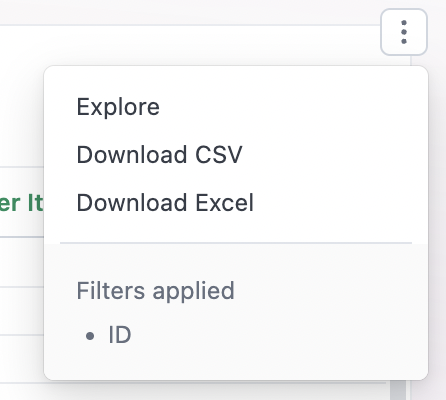
Excel downloads keep formulas�
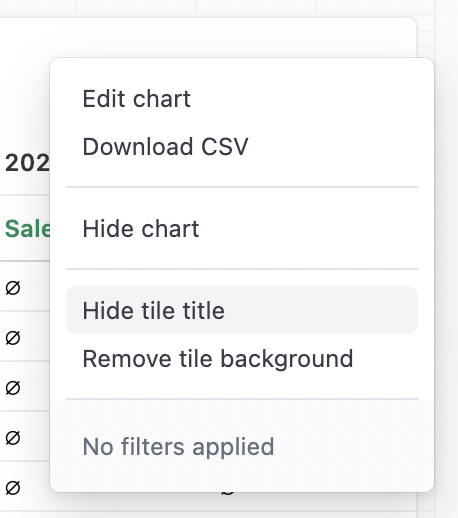
Now when you download your content in .xlsx format, the formulas are saved in the download. Making it even easier to keep working in other excel tools! 🎉
Other awesome updates:
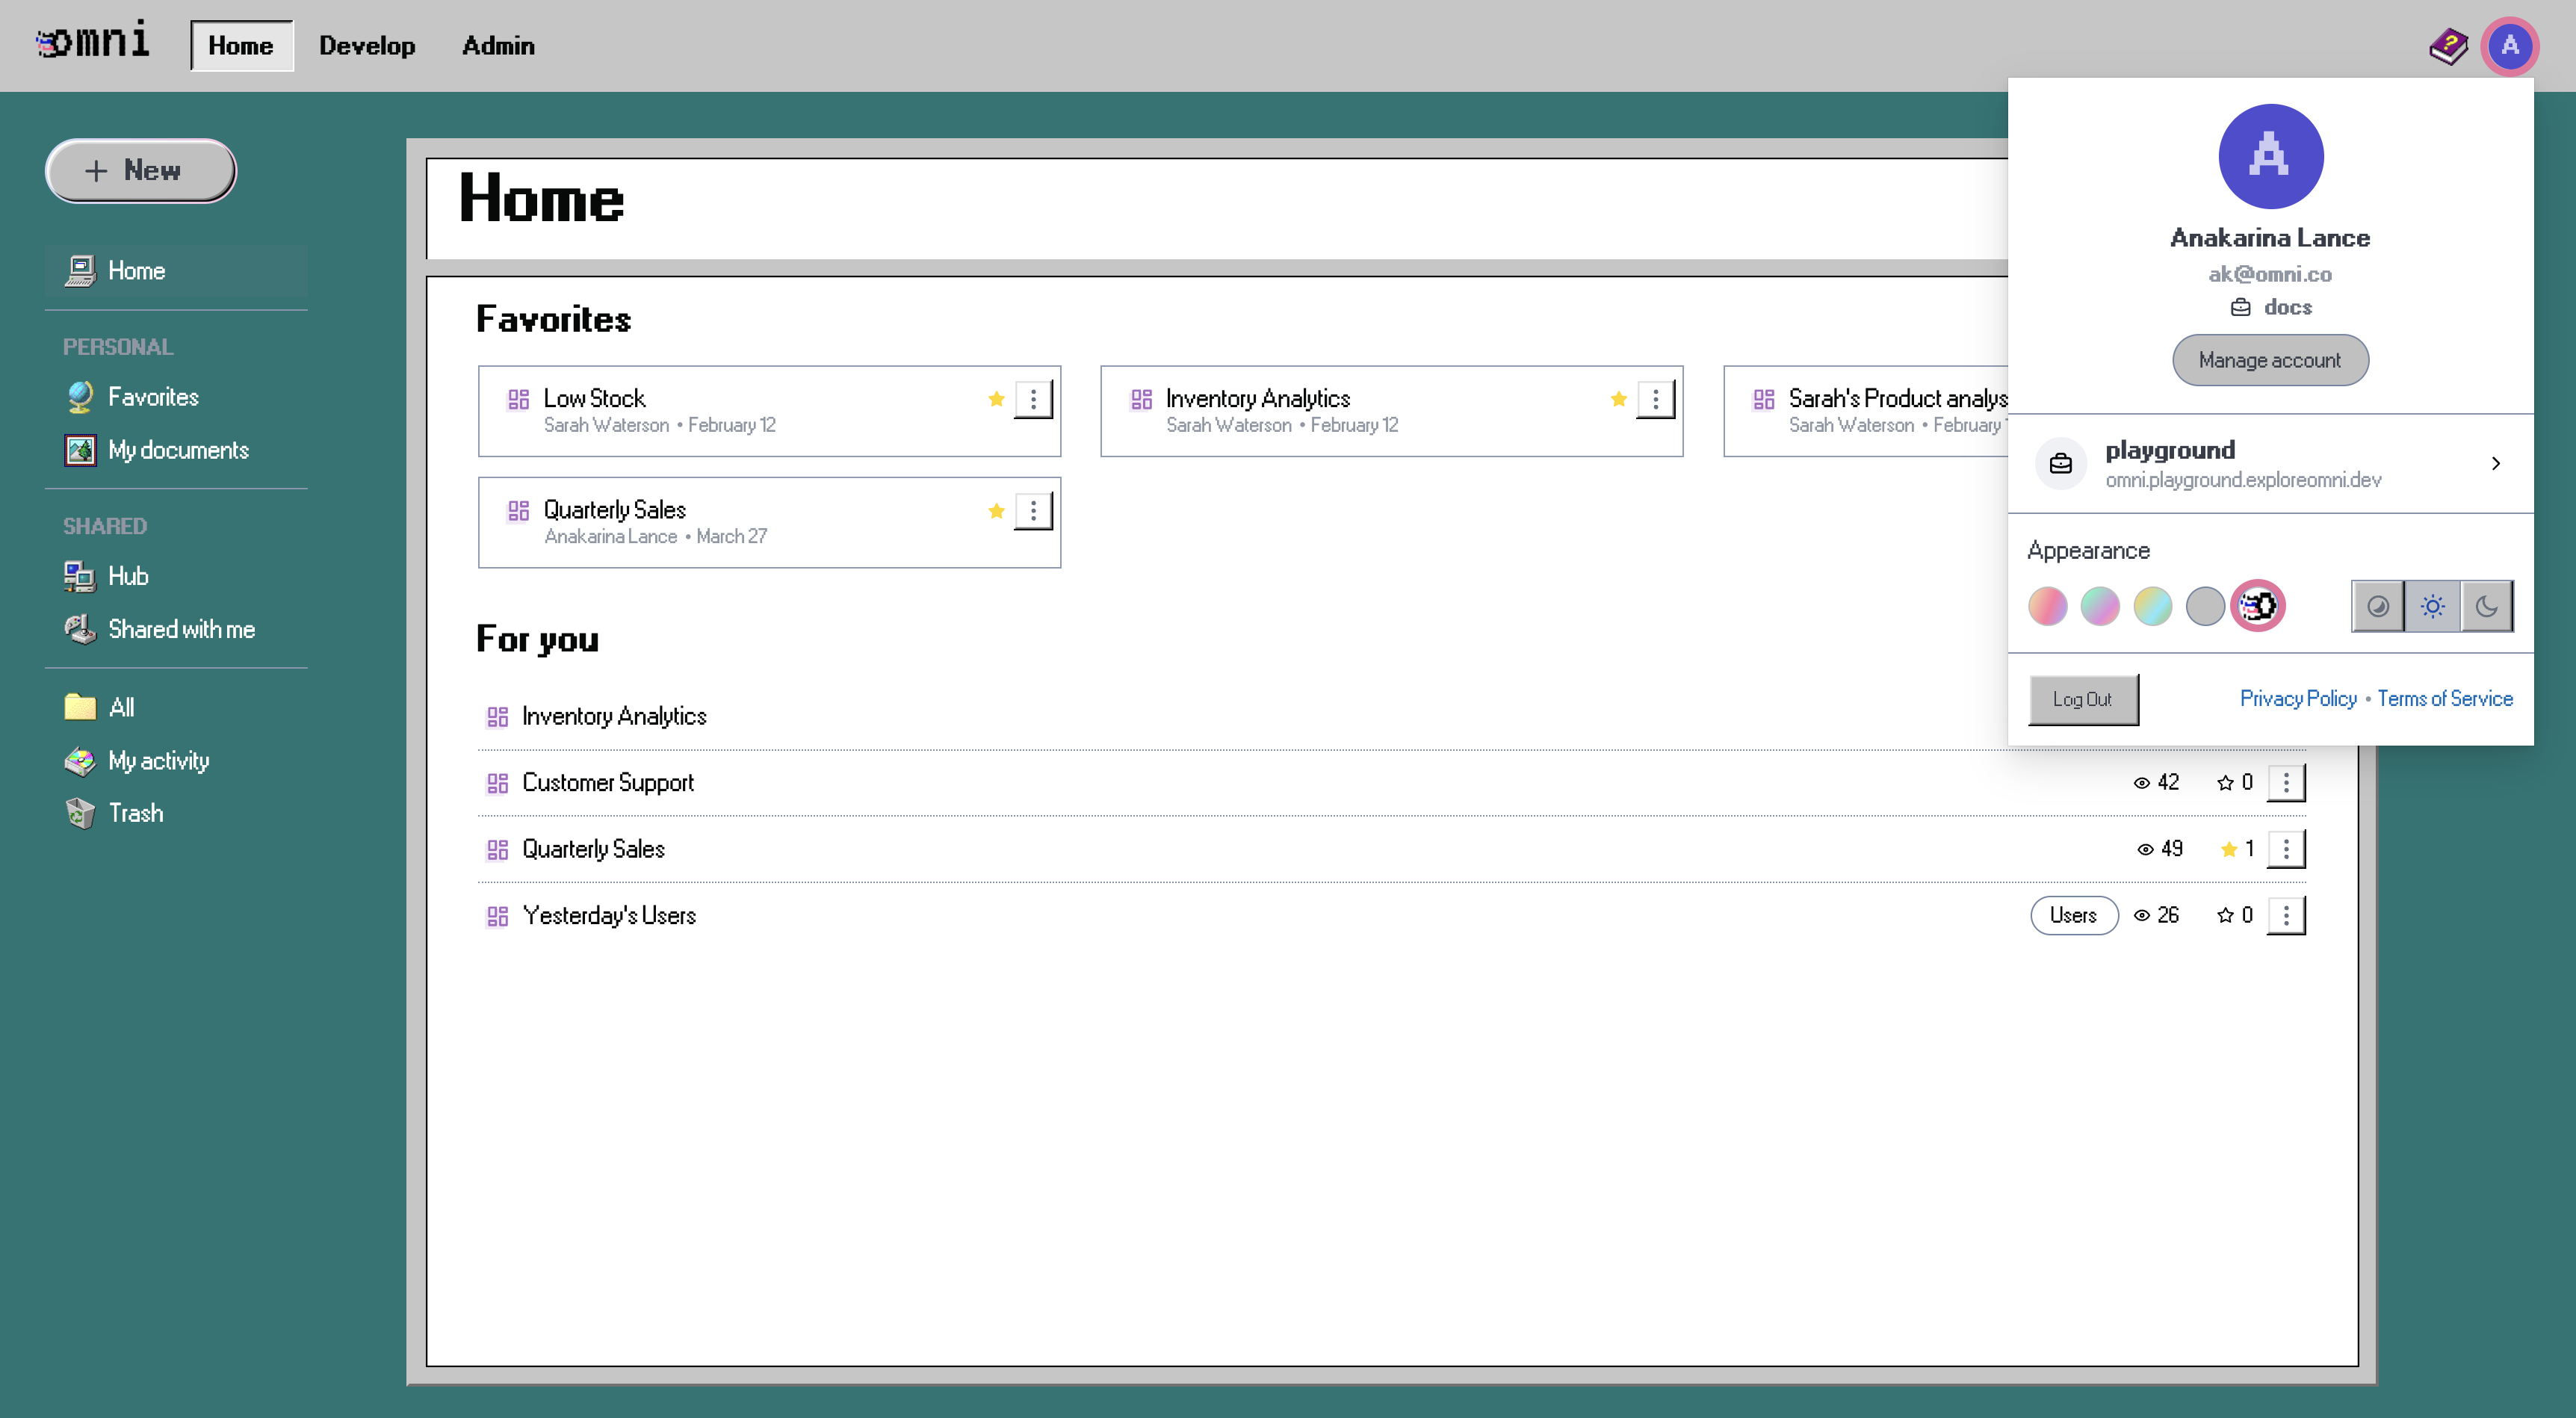
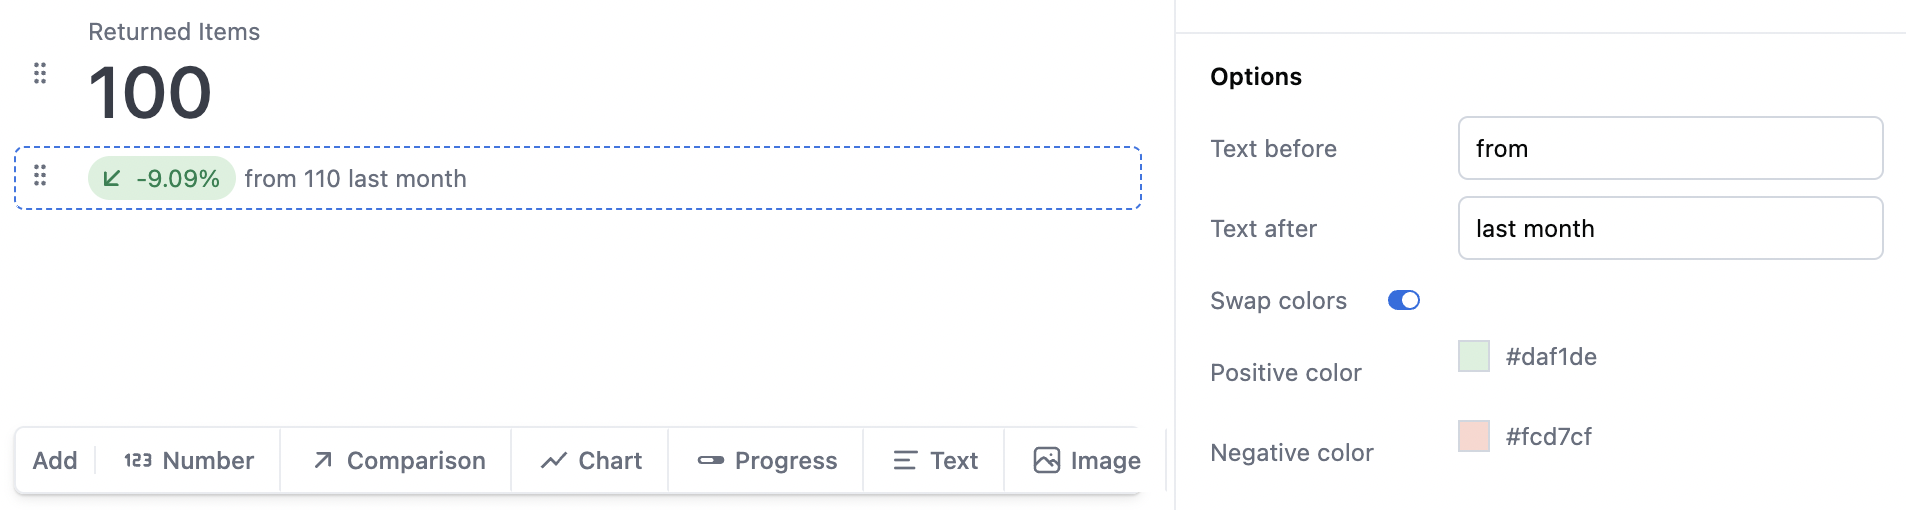
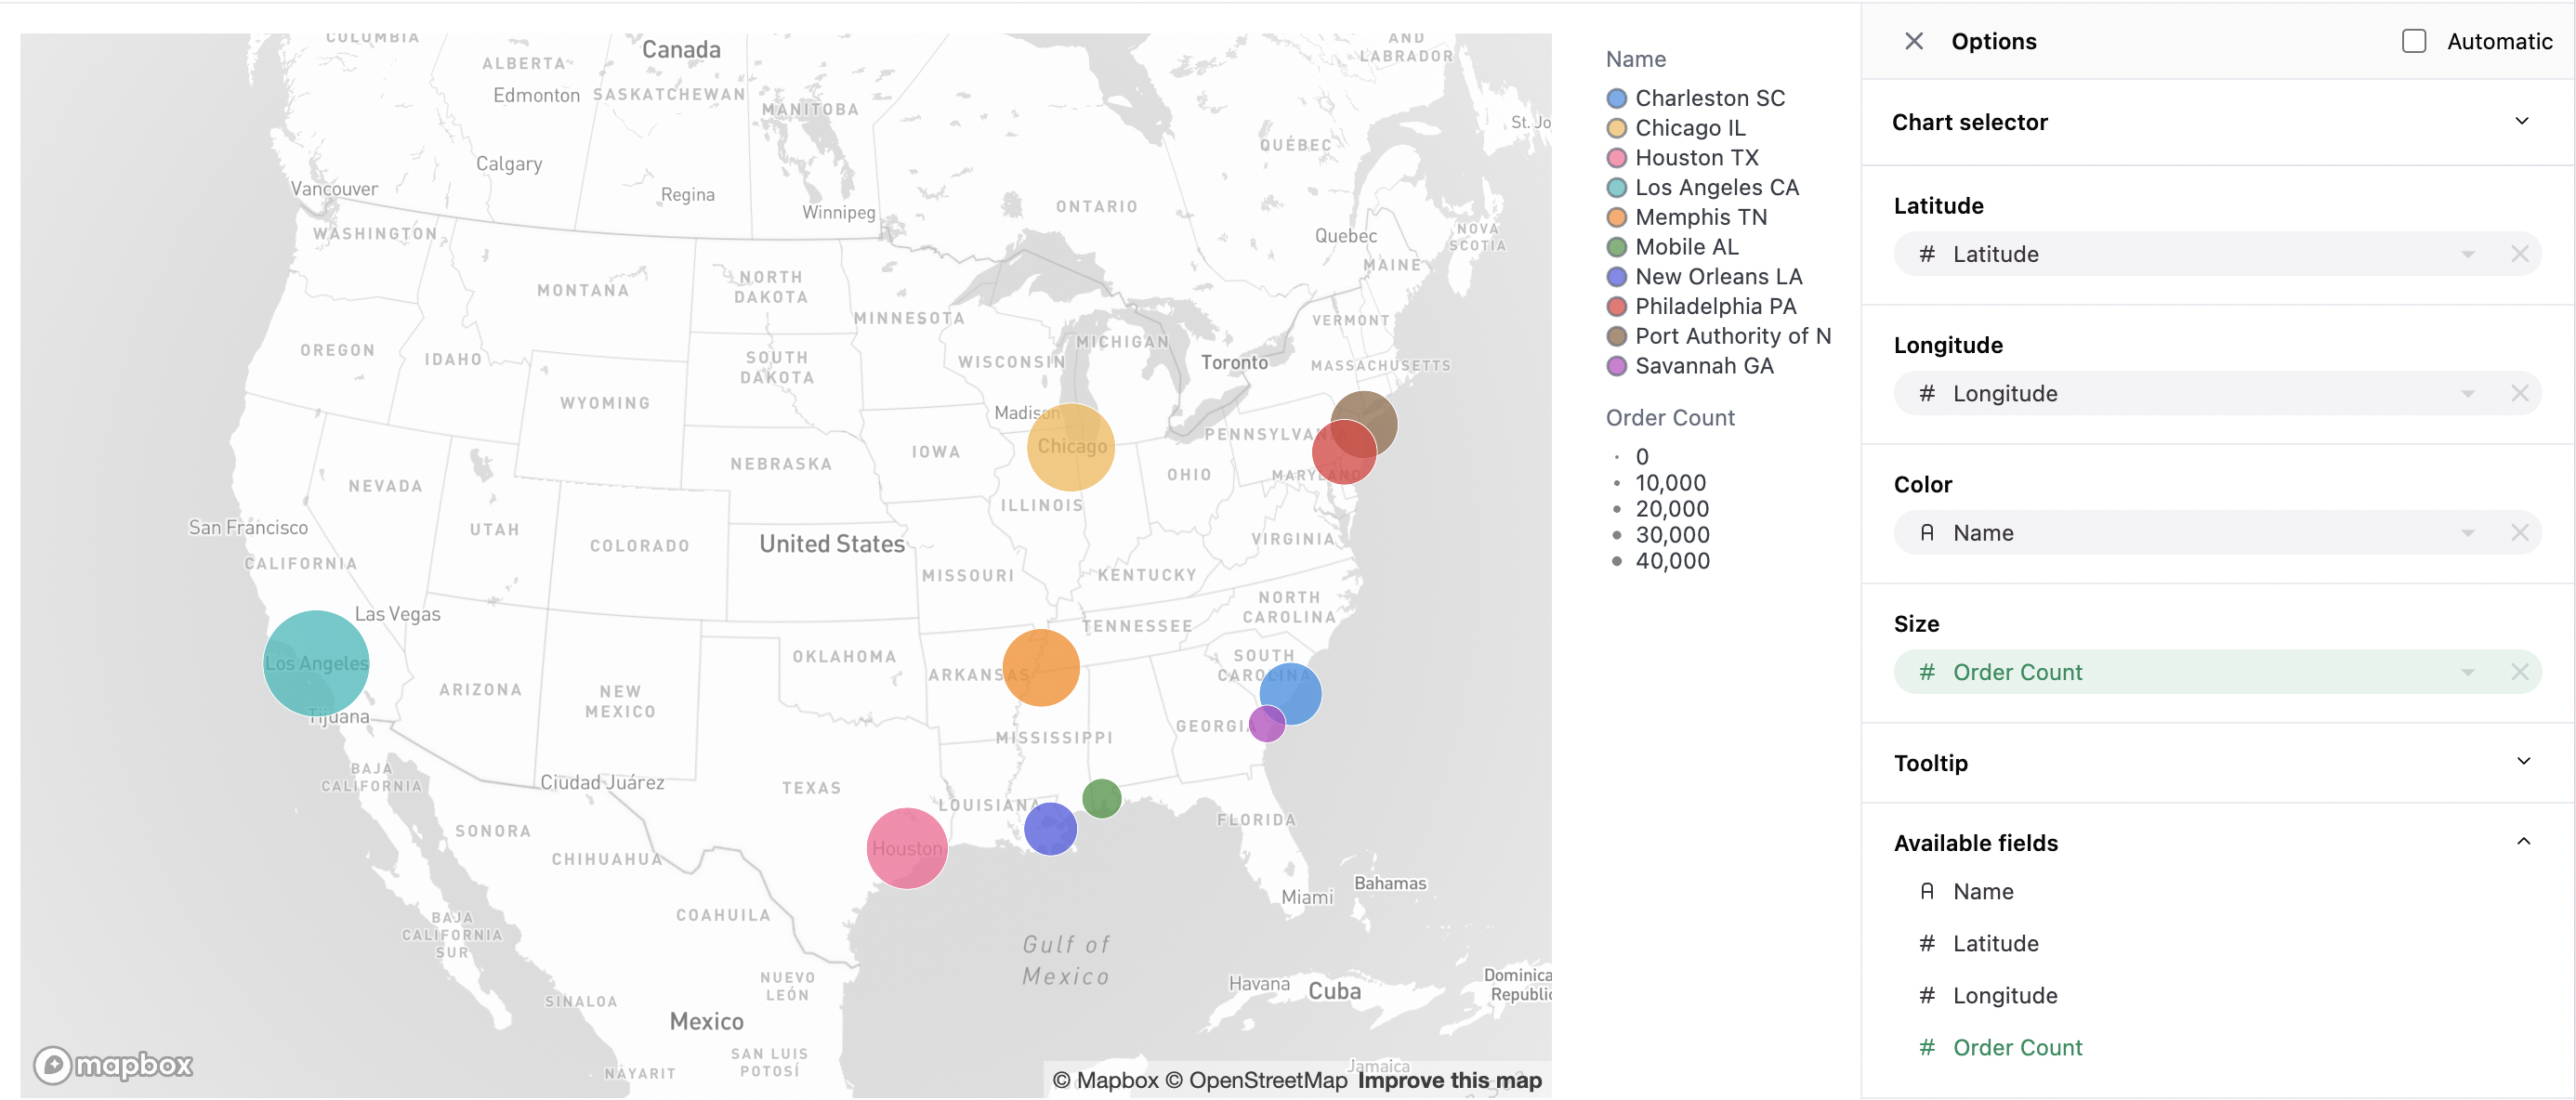
- More color customization options as well as zebra-striped tables 🦓
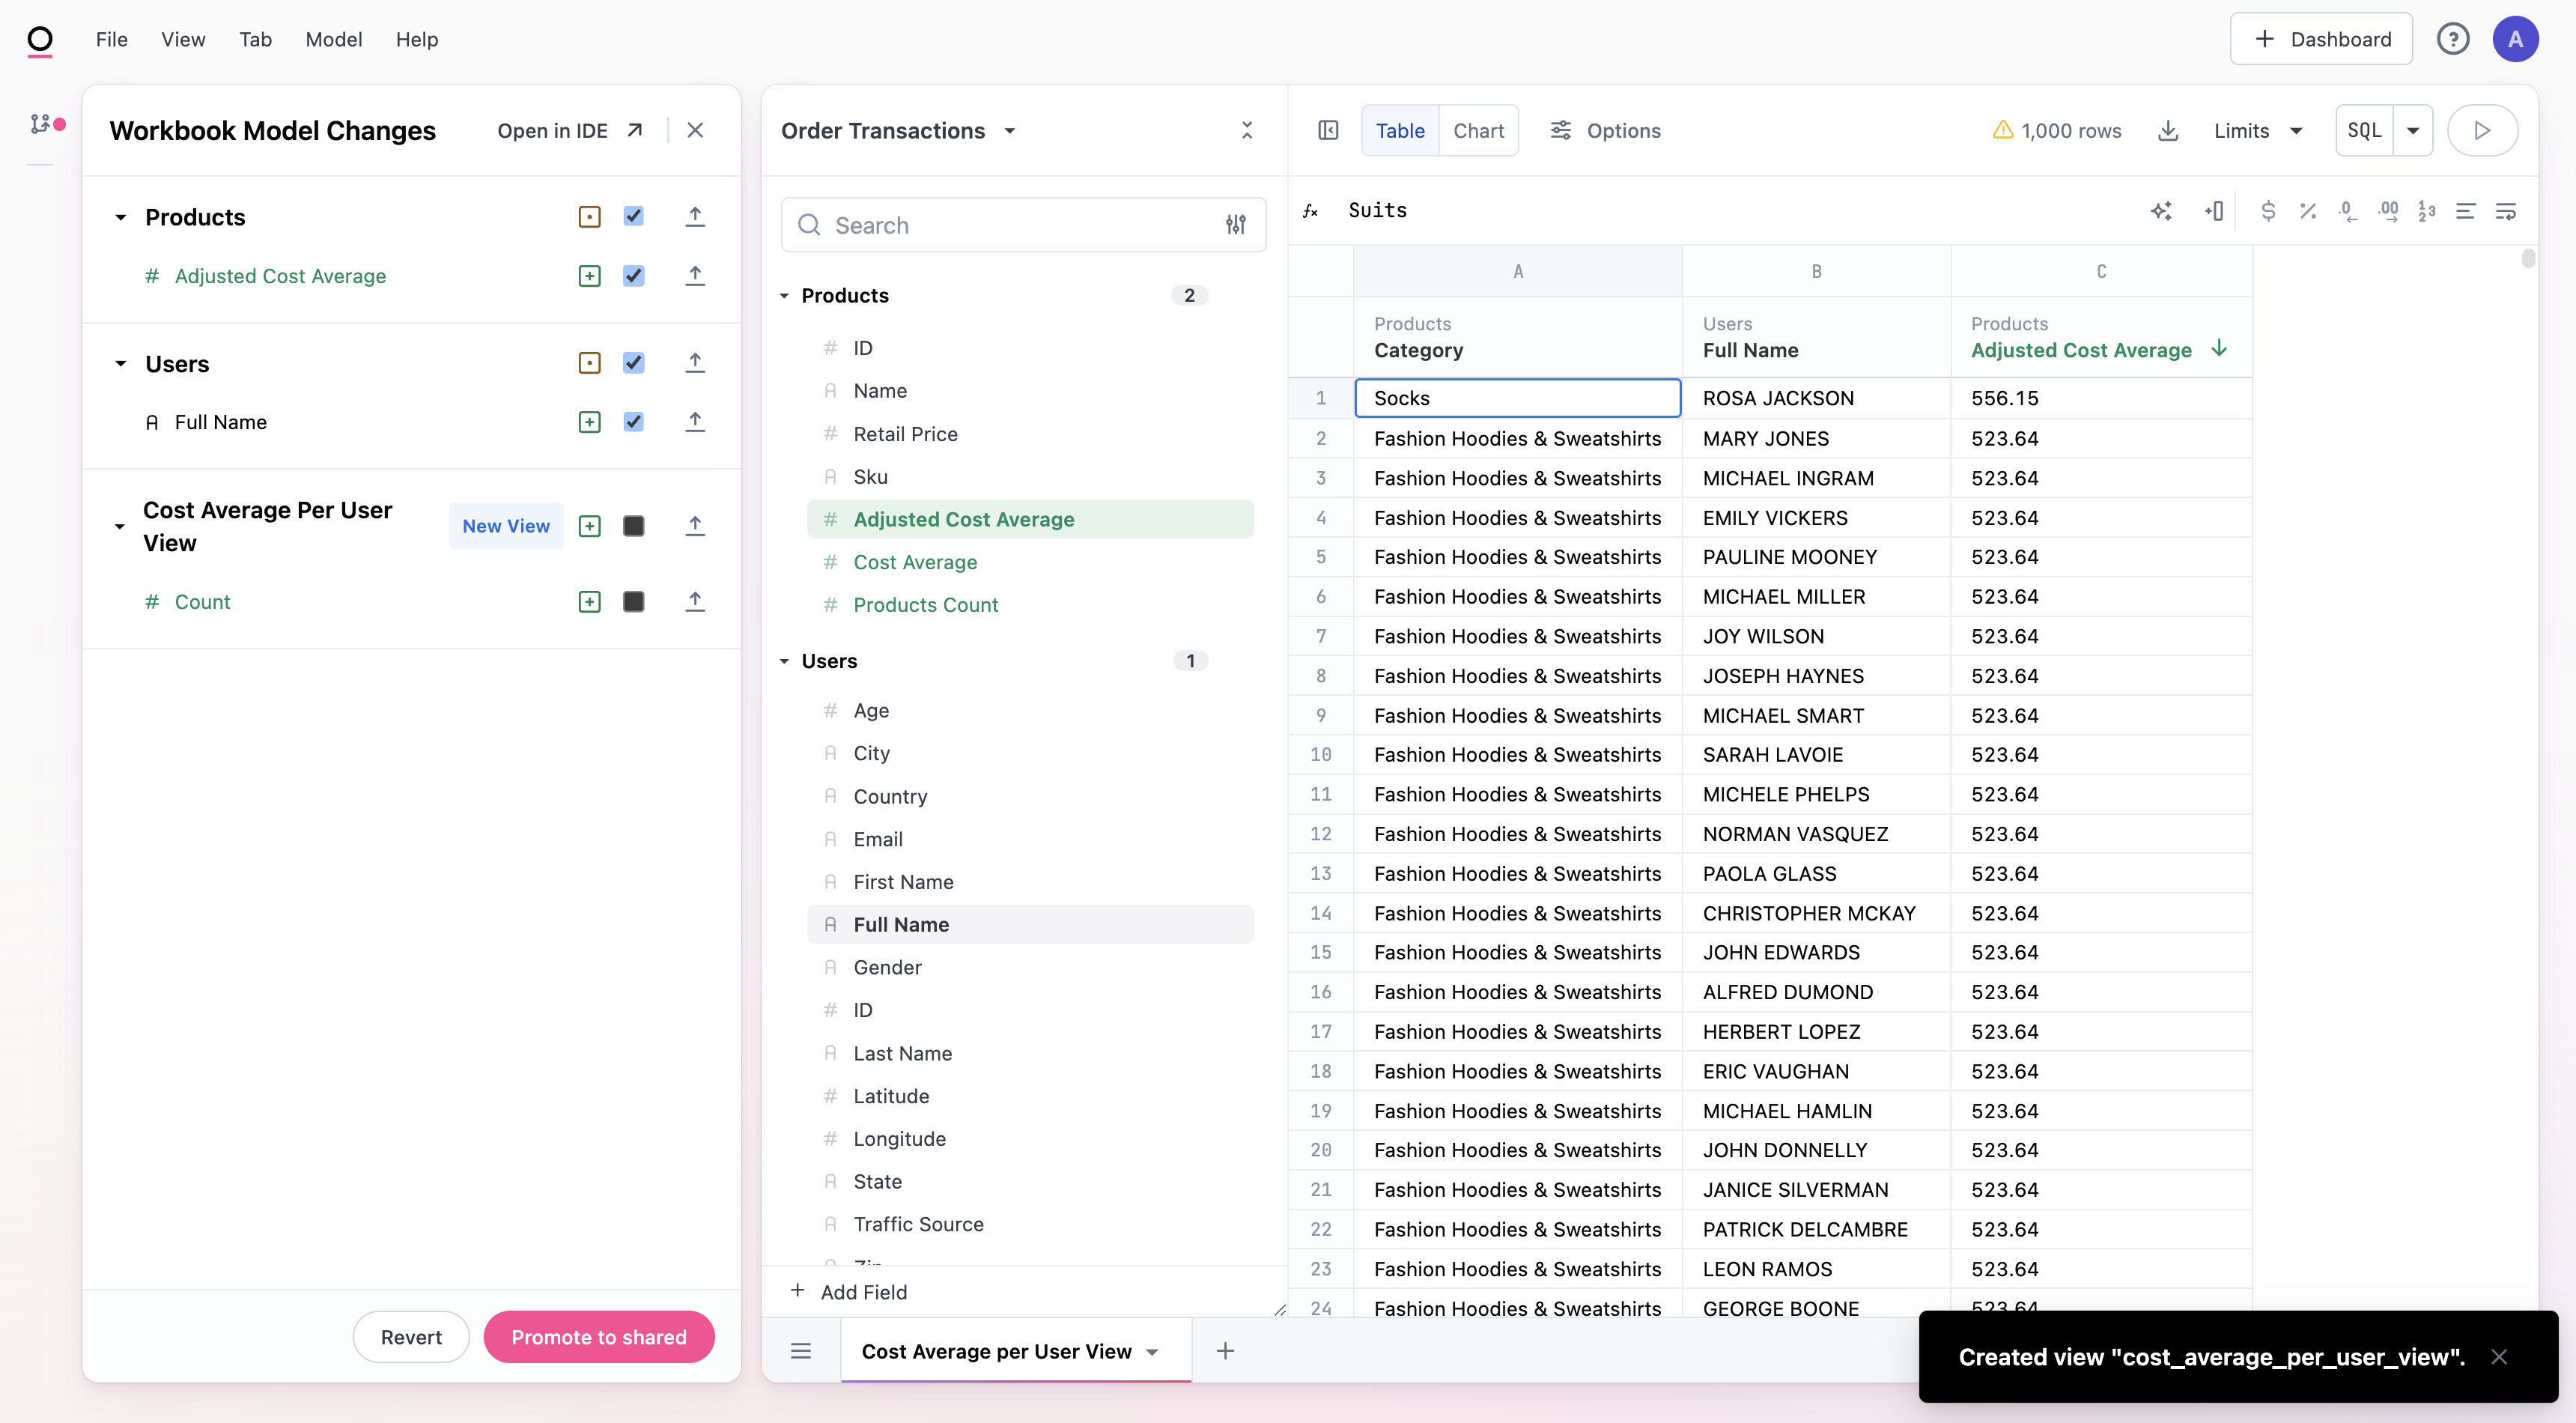
- New column header description tooltips giving users more context on the fields in a query.
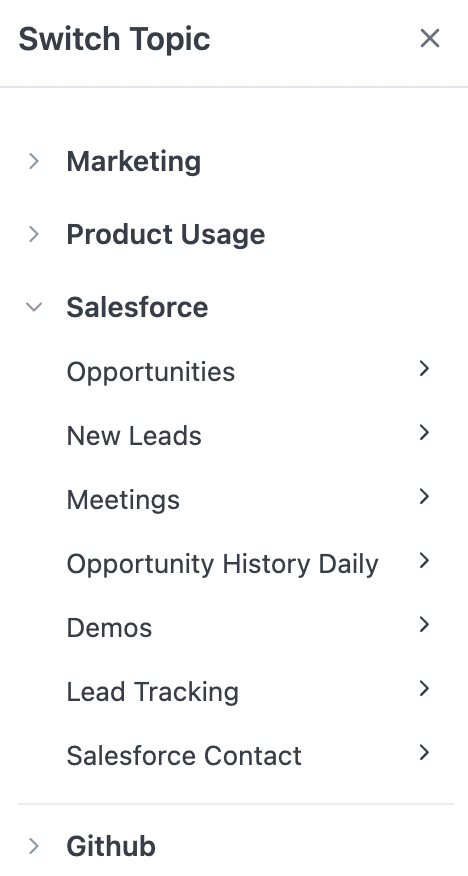
- Field selector: Allows users to change queries to dynamically swap between fields allowing users to further curate the querying experience in a workbook. Note: this is currently available in workbooks; support from dashboards coming soon!
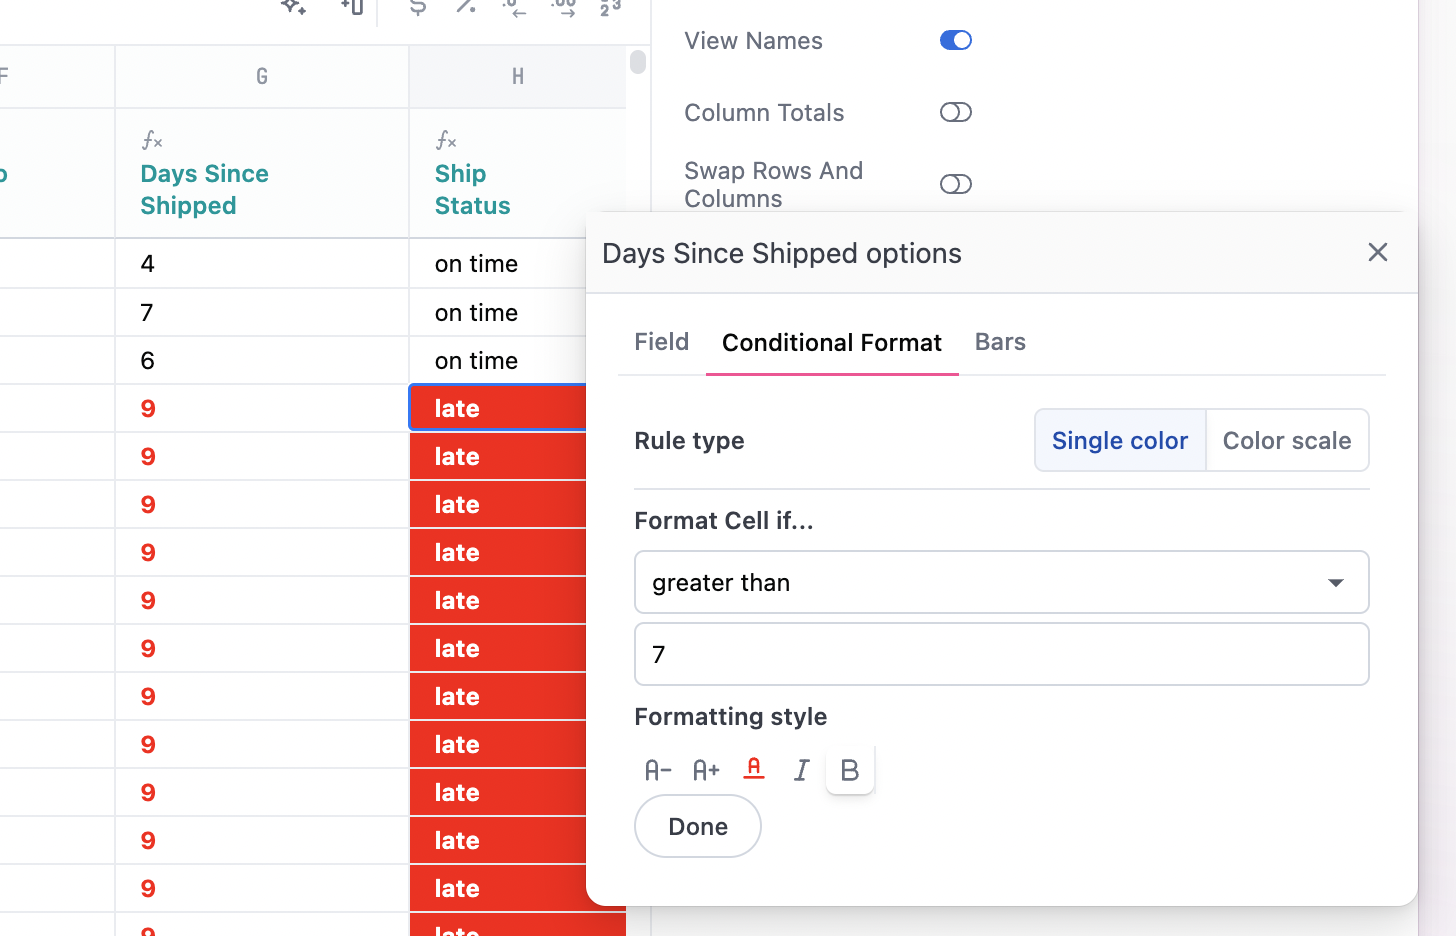
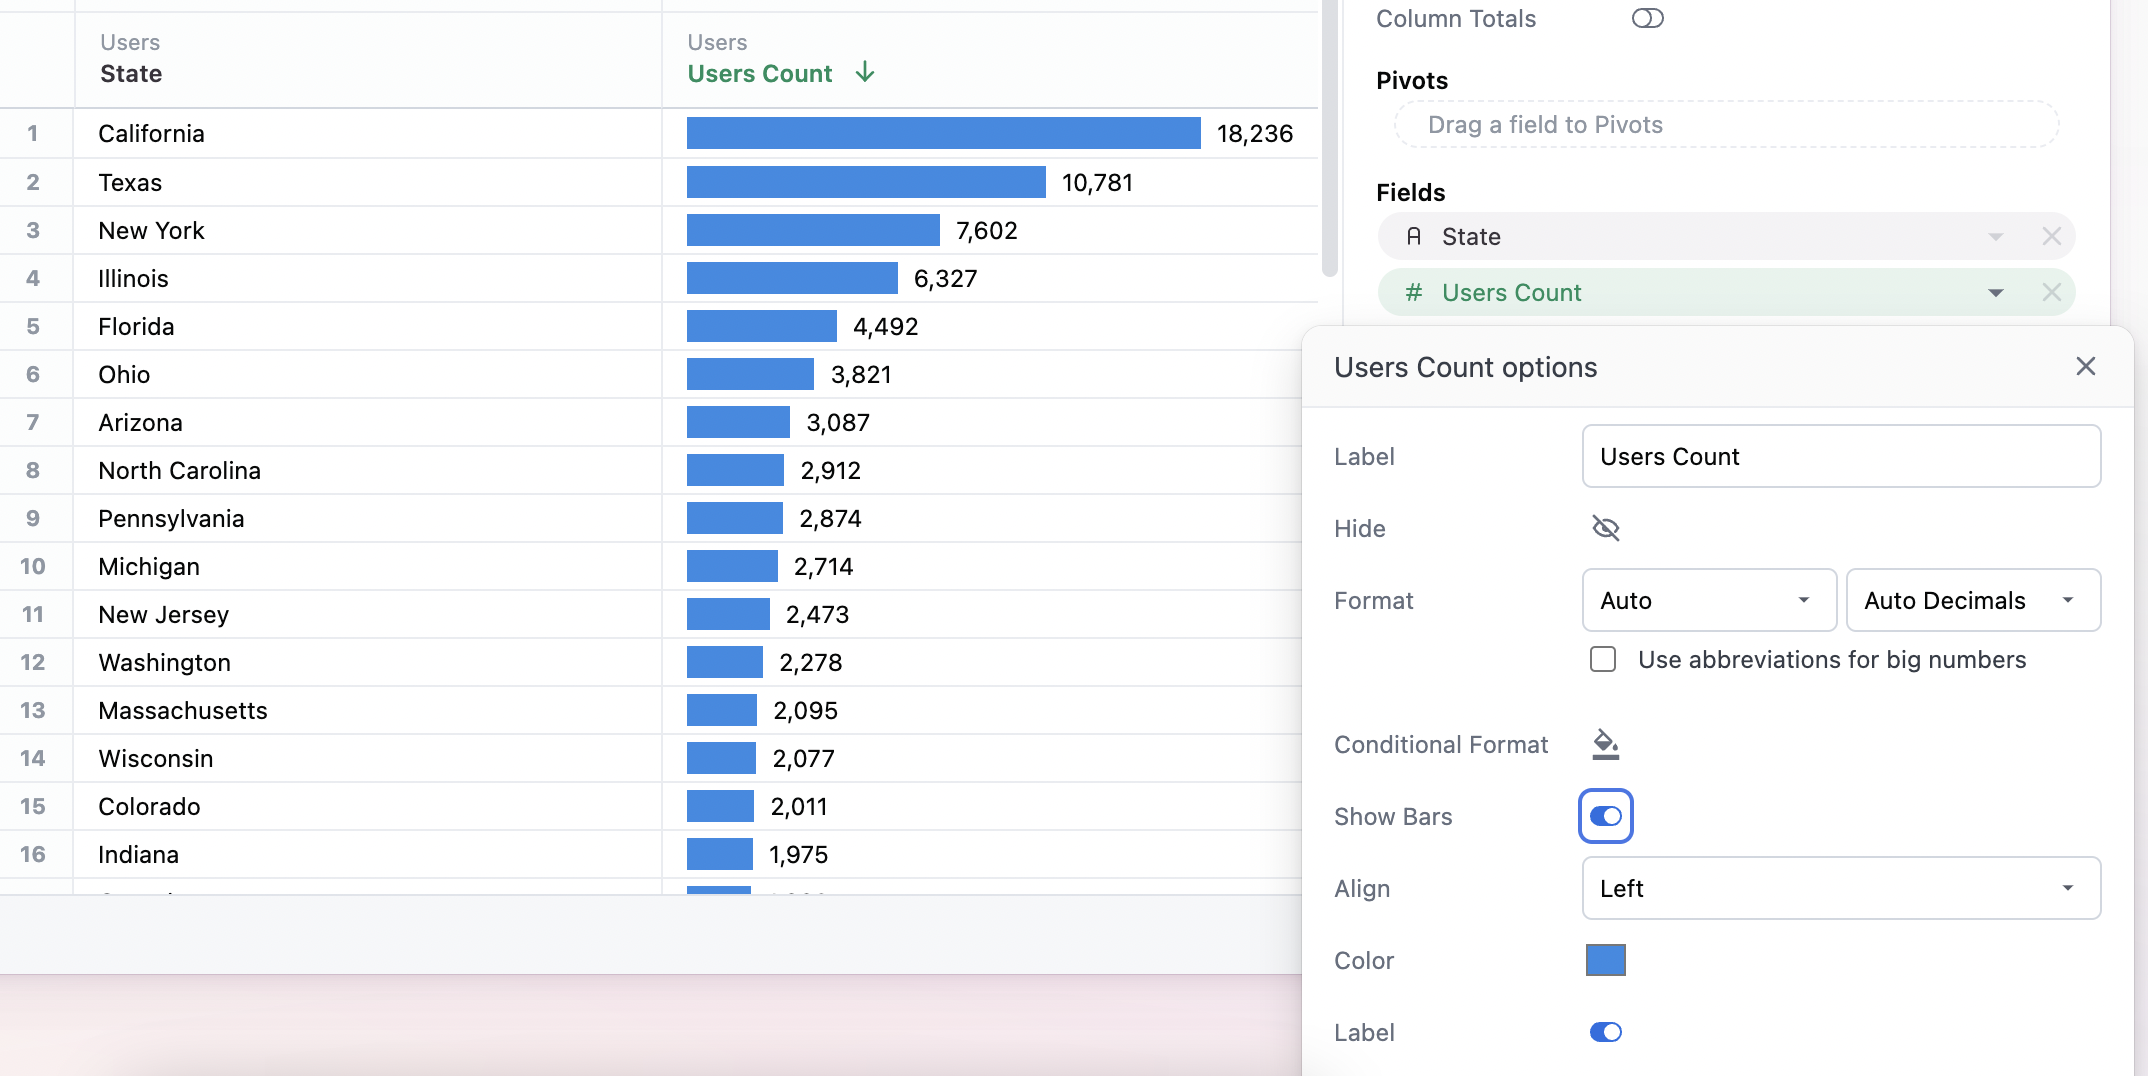
- In-table bars now have conditional formatting for more visual styling options.
- Workbook URL schema changes now provider finer grain control to reorder workbook tabs via the URL. Those changes are kept in sync with the associated dashboard for seamless operation.