July 26, 2023 - Scheduled dashboards, text tiles, Markdown, and more
Scheduled dashboards
Dashboards can now be scheduled so you can keep up with your most important metrics from anywhere. We also released new admin and management controls to make it easy to manage all your scheduled content from one central spot, and you can even navigate usage by sender or recipient (to help you curate a seamless experience for folks who aren’t in Omni yet!
Dashboard text tiles
Add text, links, images and more to your dashboard with a new markdown-based text tile.
Markdown visualization
A whole new viz type that makes it possible to create beautiful, info-dense tiles with a combo of text, markdown elements, and query variables. Check out some of our favorite examples:
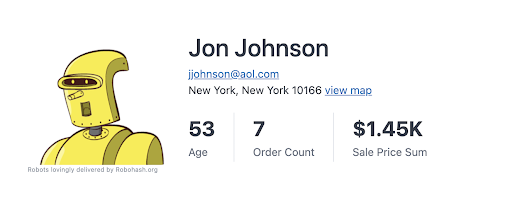
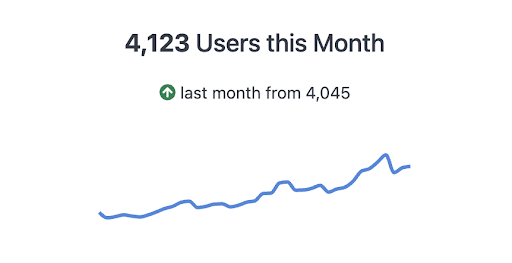
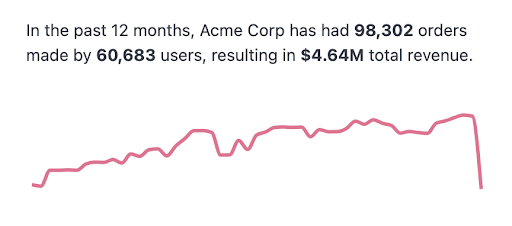
Read all about Markdown visualization in our documentation
Visualization updates
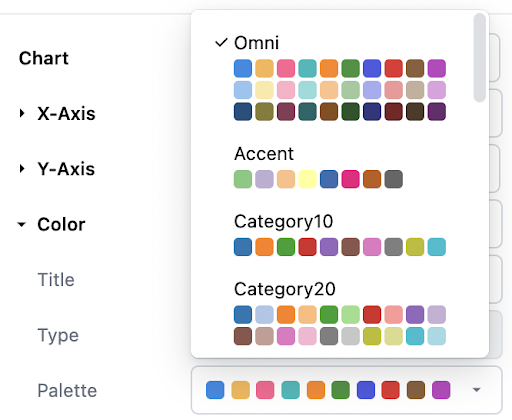
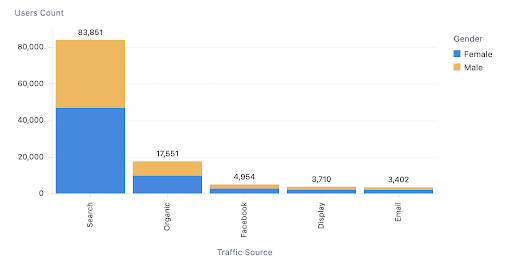
We’ve made a bunch of viz updates to help you easily communicate results - totals on stacked bars, conditional formatting, and a new color palette picker.
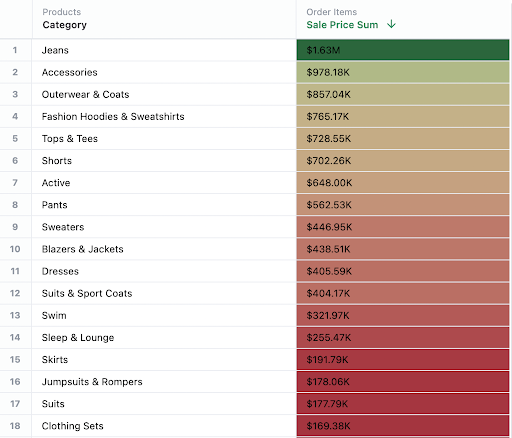
Create filtered measures from pivot tables
Often we want to compare components of a group to the group itself - purchases by region, opportunities by stage, traffic by channel, and so on. Filtered measures make this easy, but they can be tricky to build if you need complex case statement logic (or even don't want to look up syntax). Now, you don’t need to do either because we’ve made it trivial to create filtered measures from pivot tables (shown below) and reference totals for **custom calculations.

Other Improvements
- **Default_drill_fields model parameter: **global control for defining a default drill path for every measure on a view
- **Custom view_label parameter on fields: **group fields under a different view label in the field picker
- Context menus on IDE files: right click on a file in the IDE to save, rename, or delete
- Pie chart improvements: expose data labels and option to hide the legend
- **Wide visualization legends: **expand the width of legends for easier readability
- Log scale for visualizations: change the axis scale between linear or log
- Expand cells on table: can right click on a table cell to expand the text and copy/paste (useful to see the full contents when a cell is super long!)