August 31, 2023 - KPI visualizations, row-level permissions, and SQL Server support
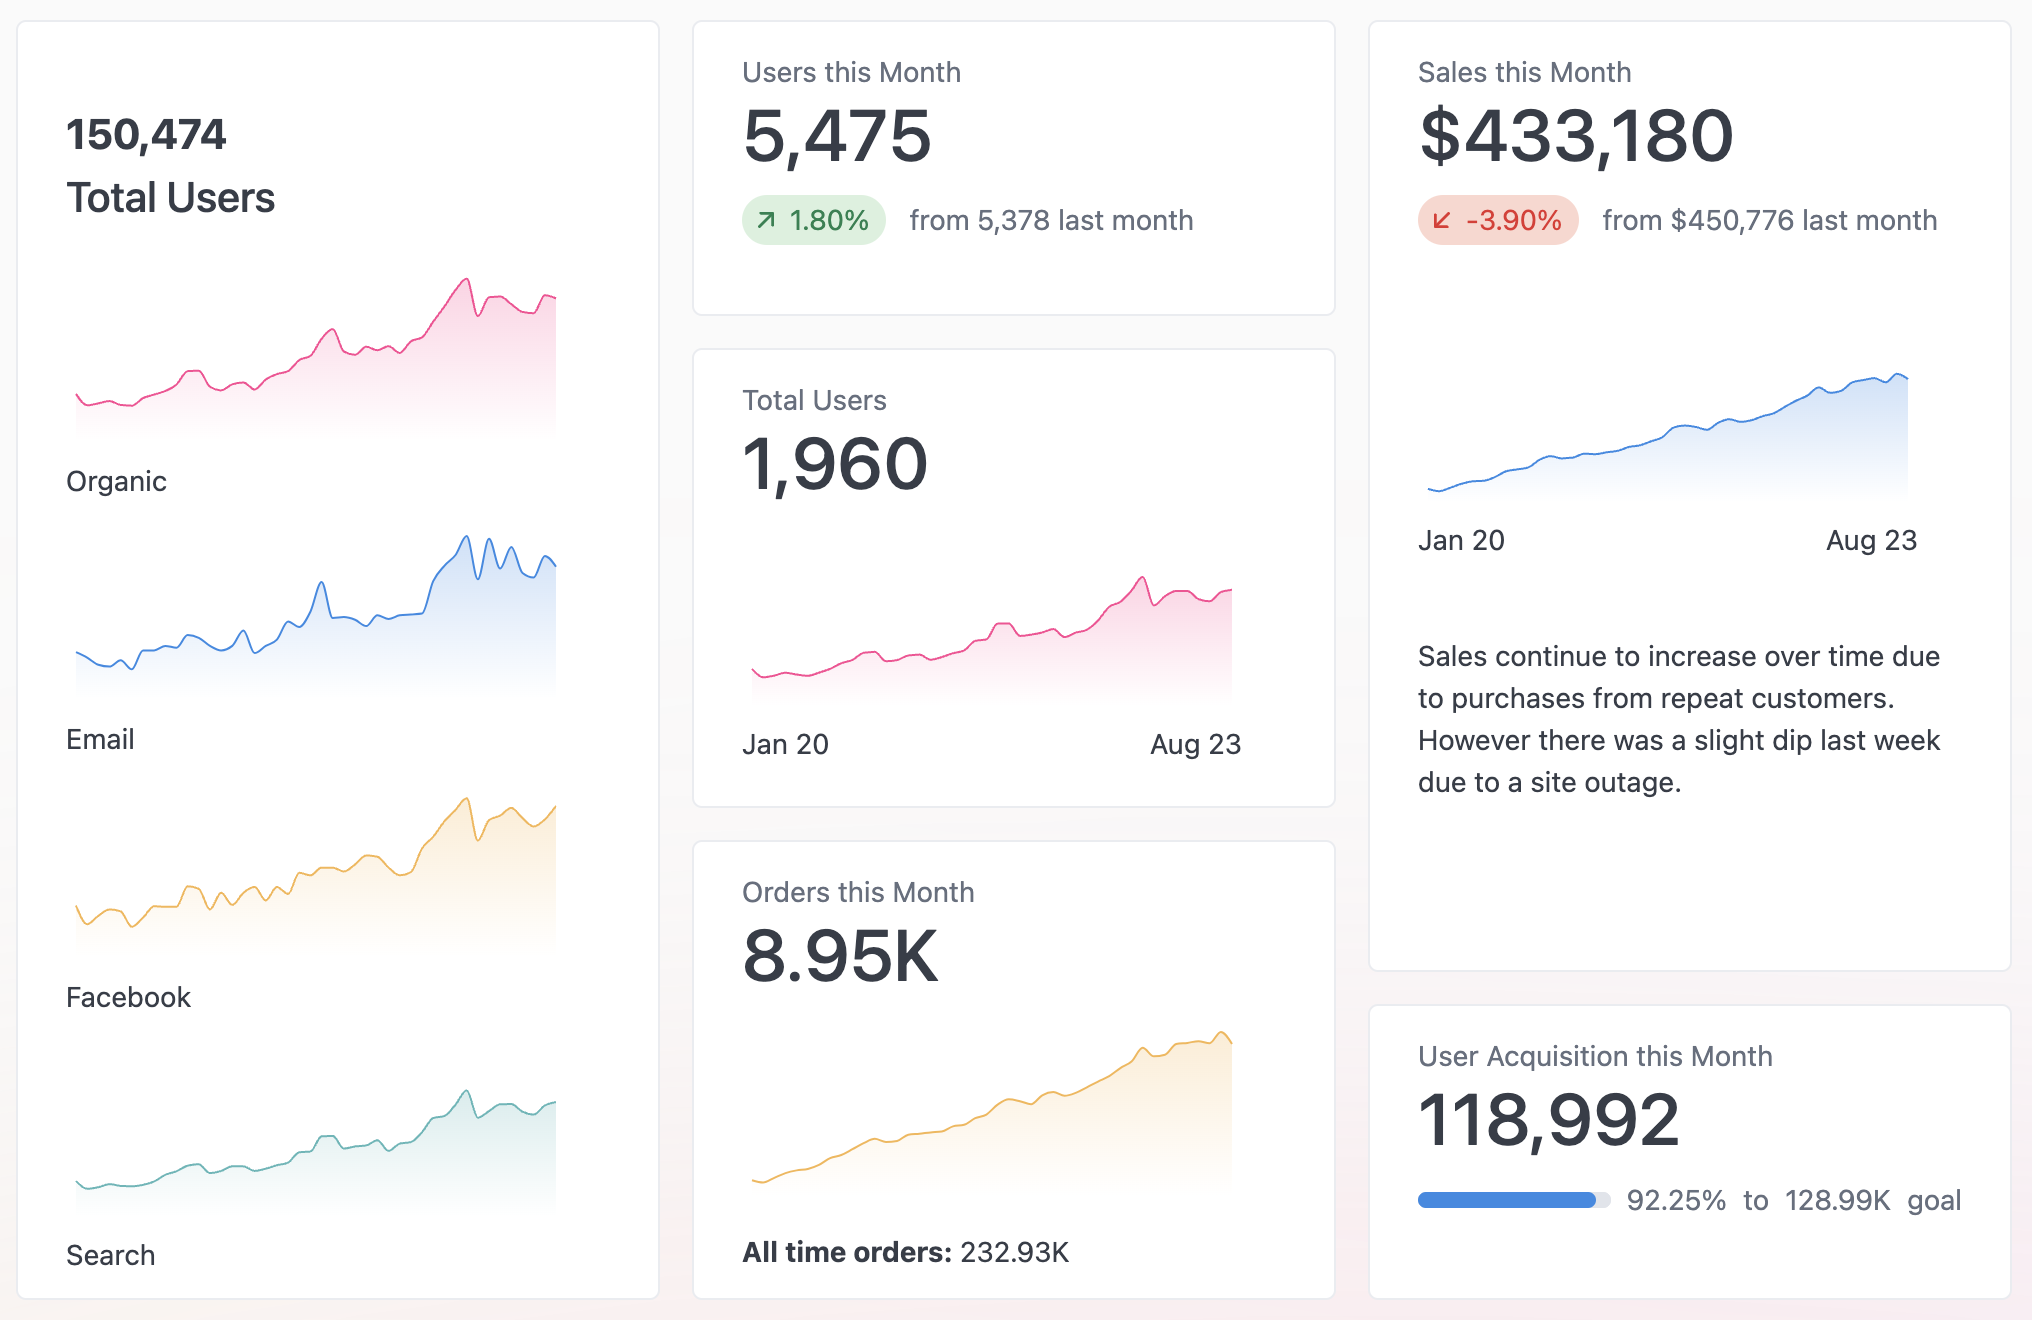
KPI Visualizations
A new WYSIWYG visualization type that combines numbers, charts, change arrows, progress bars, text, and more to build flexible KPI tiles.
Visualization Timeframe Switcher
Swap out the timeframe granularity directly inside the visualization editor. No more need to go back to the query to change out the field.
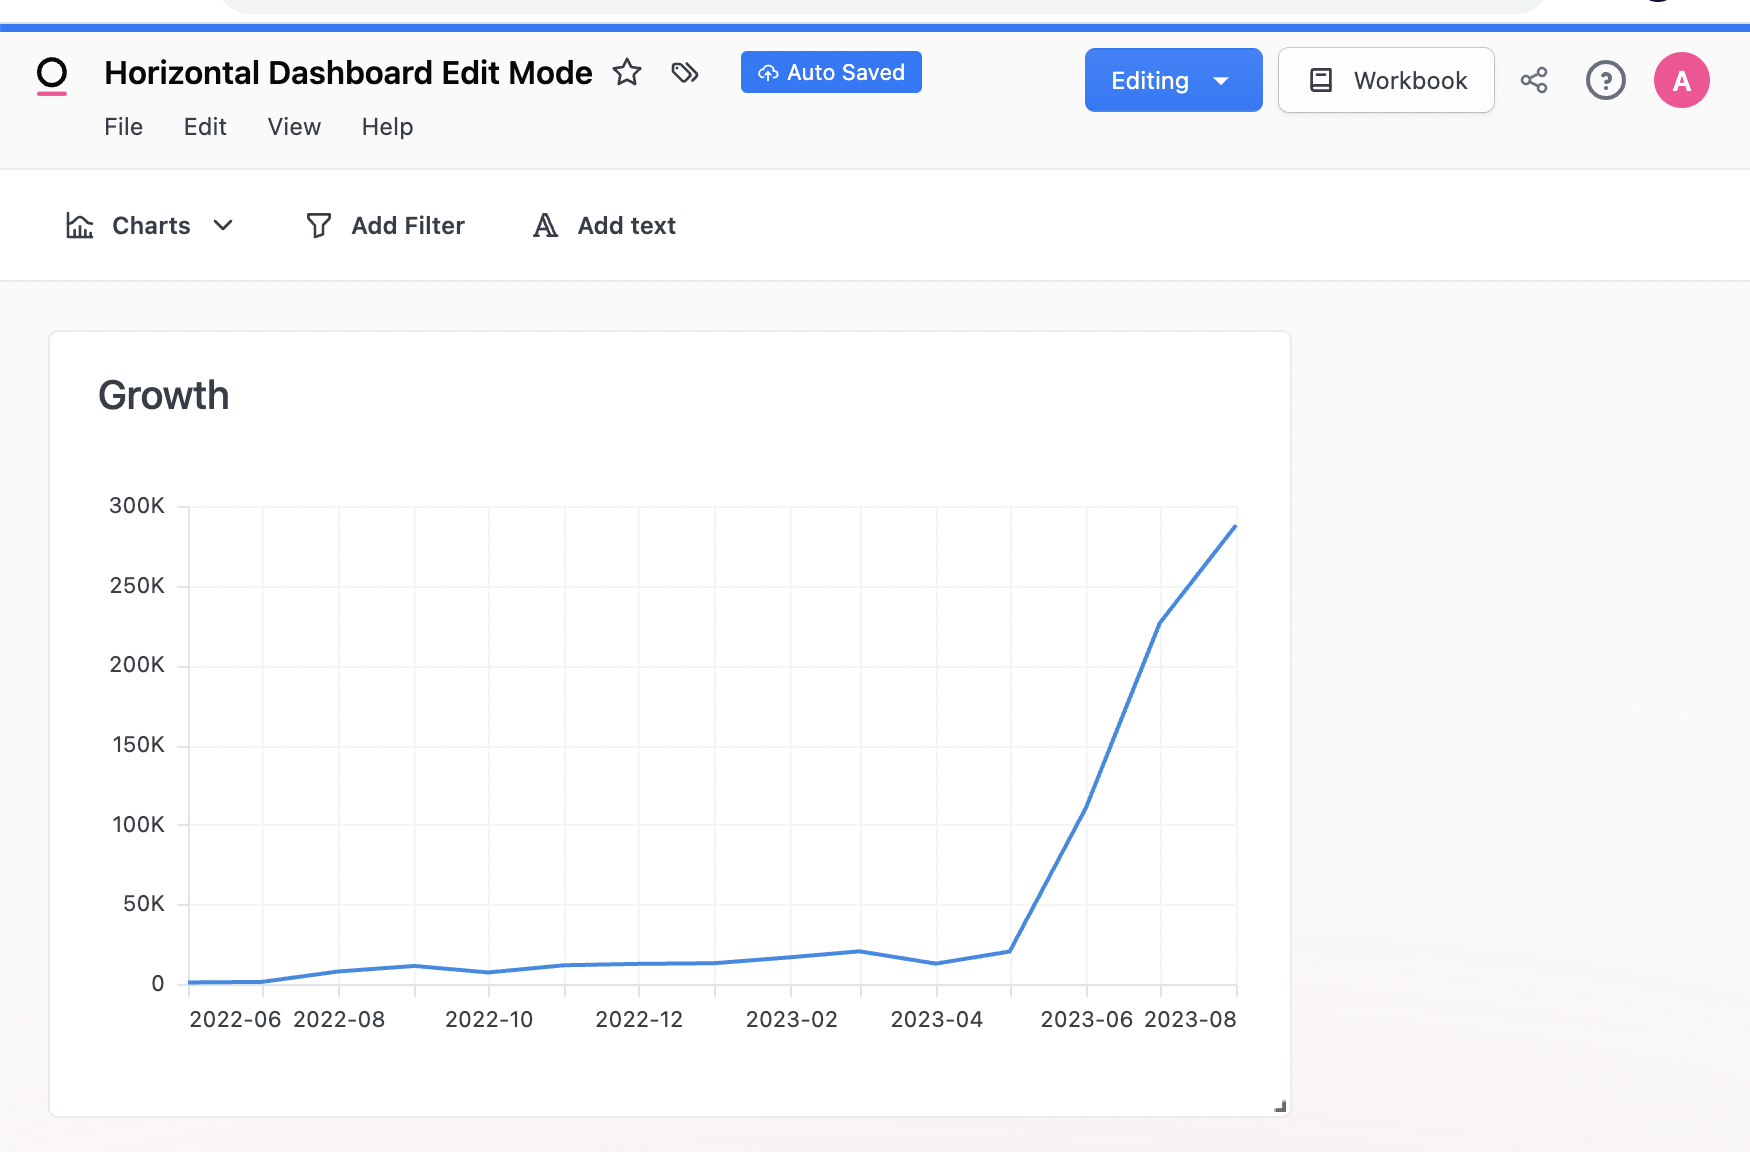
Dashboard Edit Toolbar
Getting dashboard tiles sized exactly right is easier than ever with a change to dashboard edit mode. Rather than the edit bar being on the side of the screen, it’s now at the top so the size of your tiles always stays consistent regardless of whether you’re in edit or view mode.
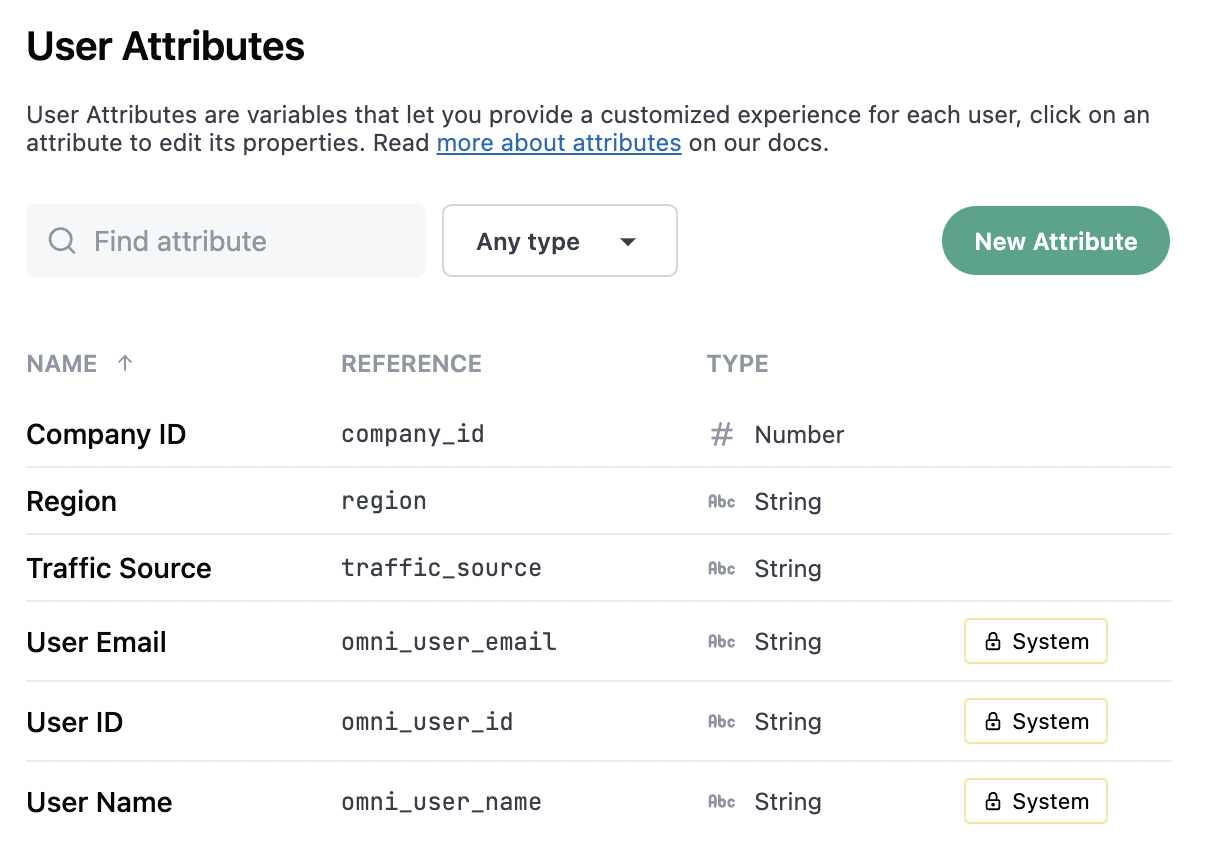
Row-level Data Permissions
With user attributes and a new topic-level access_filter parameter, you can now control what rows of data a user can see. This allows you to build the same query or dashboard, but depending on an individual users’ attribute value, they will only see the rows applicable to them. One example of this in use is if you want to restrict a sales rep’s visibility to only their accounts. Also very useful for serving up analytics to your external clients where you want to build a dashboard once, but ensure each client can only see their rows of data.
Microsoft SQL Server Support
New dialect alert! Omni can now connect directly to Microsoft SQL server.