October 13, 2023 - Maps, Topic Organization, Schedule Options, and lots o' vis and model improvements
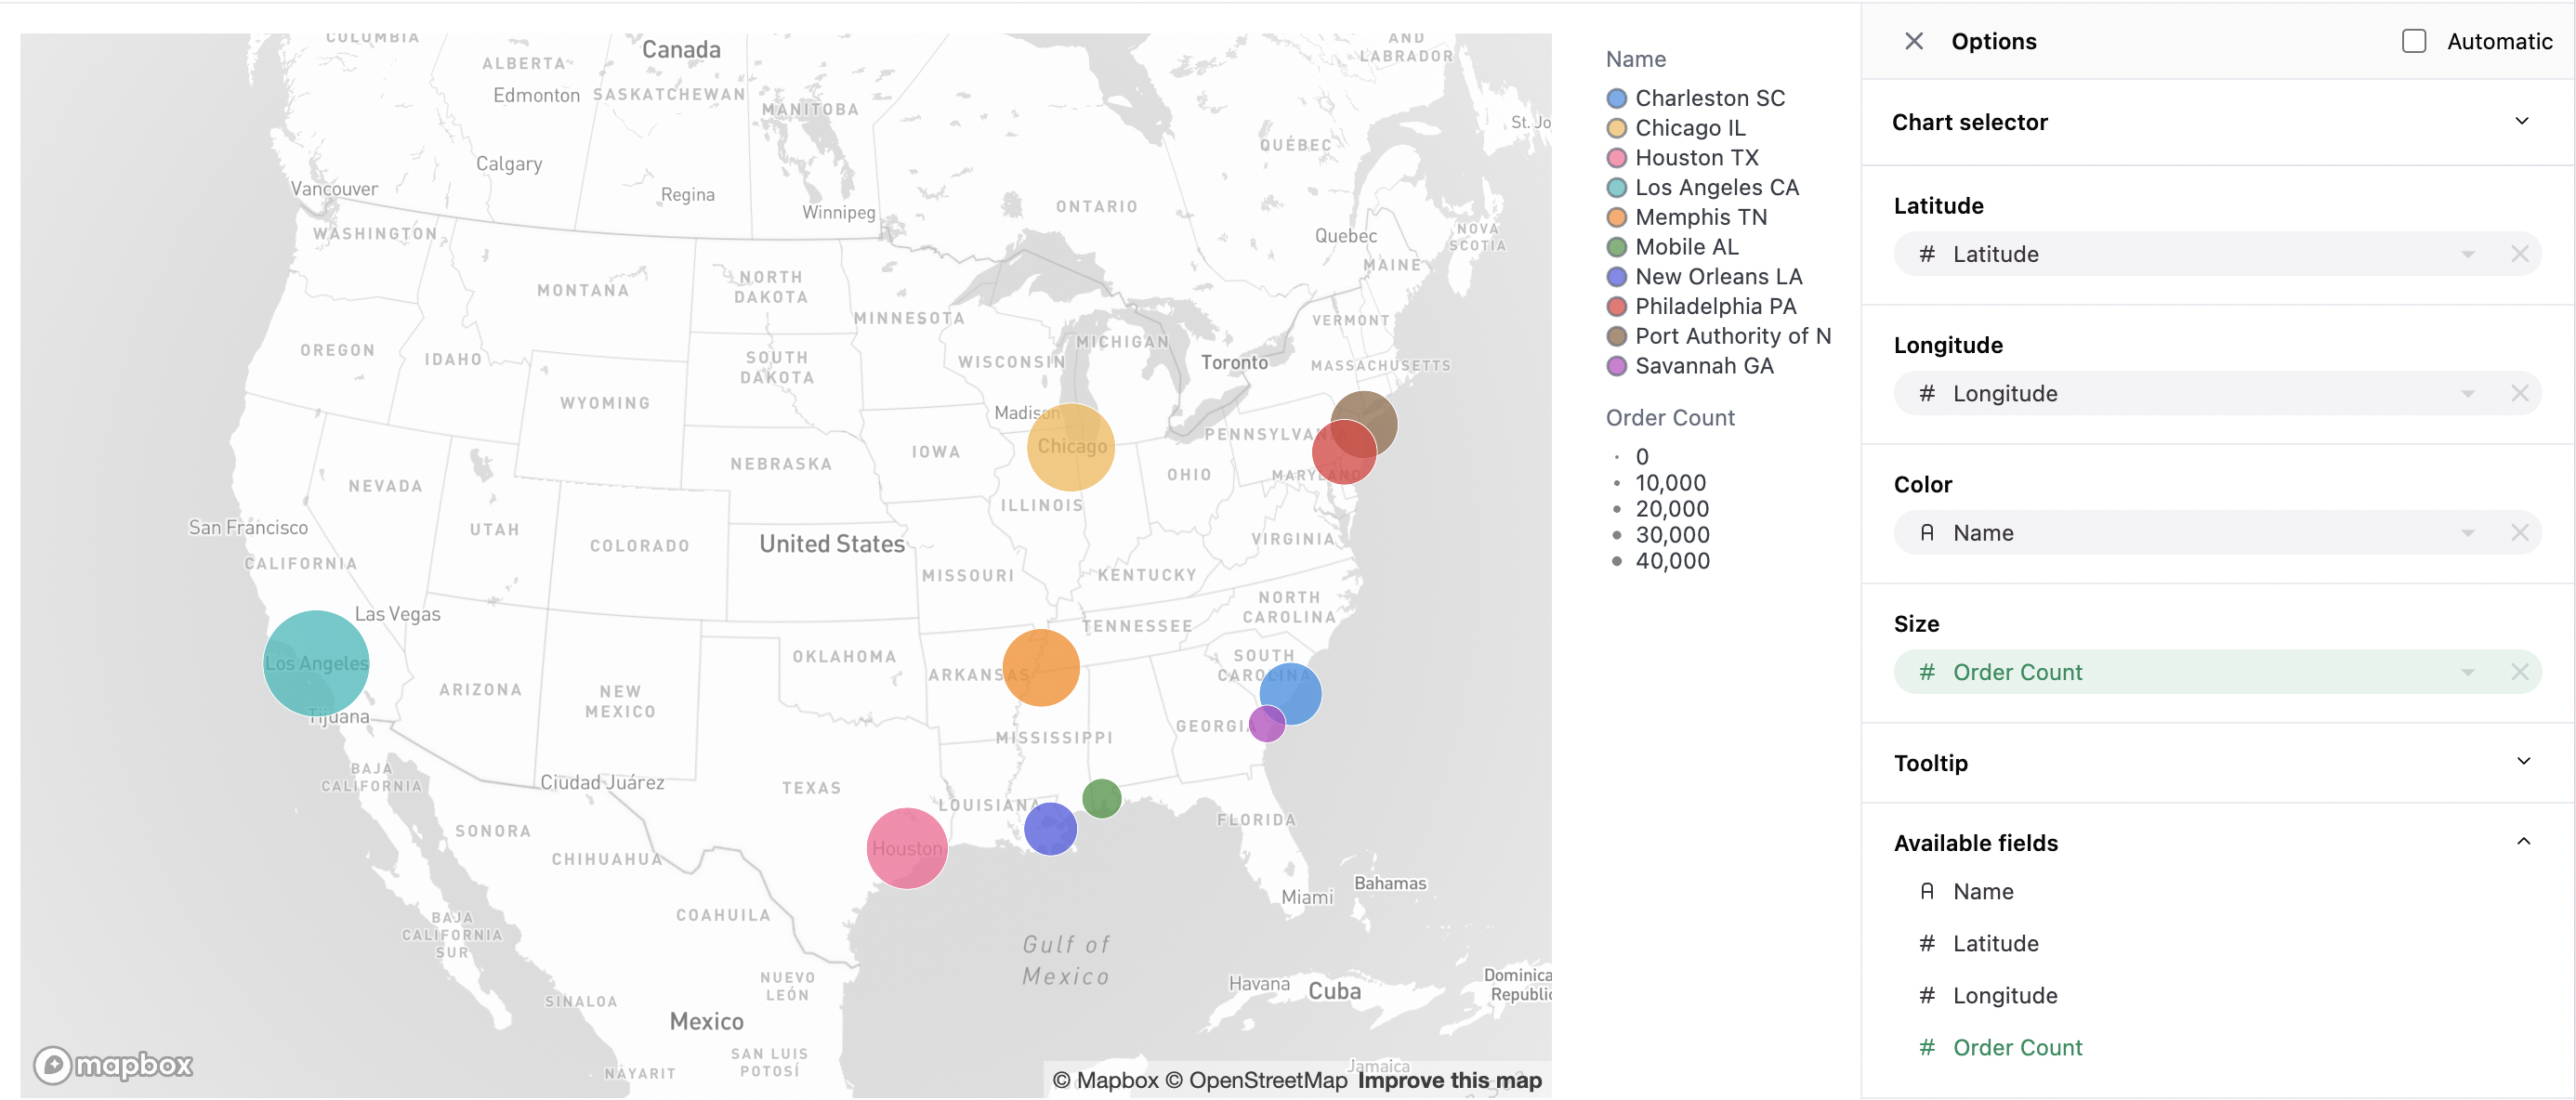
Map Visualizations
Have geo data? Now you can plot it on a map visualization!
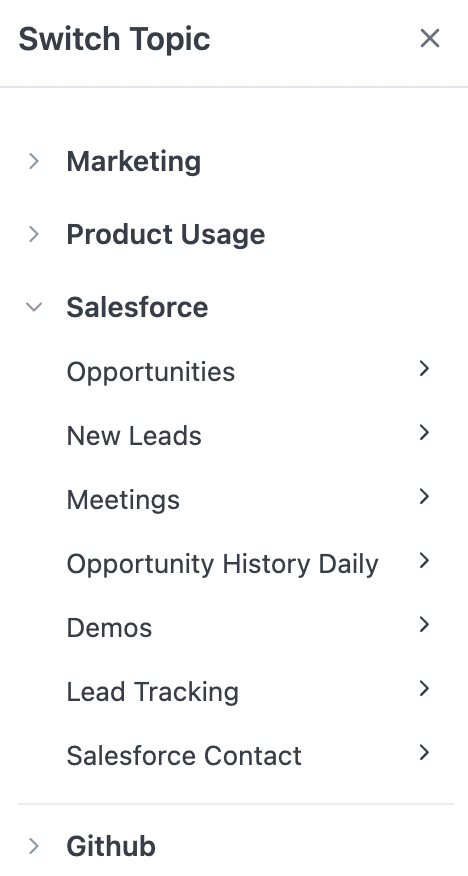
Topic Organization
New topic-level model parameter (group_label) to group topics together in the UI, making it easier for end users to find the exact dataset they are looking for.
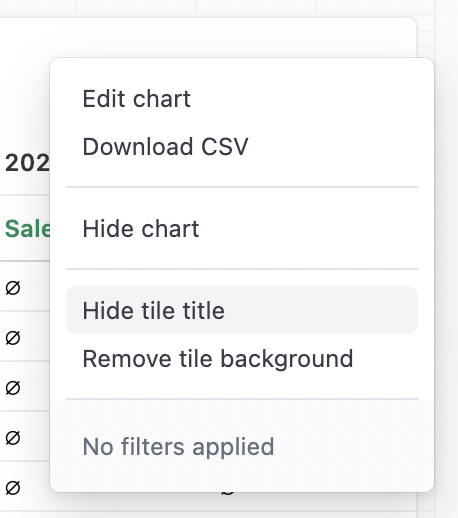
Dashboard Settings
More dashboard stylistic controls. You can now remove tile titles or backgrounds and borders for that ‘floating’ tile look.
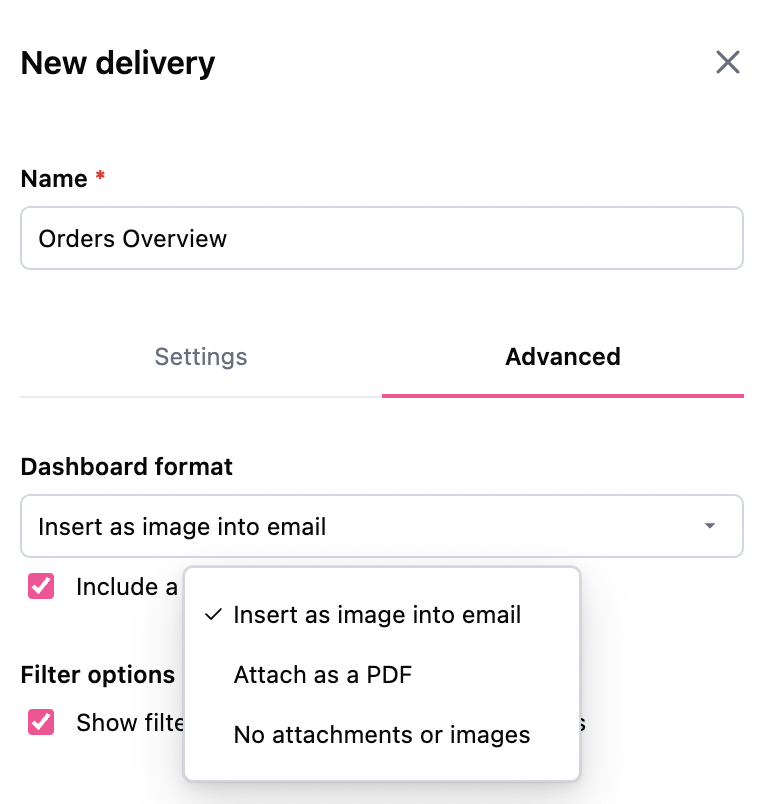
More Scheduler Options and Formats
Choose between receiving the dashboard inline in the email, attached as a PDF, or maybe just a link-only to see the dashboard live. You can now also choose to hide filters on the dashboard PDF or PNG.
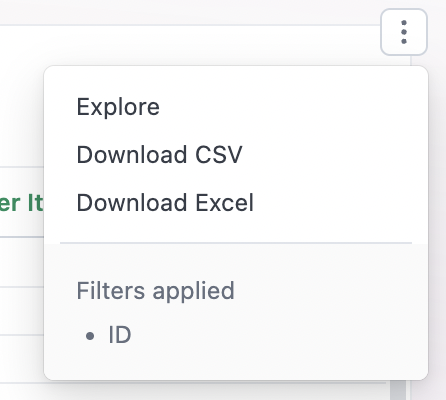
Download to Excel
Now you can choose between CSV or Excel as download options.
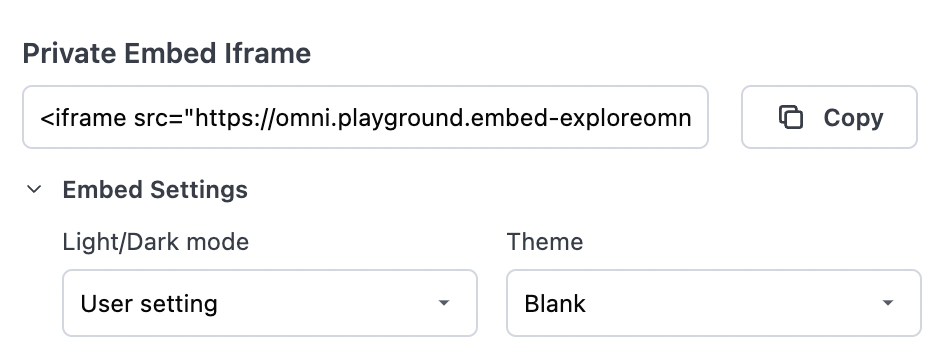
Embed Settings
When you're trying to get that perfect embedded look, sometimes you just need a few more controls. Now you can set the theme and light/dark mode for embedded content.
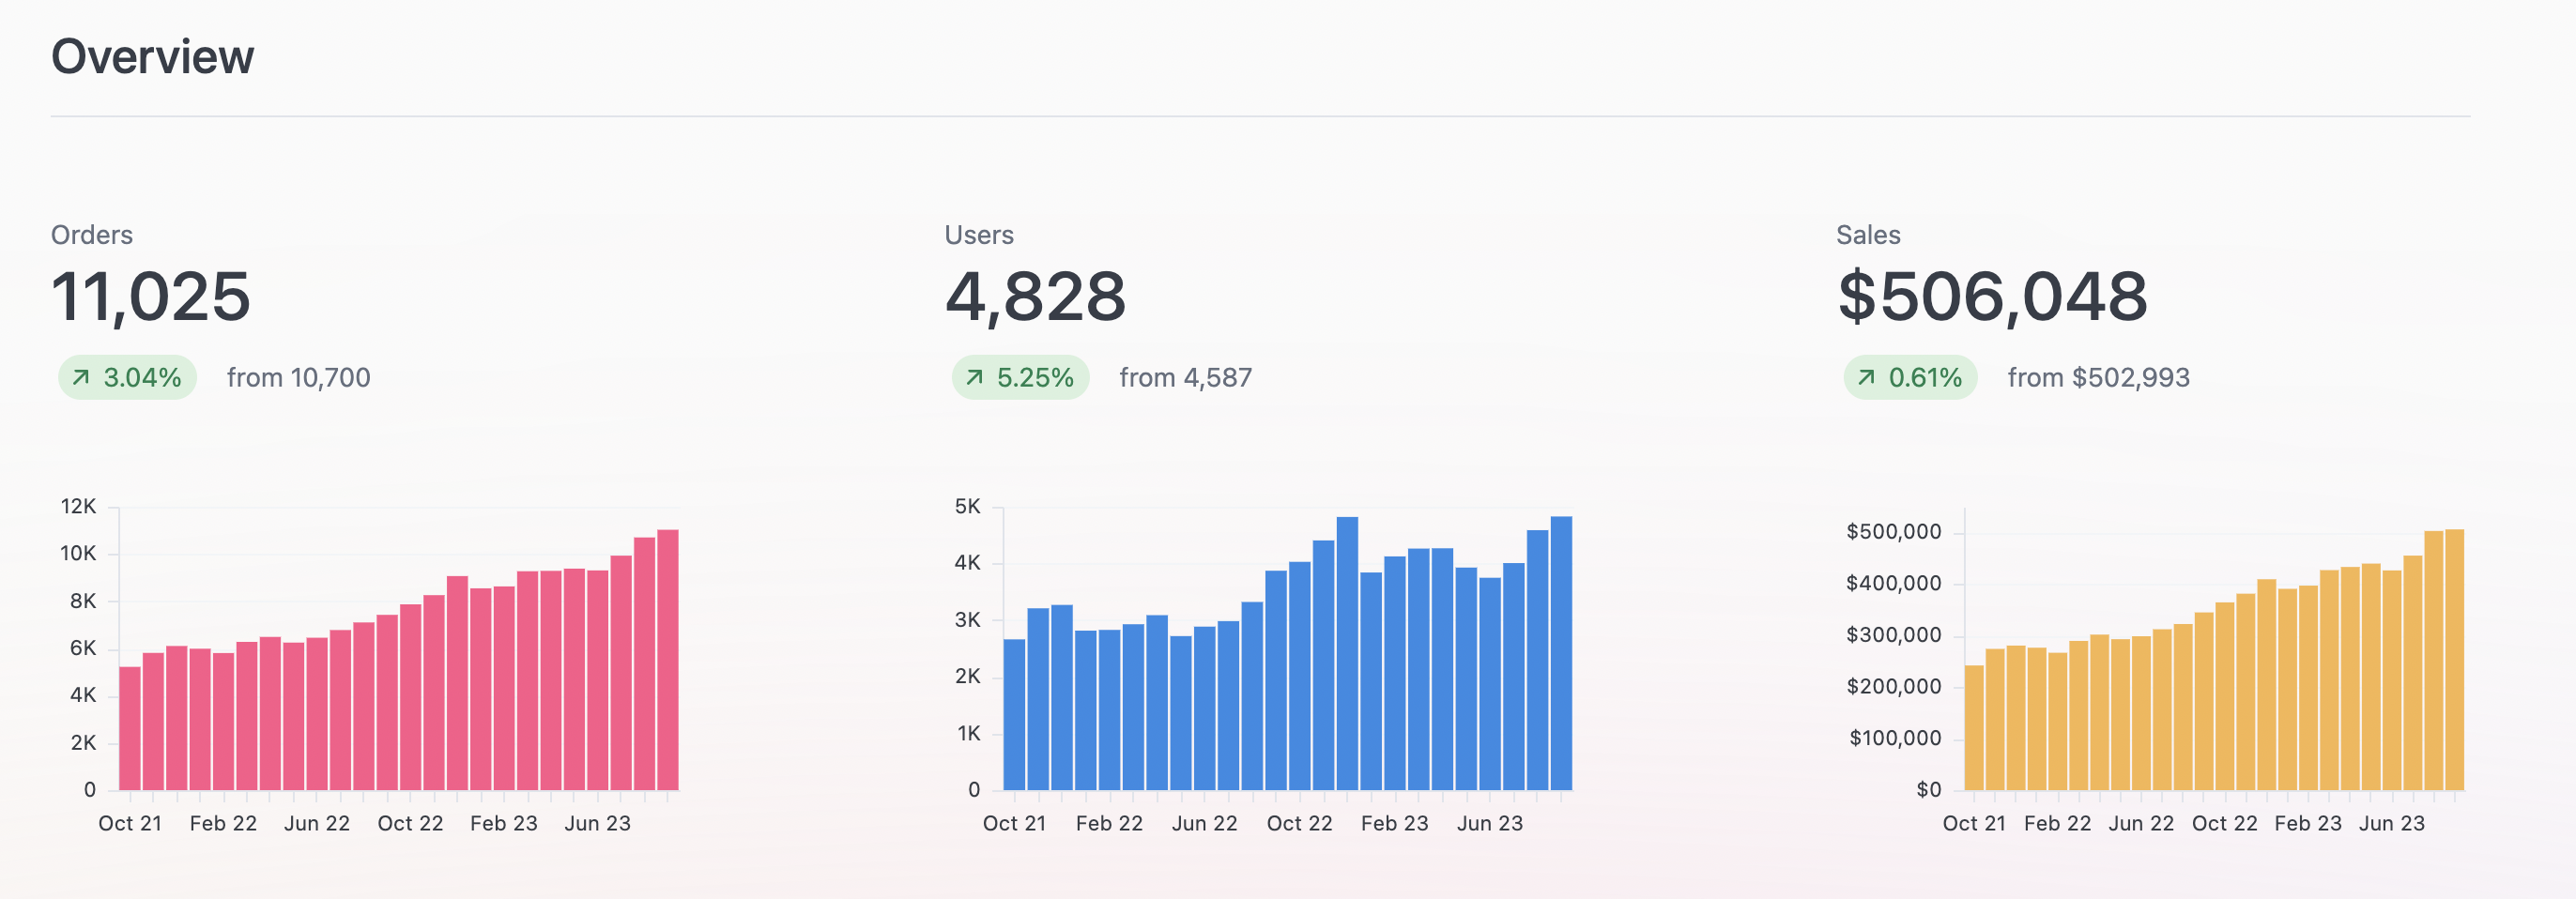
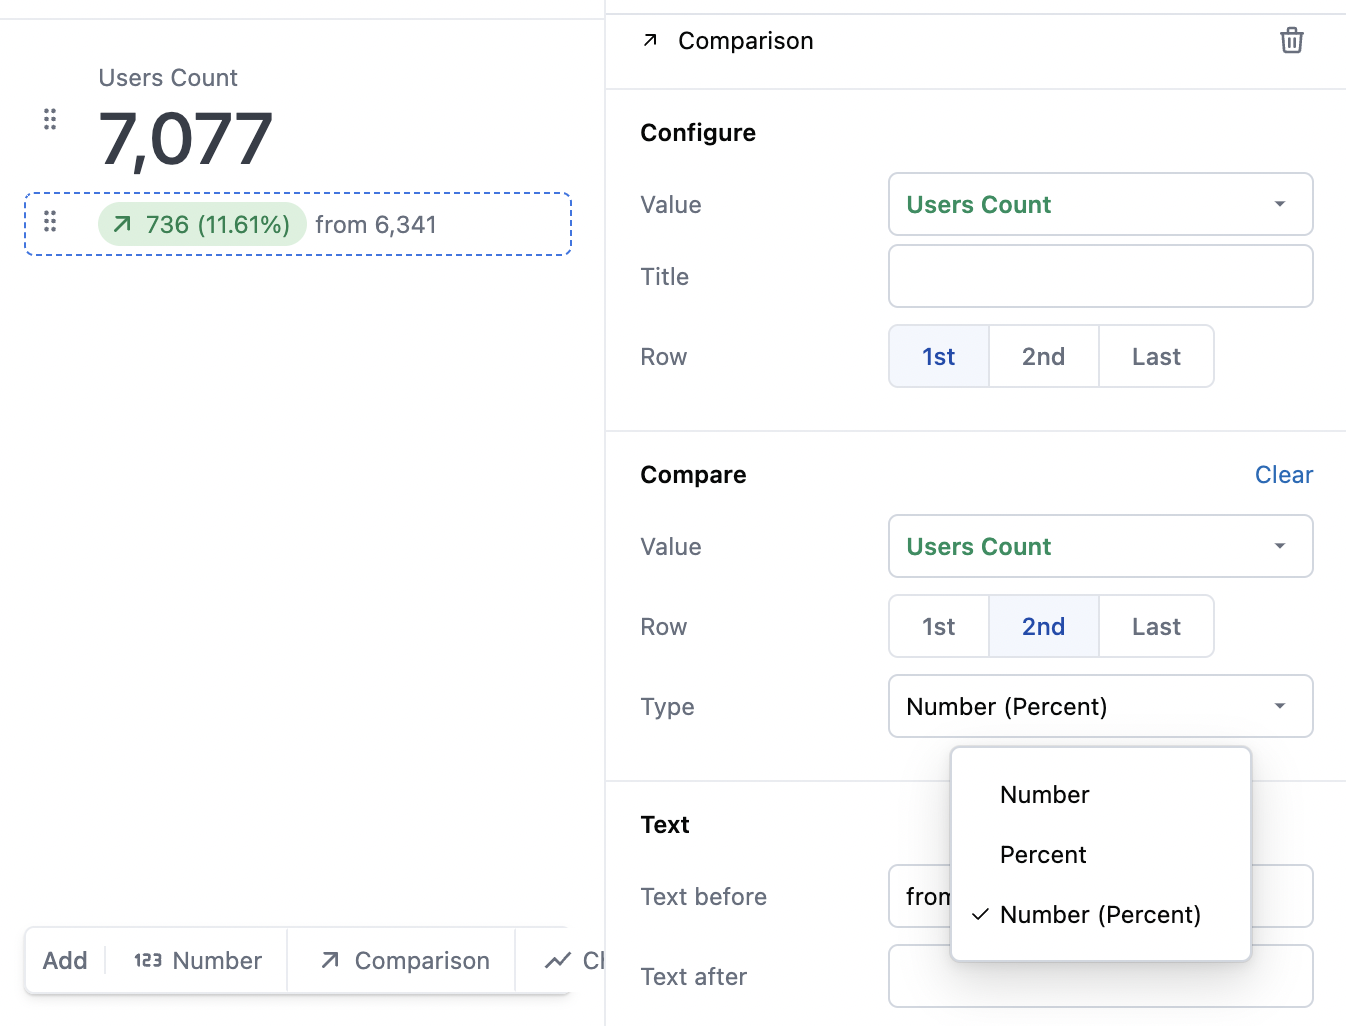
Vis Improvements
New options for the KPI vis - can now show the comparison number as an absolute, percent, or both!
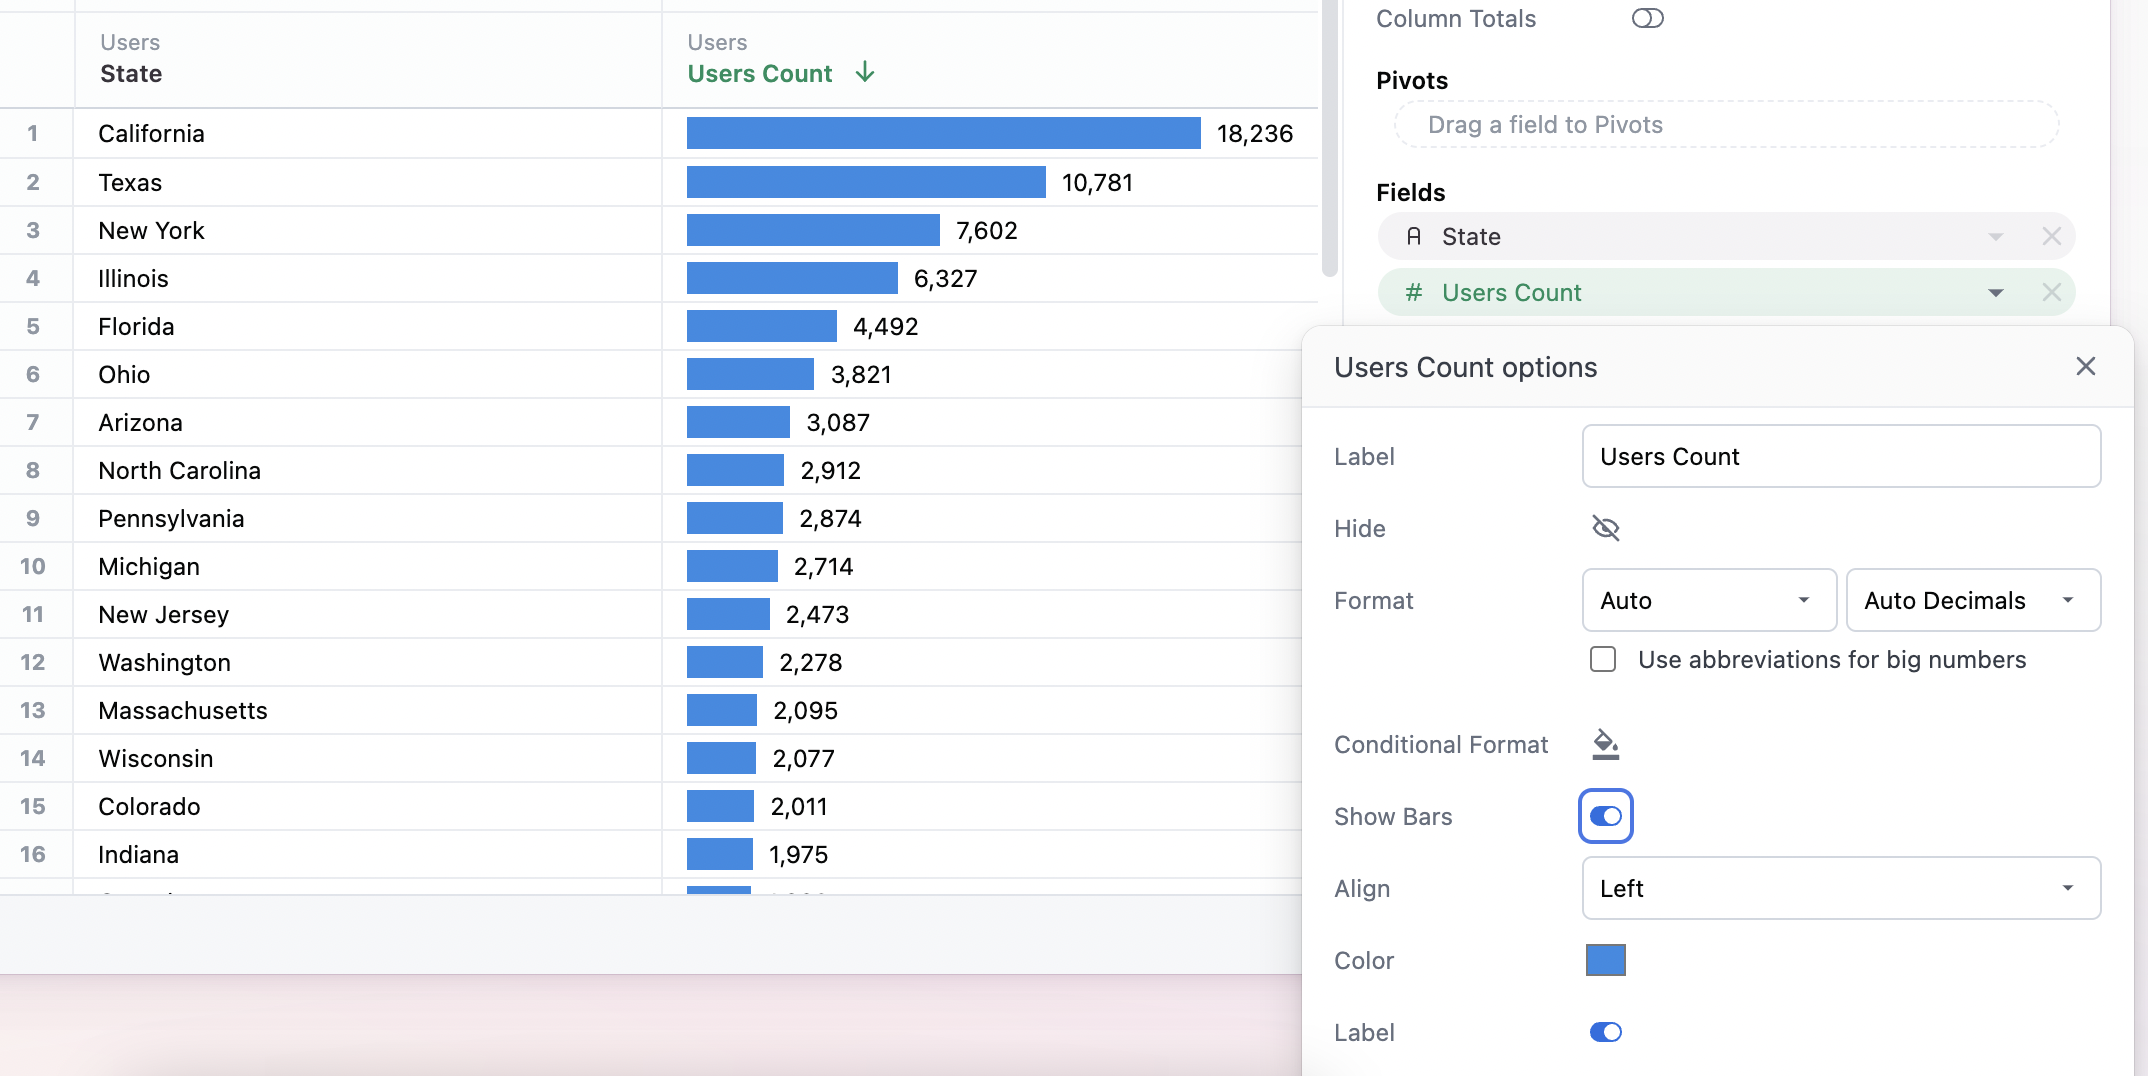
And if you're looking to add a little visual flair to your tables, you can now add in column bars.
We've also made some sizing changes to legends to automatically fit the space much better and prevent legends from being cutoff.
Modeling Improvements
Lots of new model goodies this week!
order_by_field- order a field by another field. Great for setting custom sort orders- topic level
always_where_sql- always apply a filter to any query run on a topic where_sqlfor relationships - insert a condition into thewhereclause when that specific join is used- query views nest into schema folders in the IDE - instead of query views hanging out solo in the IDE, they'll now be nested into the appropriate schema folder for enhanced file organization