Querying Data
To write queries using the pivot-table UI, simply select fields to query and Omni will automatically begin running queries in the database.
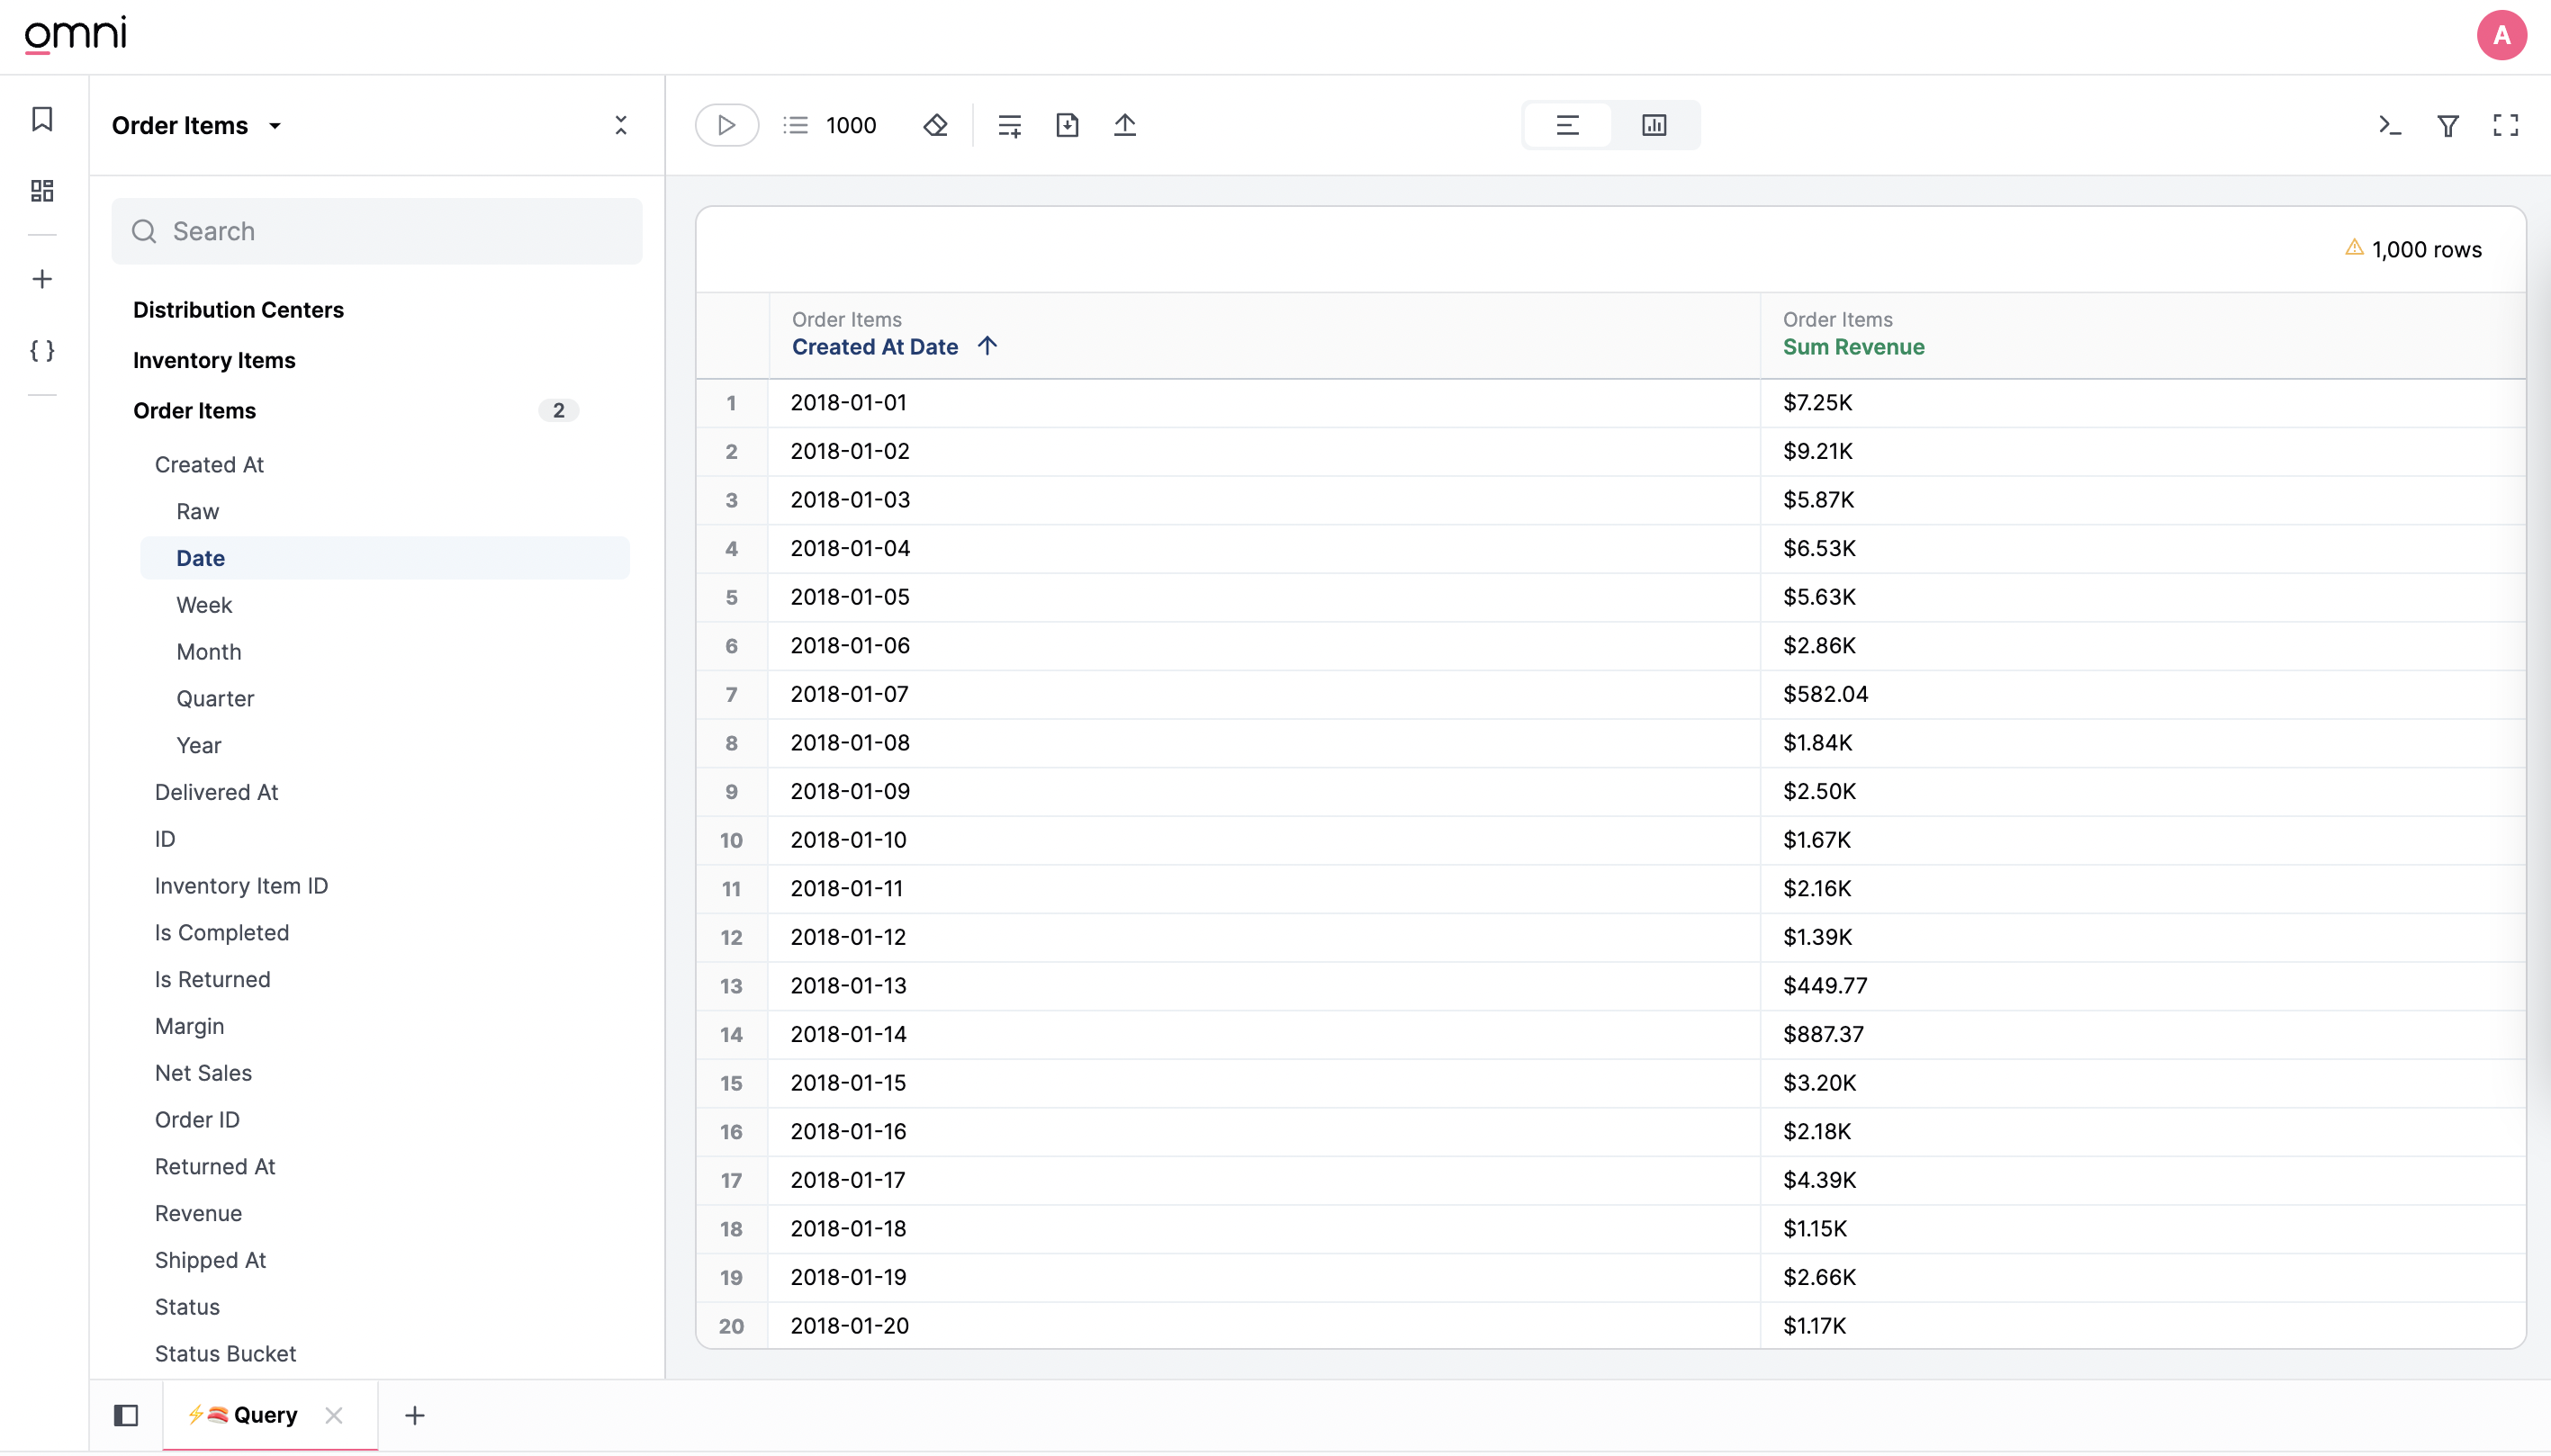
Dimensions and measures are divided into separate sections in the field picker, each nested under individual tables in your data warehouse. A dimension is a grouping in your query (date, location, type, etc). A measure is an aggregation over your dimensions (sum, count, average, etc). For example, to query total revenue per day you would select a date dimension (order_items.created_date) and a revenue measure (order_items.sum_revenue). Here's an example of what that would look like:
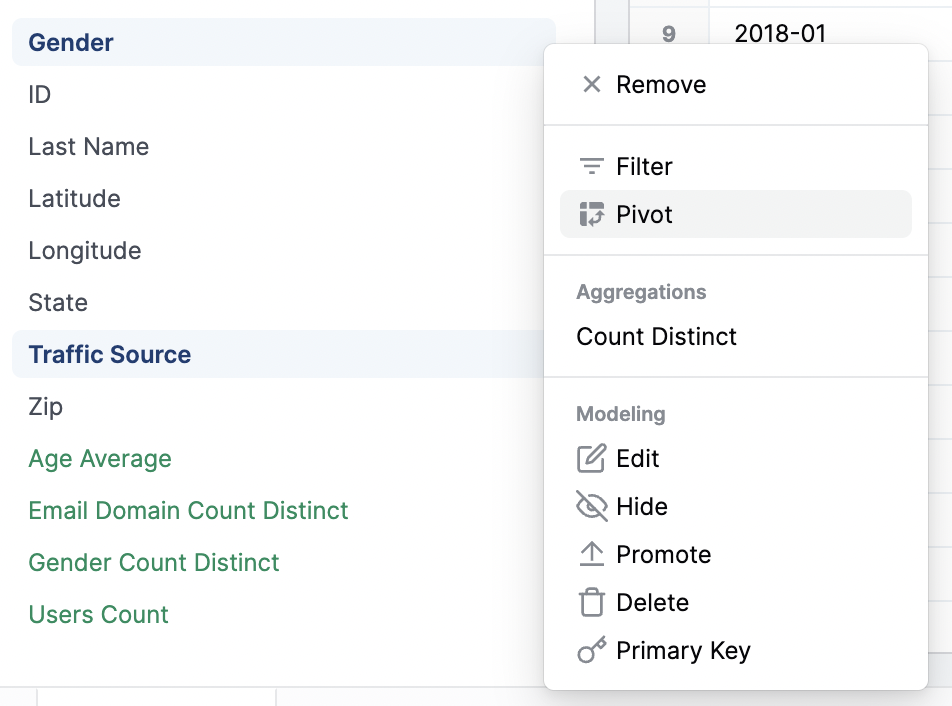
There are several advanced actions available on field selection using right click, or using the kebab-icon (3 dot menu) that appears on hover.
Searching Fields
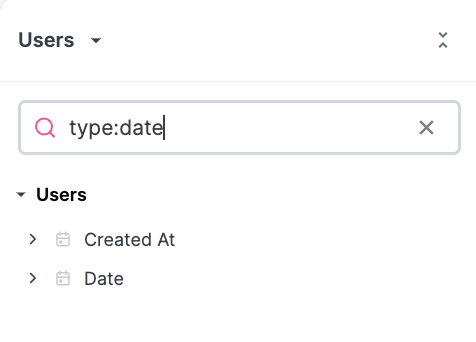
Fields can be searched with the input box above the field picker. Default search will hit fields and views. There are also operators that allow for more custom querying of the fields, using tags, schemas, or types. Search
schema:my_schema
is:dimension           # can be dimension, measure, hidden
model_type:schema      # can be schema, shared, branch, workbook, query
data_type:timestamp    # can be date, string, boolean, interval, array, json, number
tag:my_tag
Filtering
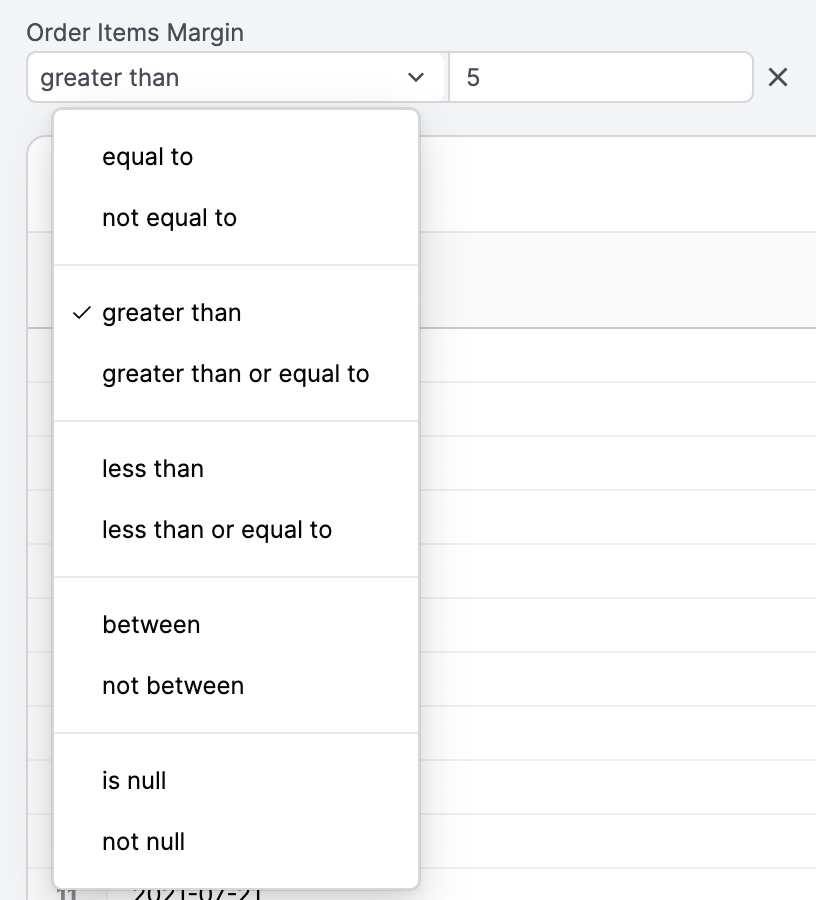
Each dimension can be added as a filter, to focus on specific rows of data. Different filtering options will be presented for dates, numbers, and strings:
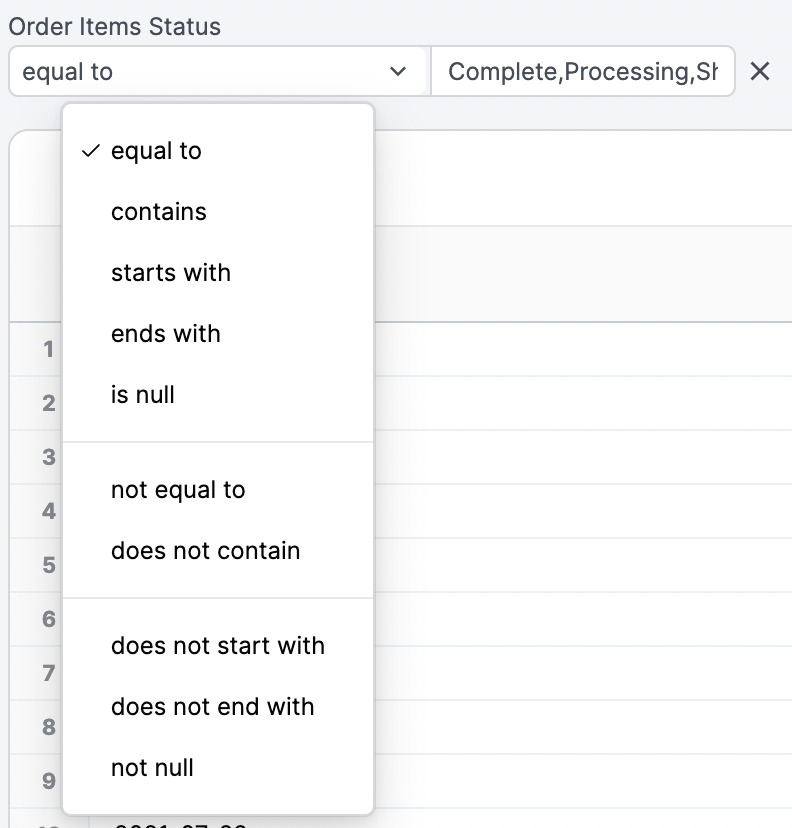
To filter over more than one value (using OR), simply insert a comma in between values: [bread, cheese]
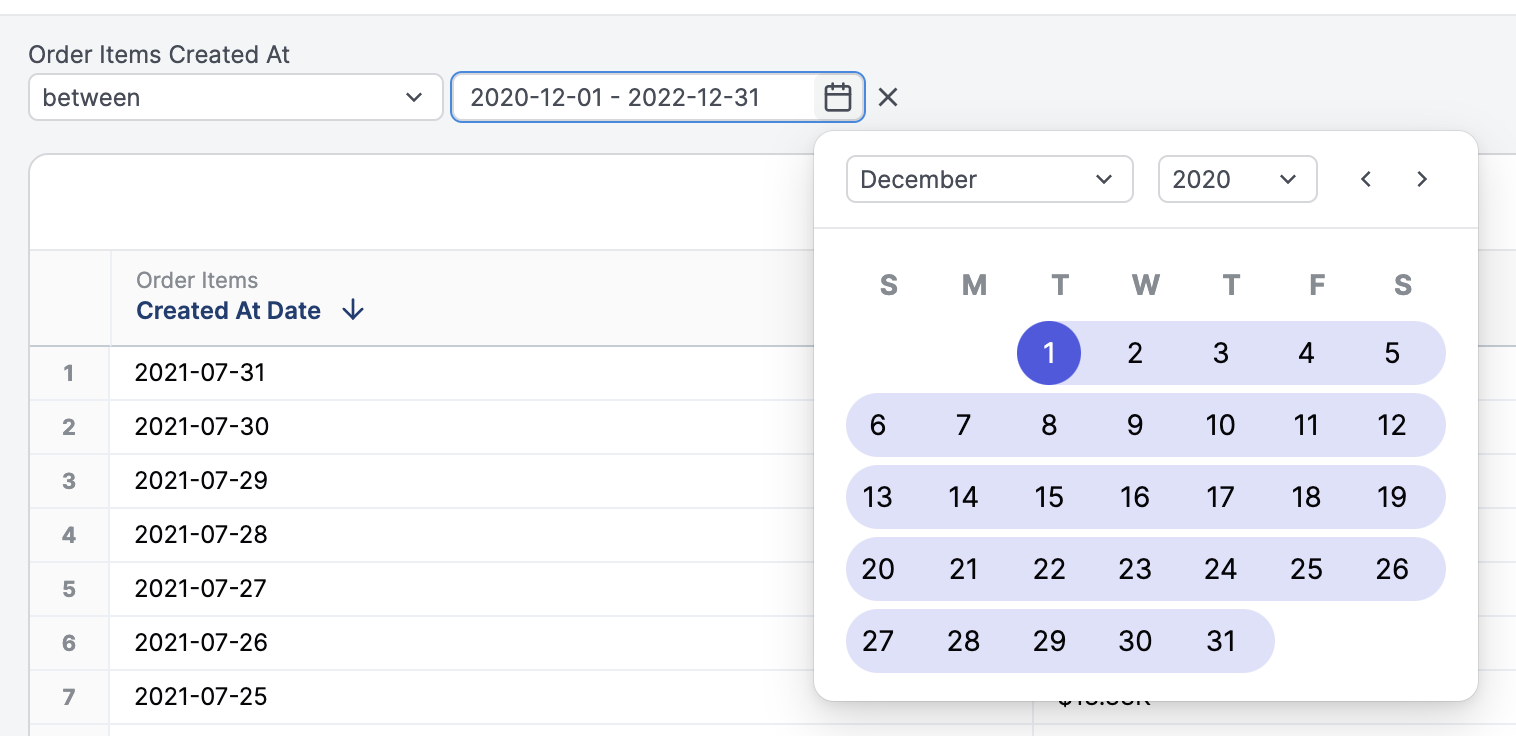
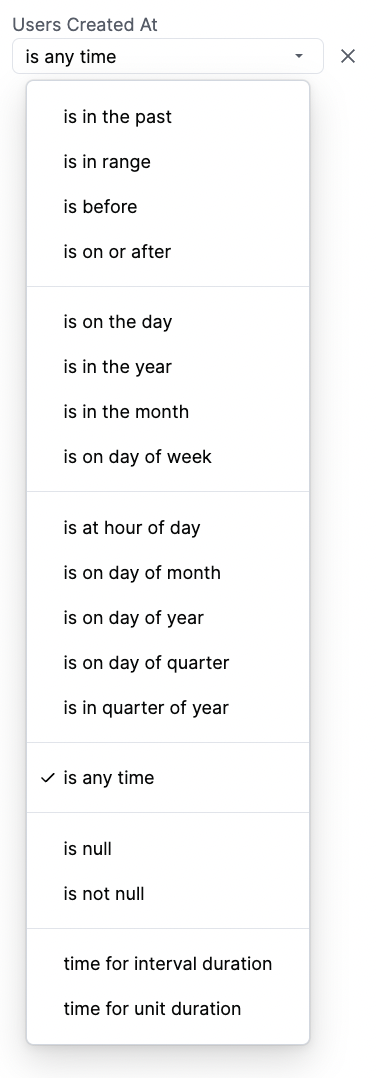
Date Filters
Date filtering offers several UI driven filter options, including both absolute date filtering ('2022', '2023-01-01', '2021-Q4') and relative date filtering (after 7 complete days ago, 1 year ago).
At times, filtering may require using both absolute and relative dates (first ten days of 2023, 100 days ago for 10 days). For these, time for an interval duration offers more flexible time inputs. The first input should contain the starting point, and the second input should contain the duration. The starting point should either be a date ('2023-01-01') or a relative date ('10 days ago', note ago is required). Below are some examples of 'Time for Interval Duration' and their corresponding inputs:
- First ten days of 2023:
[2023][10 days] - 100 days ago for 10 days:
[100 complete days ago][10 days] - 1 hour ago for 2000 milliseconds:
[1 hour ago][2000 milliseconds]
Intervals can accept any unit timeframe, here is a complete list:
- Base timeframes
day,days,complete day,complete daysweek,weeks,complete week,complete weeksmonth,months,complete month,complete monthsquarter,quarters,complete quarter,complete quartersyear,years,complete year,complete years
- Additional timeframes
millisecond,milliseconds,complete millisecond,complete millisecondssecond,seconds,complete second,complete secondsminute,minutes,complete minute,complete minuteshour,hours,complete hour,complete hours
Advanced Filtering Options
Filter By Another Query
With two or more tabs, one tab (query) can be used as a filter on the others. This is particularly useful to create a dynamic subset of information and then deep dive into the results on another tab.
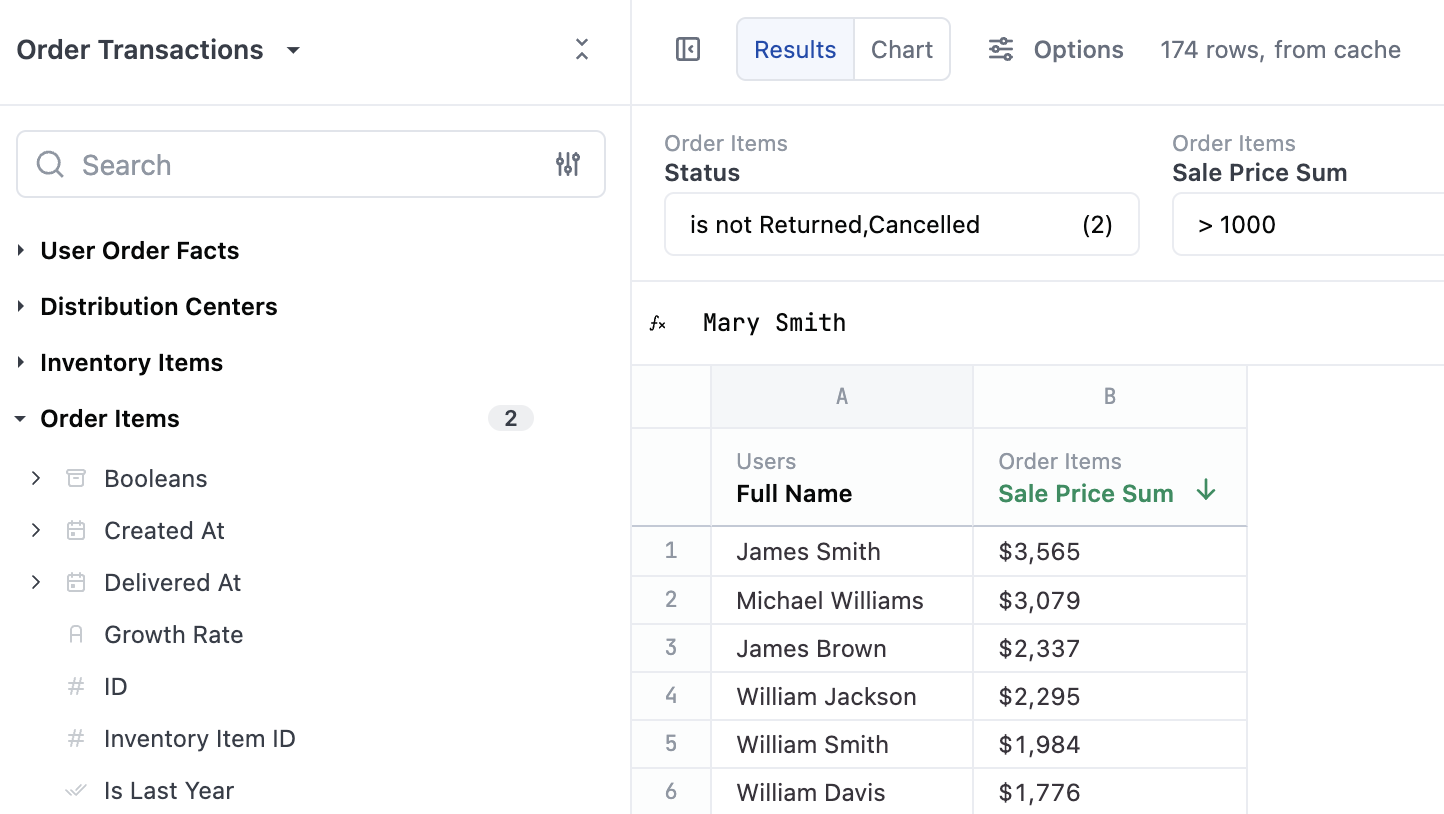
For example, using this feature to understand which brands were being purchased by your top customers. First, create a tab with your definition of a top customer.
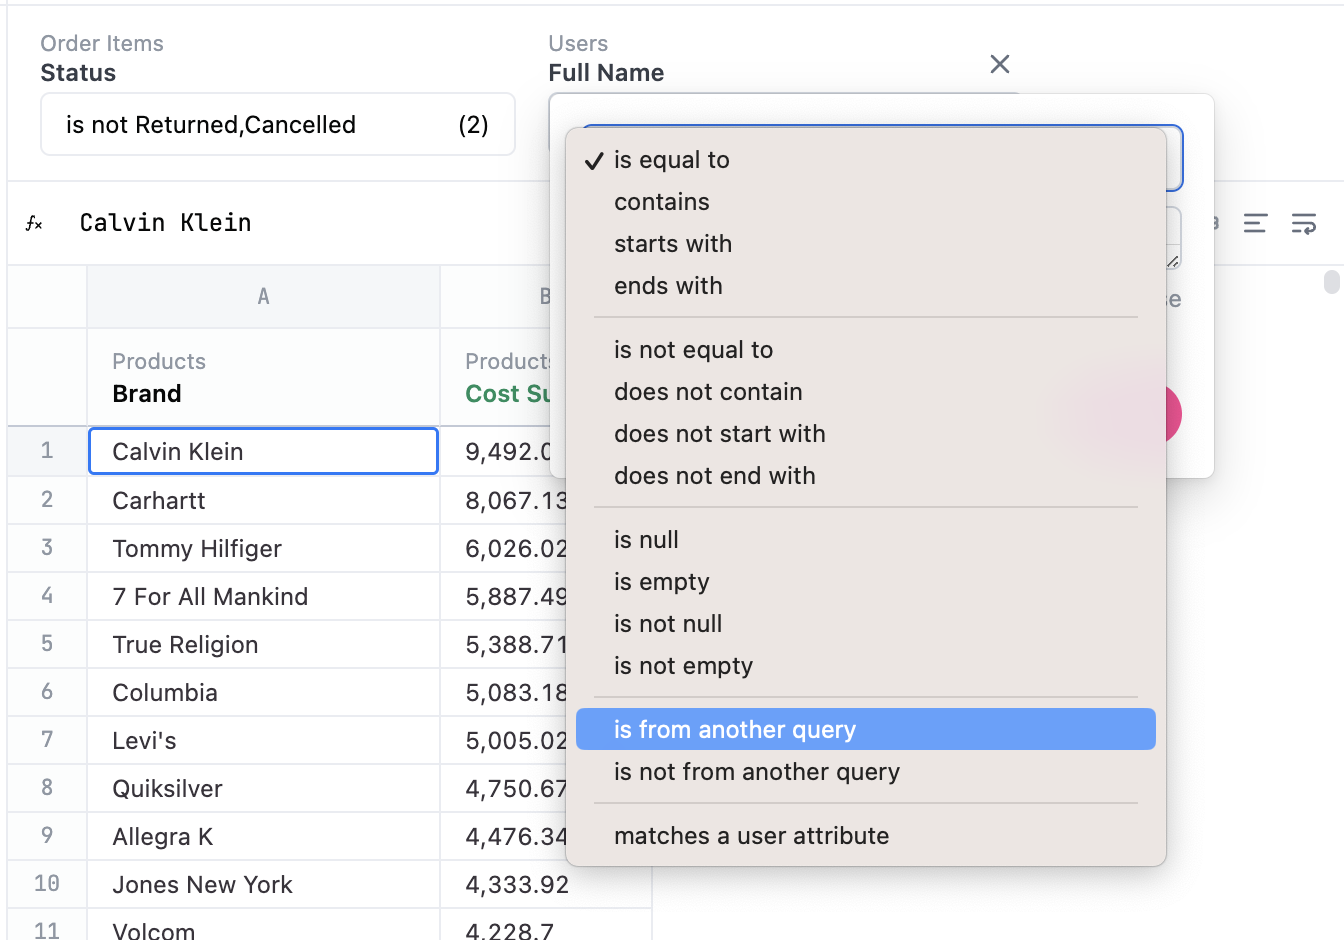
Next, open up a new tab, add the dimensions and measures that you’d like to dive into and then filter from one of the dimensions from the previous tab:
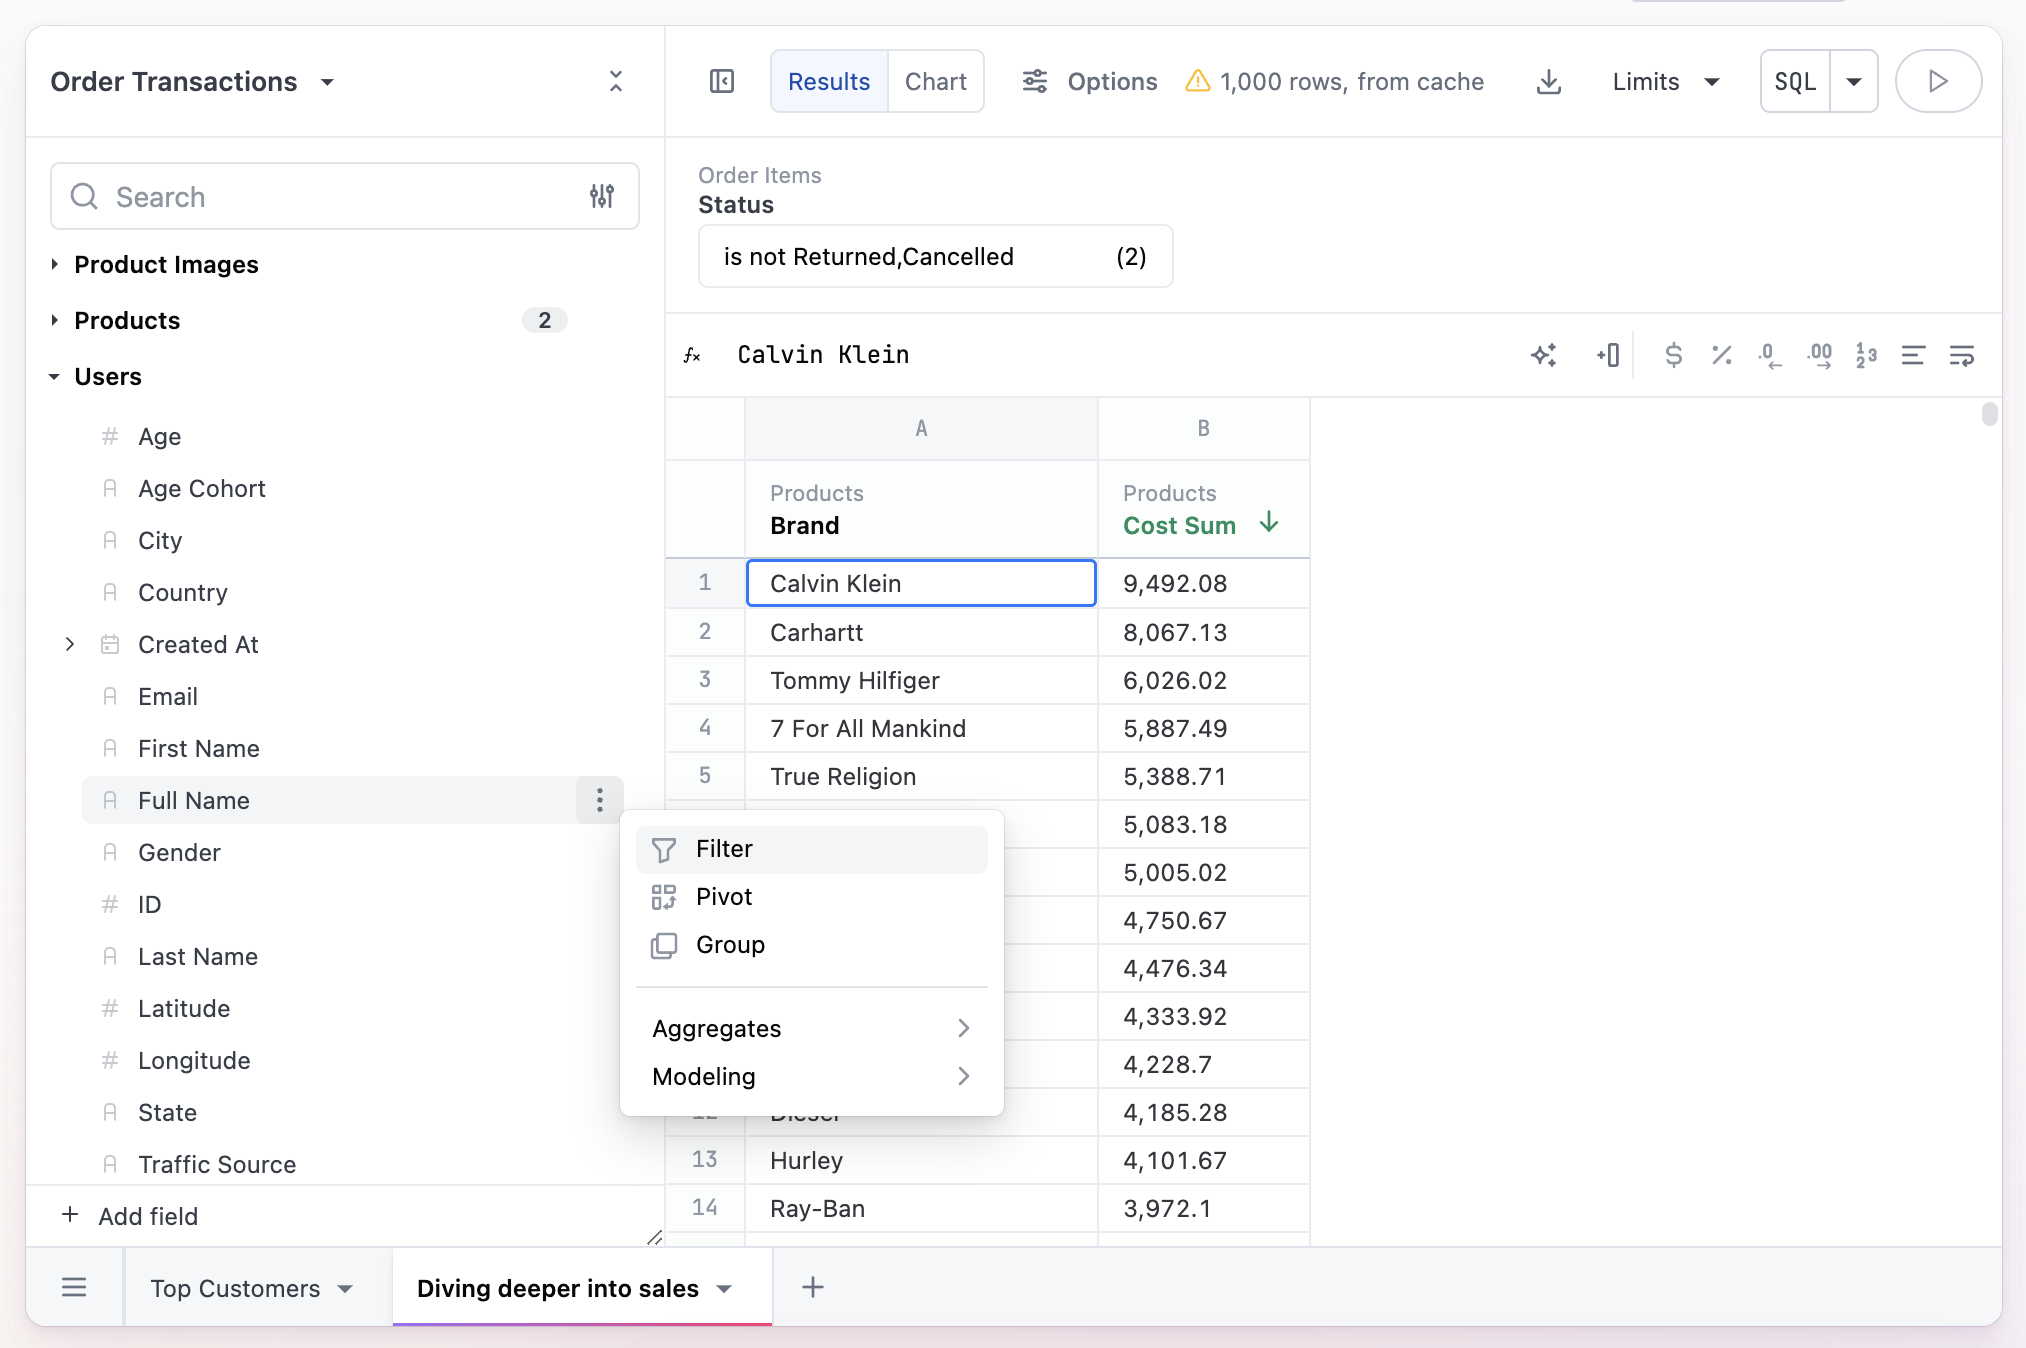
And then select “is from another query”:
Select the tab name and dimension you want to filter by:
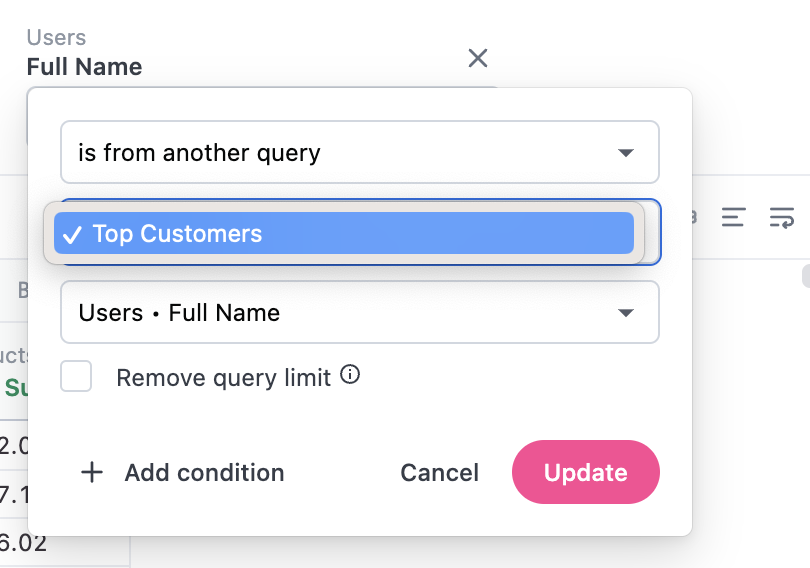
And the results will be filtered by that subset. For our SQL folks, this generates WHERE clauses that look like WHERE IN (SELECT...) where that SELECT is the filtering query.
The same concept works if you would like to filter out the data, in that case you would select the “is not from another query”.
Filter By Multiple Conditions
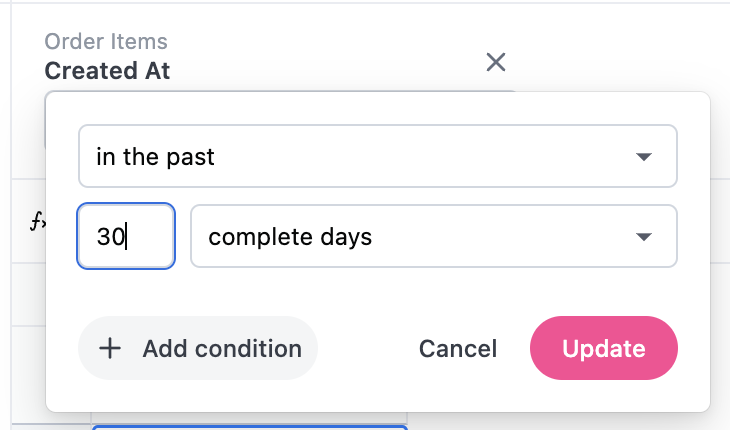
You can filter a field by multiple conditions (e.g. "Date is in the past 30 days OR date is null") by clicking "Add Condition" in the filter modal.
Refreshing Filter Suggestion Cache
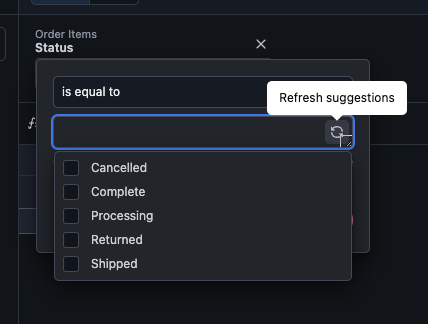
In rare circumstances, the filter suggestions may be cached in a stale state. To clear the cache on a given suggestion, hold Command + Shift on Mac or Windows + Shift on Windows, to see an option to refresh the filter suggestions from the database (see below).
Note this will only clear suggestions for the specific query in question, not all filter suggestions.
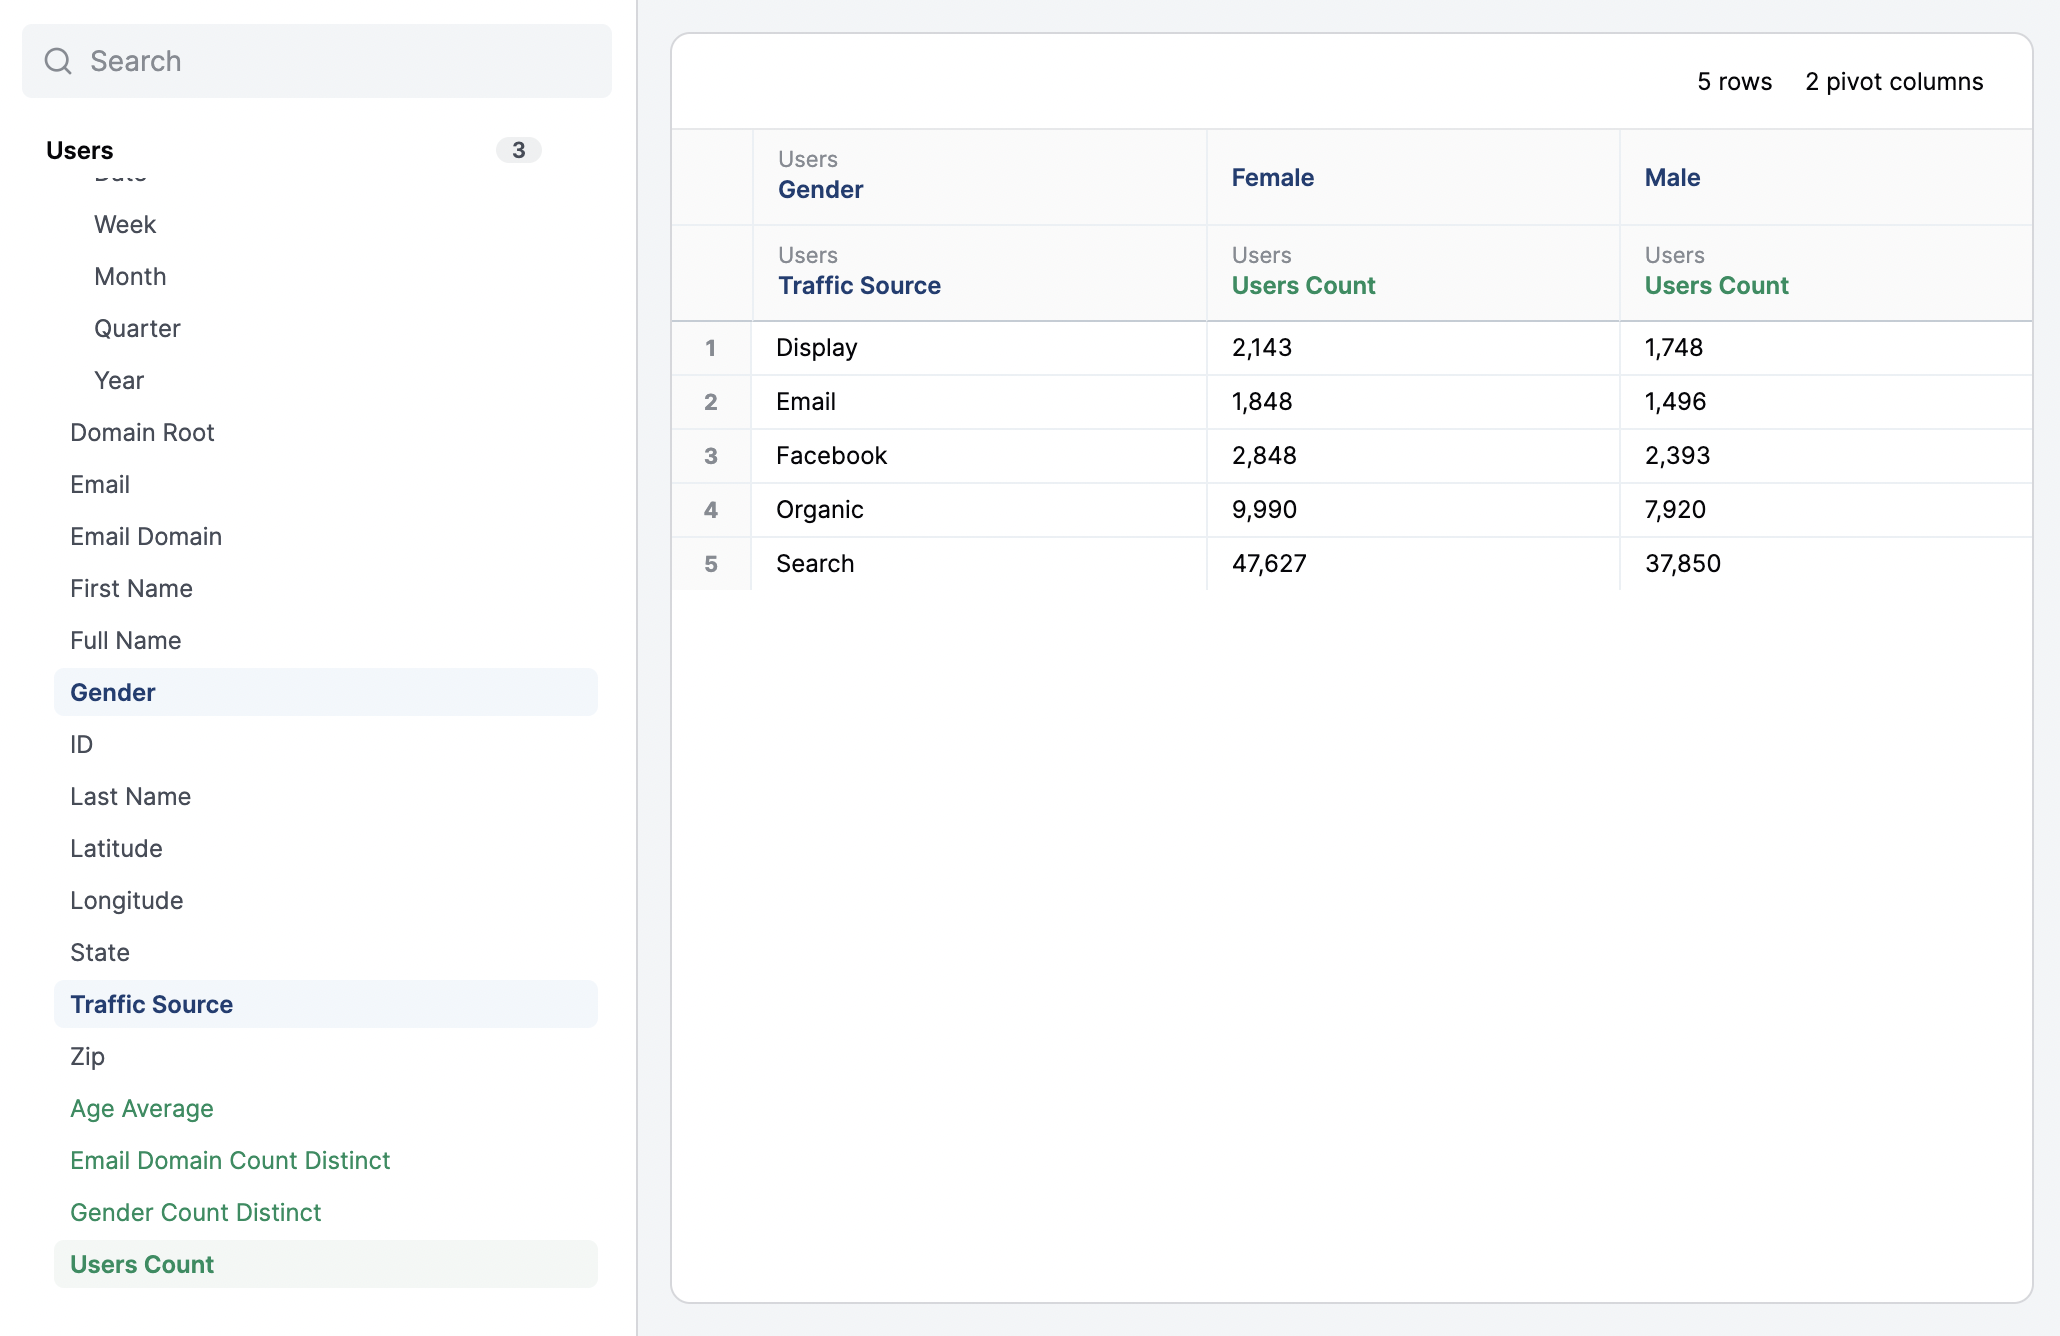
Pivoting
Quickly build pivot tables by right-clicking any field in the field picker and selecting the Pivot option.
Custom Fields
Custom fields can be created through the right click menu or via the '+' button in the field picker. See "Custom Fields" for more information.
Quick Dimensions or Measures
A selection of quick measures are provided for each field type using right click:
| Field Type | Dimensions | Measures |
|---|---|---|
| Dates |
|
|
| Strings |
|
|
| Numbers |
|
|
Other Right Click Actions
In addition to the above, there are several more menu actions:
- Information: view additional metadata on the field, including SQL, database type, descriptions, or tags
- Hide: remove field from the field picker (used for field cleanup)
- Primary Key: set given field as the primary key for the view (used in counts through joined tables)
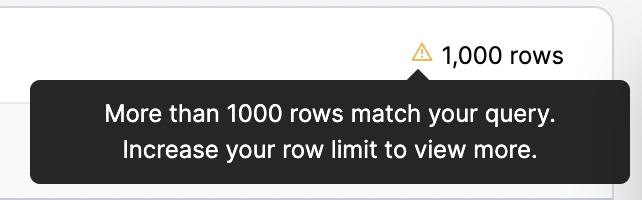
Row Limits
By default, queries will be filtered to 1000 rows of data, but the limit can be adjusted dynamically here (up to 50,000 rows). Note your browser may have limitations on the amount of data that can be shown at once, so use caution with high row limits:
Note that the row limit will not impact the rows processed, it will only limit the rows available in the front-end UI.
Column Limits / Pivot Limits
Omni currently supports any number of measures in the data table. Pivots are limited to 200 columns.
Sorting
Data in the data table can be sorted on a column by column basis, with a cycle through descending, ascending, and unsorted. For sorting over more than one field (secondary sort or double sort), simply sort the first field and hold down shift for subsequent sort actions.
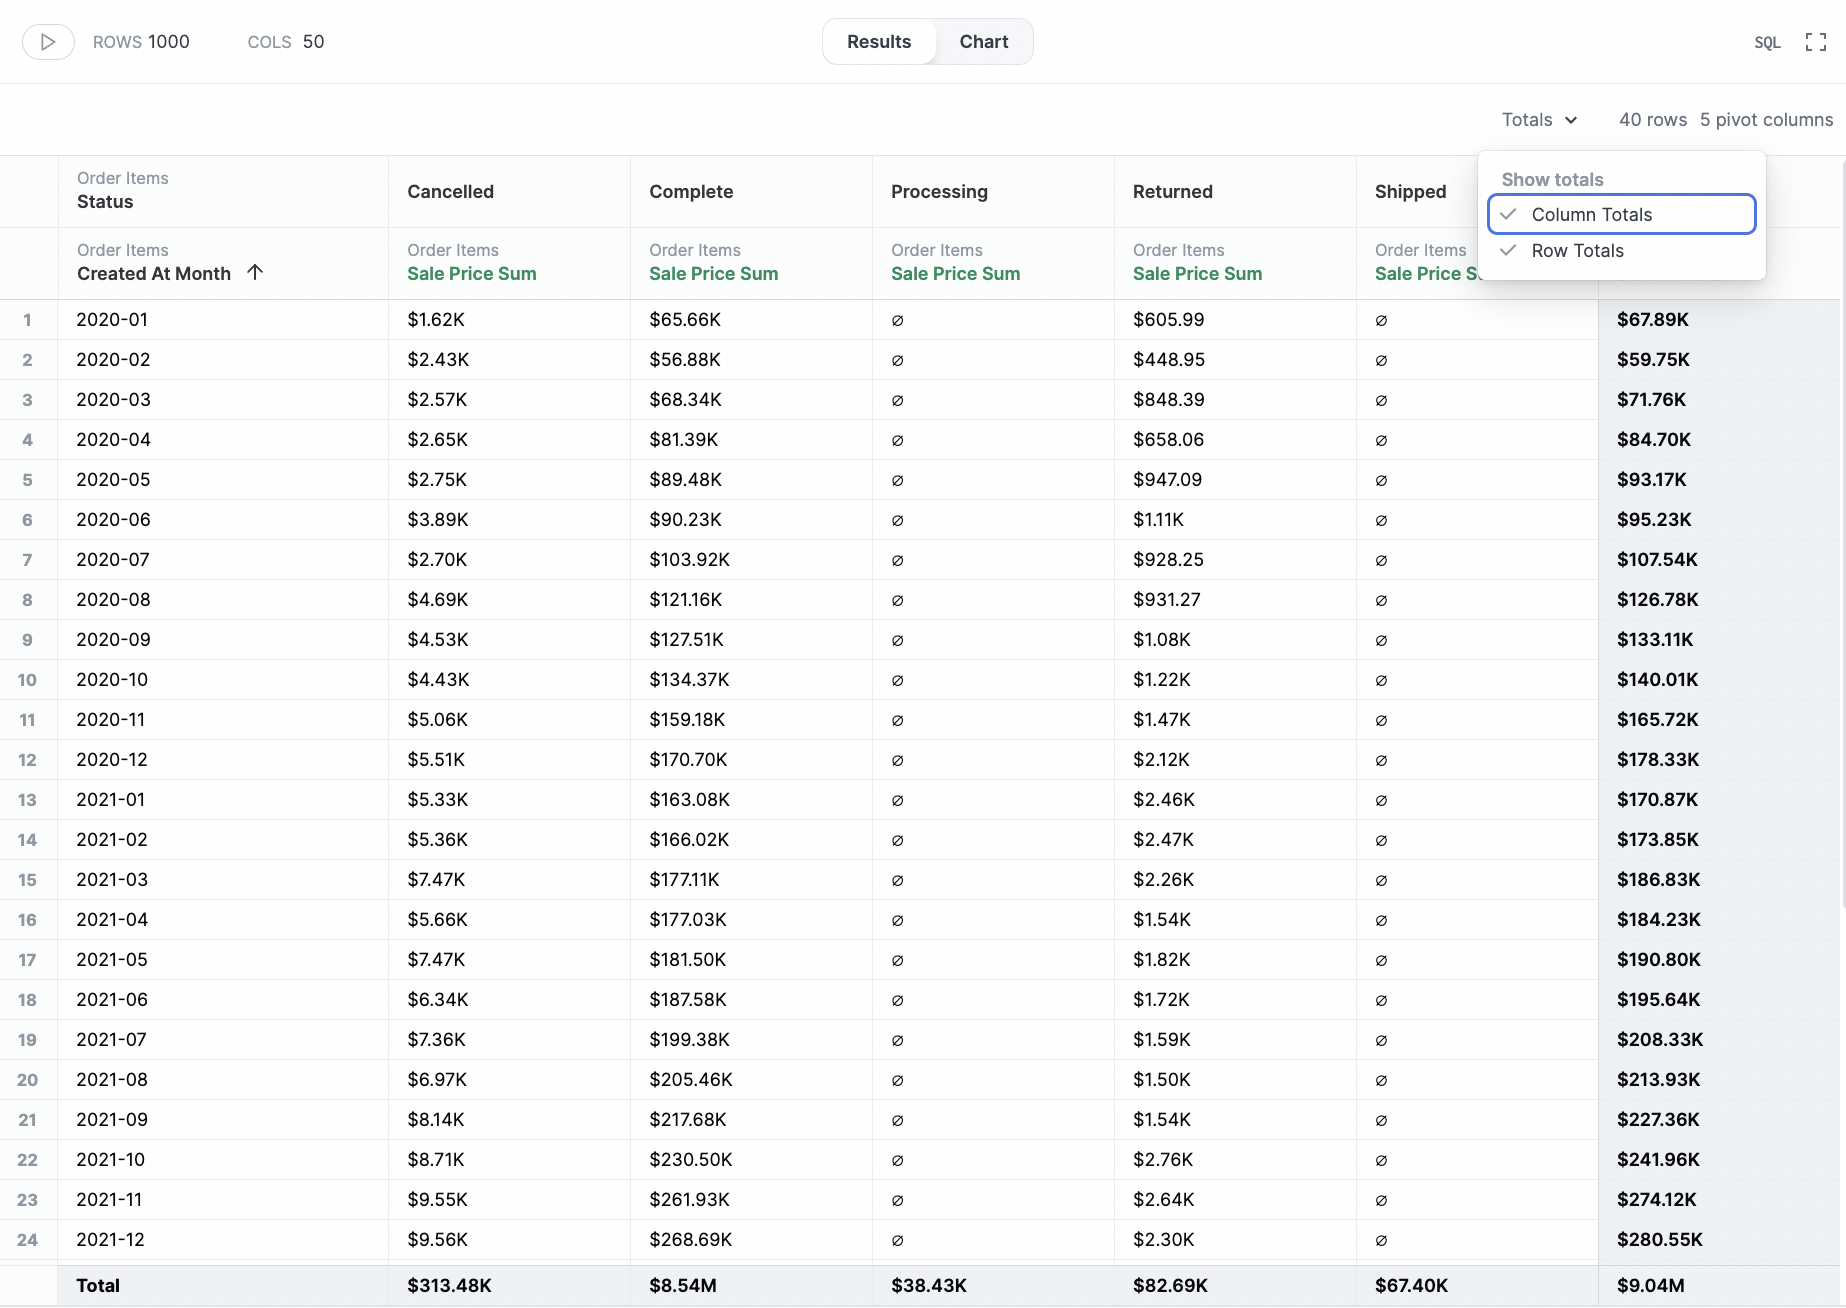
Totals
Row totals, column totals, and subtotals are available in the table's header menu. The will calculate upgrouped aggregates for a given field. This means rather than a simple sum of the values you see, they will take into account duplicate values across rows. Simple totals or other aggregates like averages may become available in the future.
Downloads
To download, use the on page menu: Tab > Download CSV or Tab > Download Excel. Downloads are currently limited to 100k rows.
Currently downloads will use formatted result sets. This will become configurable to the raw data in the future.
Removing Fields and Filters
Fields can be removed from the table either using the field picker (clicking on active fields will remove them) or right-clicking / kebab-icon-clicking in the column's table header.
All Views & Fields
Most querying will be done through curated topics in the UI, but at times, admins and developers may need access to the full database for ad hoc requests or in order to build new models. All Views & Fields allows those with access the ability to use the pivottable UI to query any table available for a given connection.
The dropdown above the search box offers two options to discover views:
- Views from modeled schemas
- Each schema in the database
The reason we offer both options is scalability in the data model - if we 'model' thousands or millions of tables in the Omni shared data model, there can be significant performance constraints in building the model and running queries. That said, for smaller schemas (hundreds of tables), you can comfortably model your entire data warehouse without performance considerations, and "View from modeled schemas" will simply reflect the entire warehouse. For customers with hundreds or thousands of schemas or tables, more curation in the data model will reduce clutter, and ad hoc needs across the warehouse can still be achieved through schema selection.
To 'model' a schema, simply touch any view in the given schema (for example, on view Users, add label: Users); this will be done through a curation process like starring in the future
For now, search will only operate inside the selected schema (or across all modeled schemas), so you may have to switch schemas to find the appropriate table if your full warehouse is not modeled. Note this UI will not override Schema Restriction, if the list of schemas has been curated. In the future, we will offer search over all schemas together in addition to schema by schema.
A Quick Example
For a customer with 2 schemas of 10 tables each, any modeling in either schema will pull the full schemas into the "Views from modeled schemas". All Views & Fields will operate as simply one big list of all your tables
For a customer with 1000 schemas of 10 tables each, likely only 5-10 schemas may be modeled (at least to start). "Views from modeled schemas" will by default curate the list of tables to those 10 schemas, but to browser alternative schemas, simply select them from the dropdown.
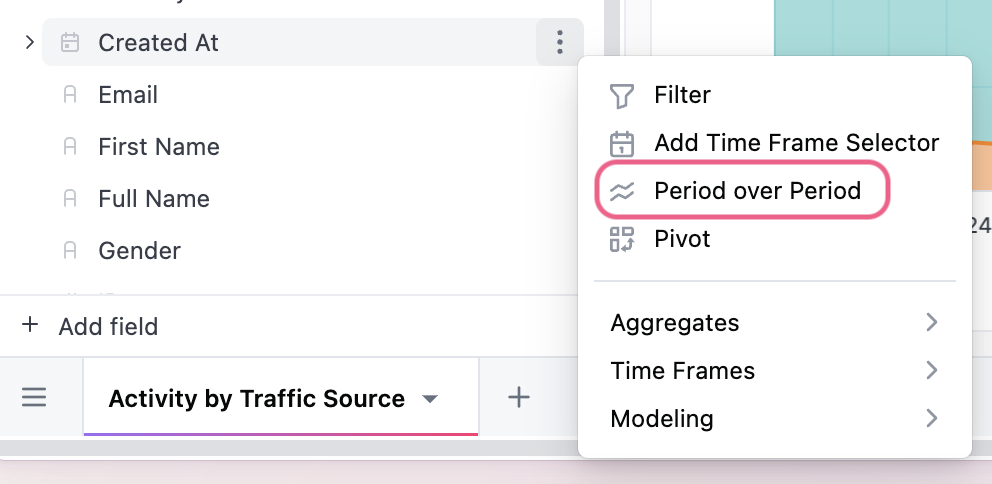
Period over Period Analysis
Period-over-period (PoP) analysis is a business intelligence technique that compares metrics in a recent period to the same period in the past.
You can seamlessly create those time periods from the field picker by selecting ”Period over Period” from the three dot menu of the date dimension you want to use.
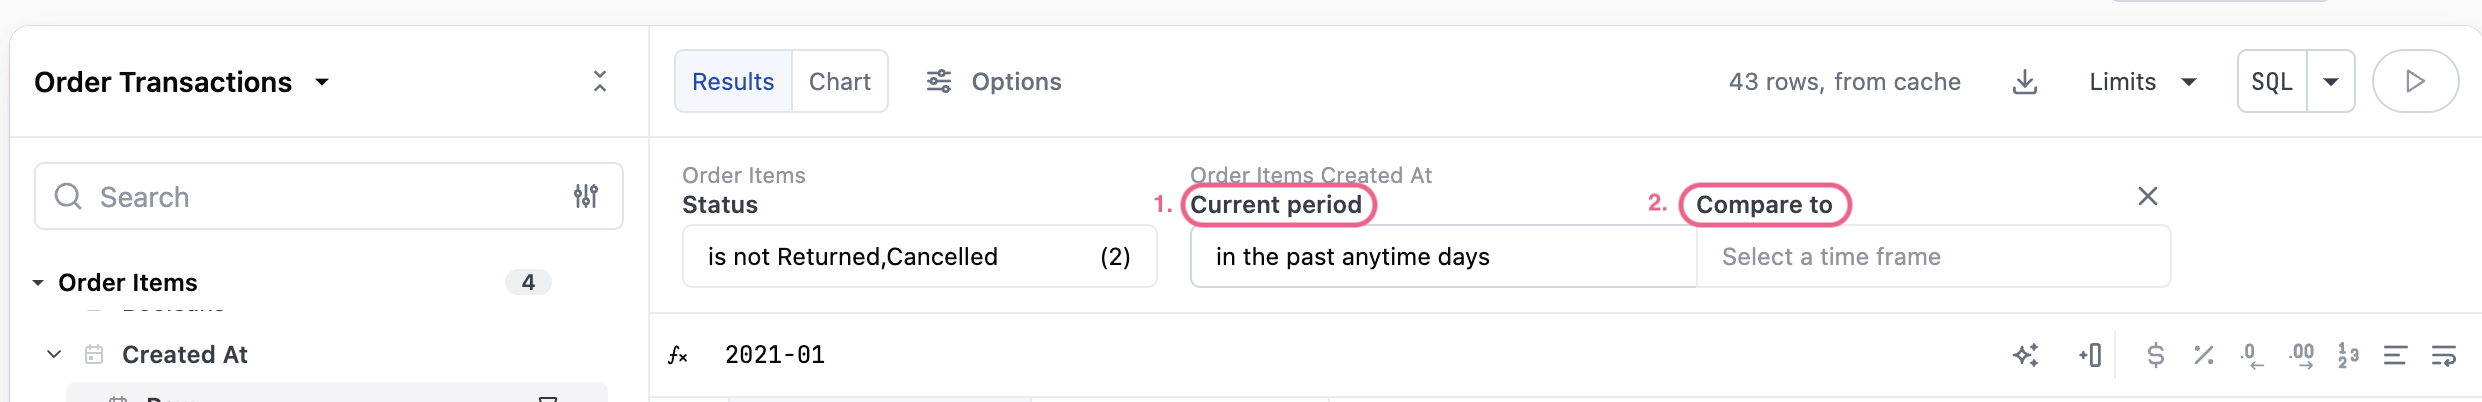
Above the results pane two drop downs will appear. In the first drop down, choose the current period and in the second drop down, the period you want to compare. The options to compare will default to relevant time frames; however you can alway customize that logic.
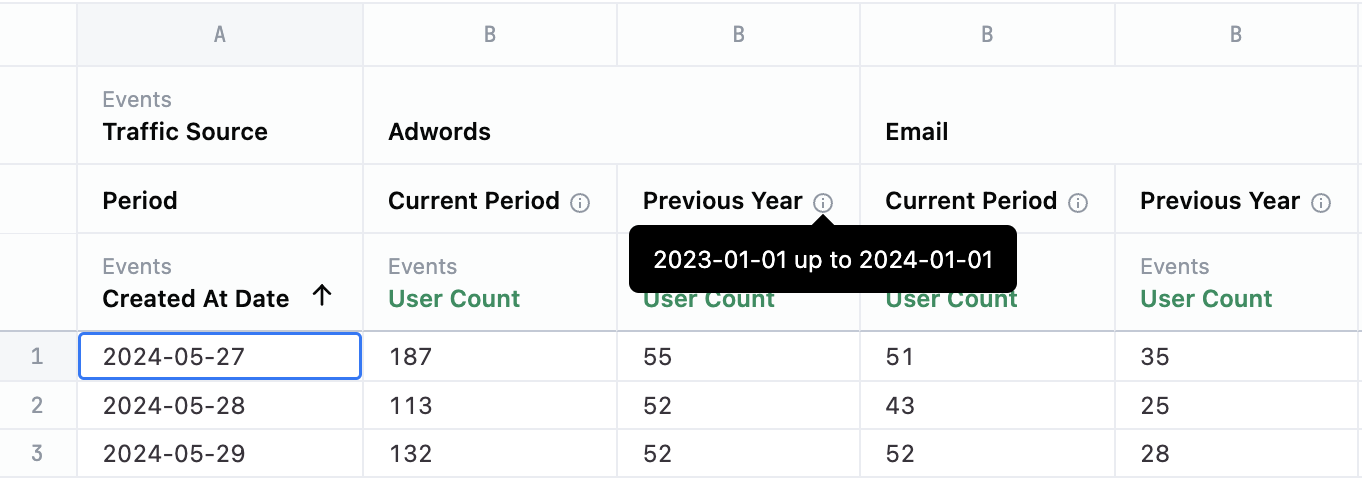
Users will be able to see more exact period parameters in the information icon on the results table.
Writing SQL
In the SQL editor, you can write any SQL specific to the database you have connected. Simply write queries in the appropriate dialect for your database and select the run (▶️) button.
Note that the field picker UI is deactivated in SQL mode. While we would like to open up mixed querying between the field picker, filters, and SQL, at the moment SQL mode does not interact with the field picker.
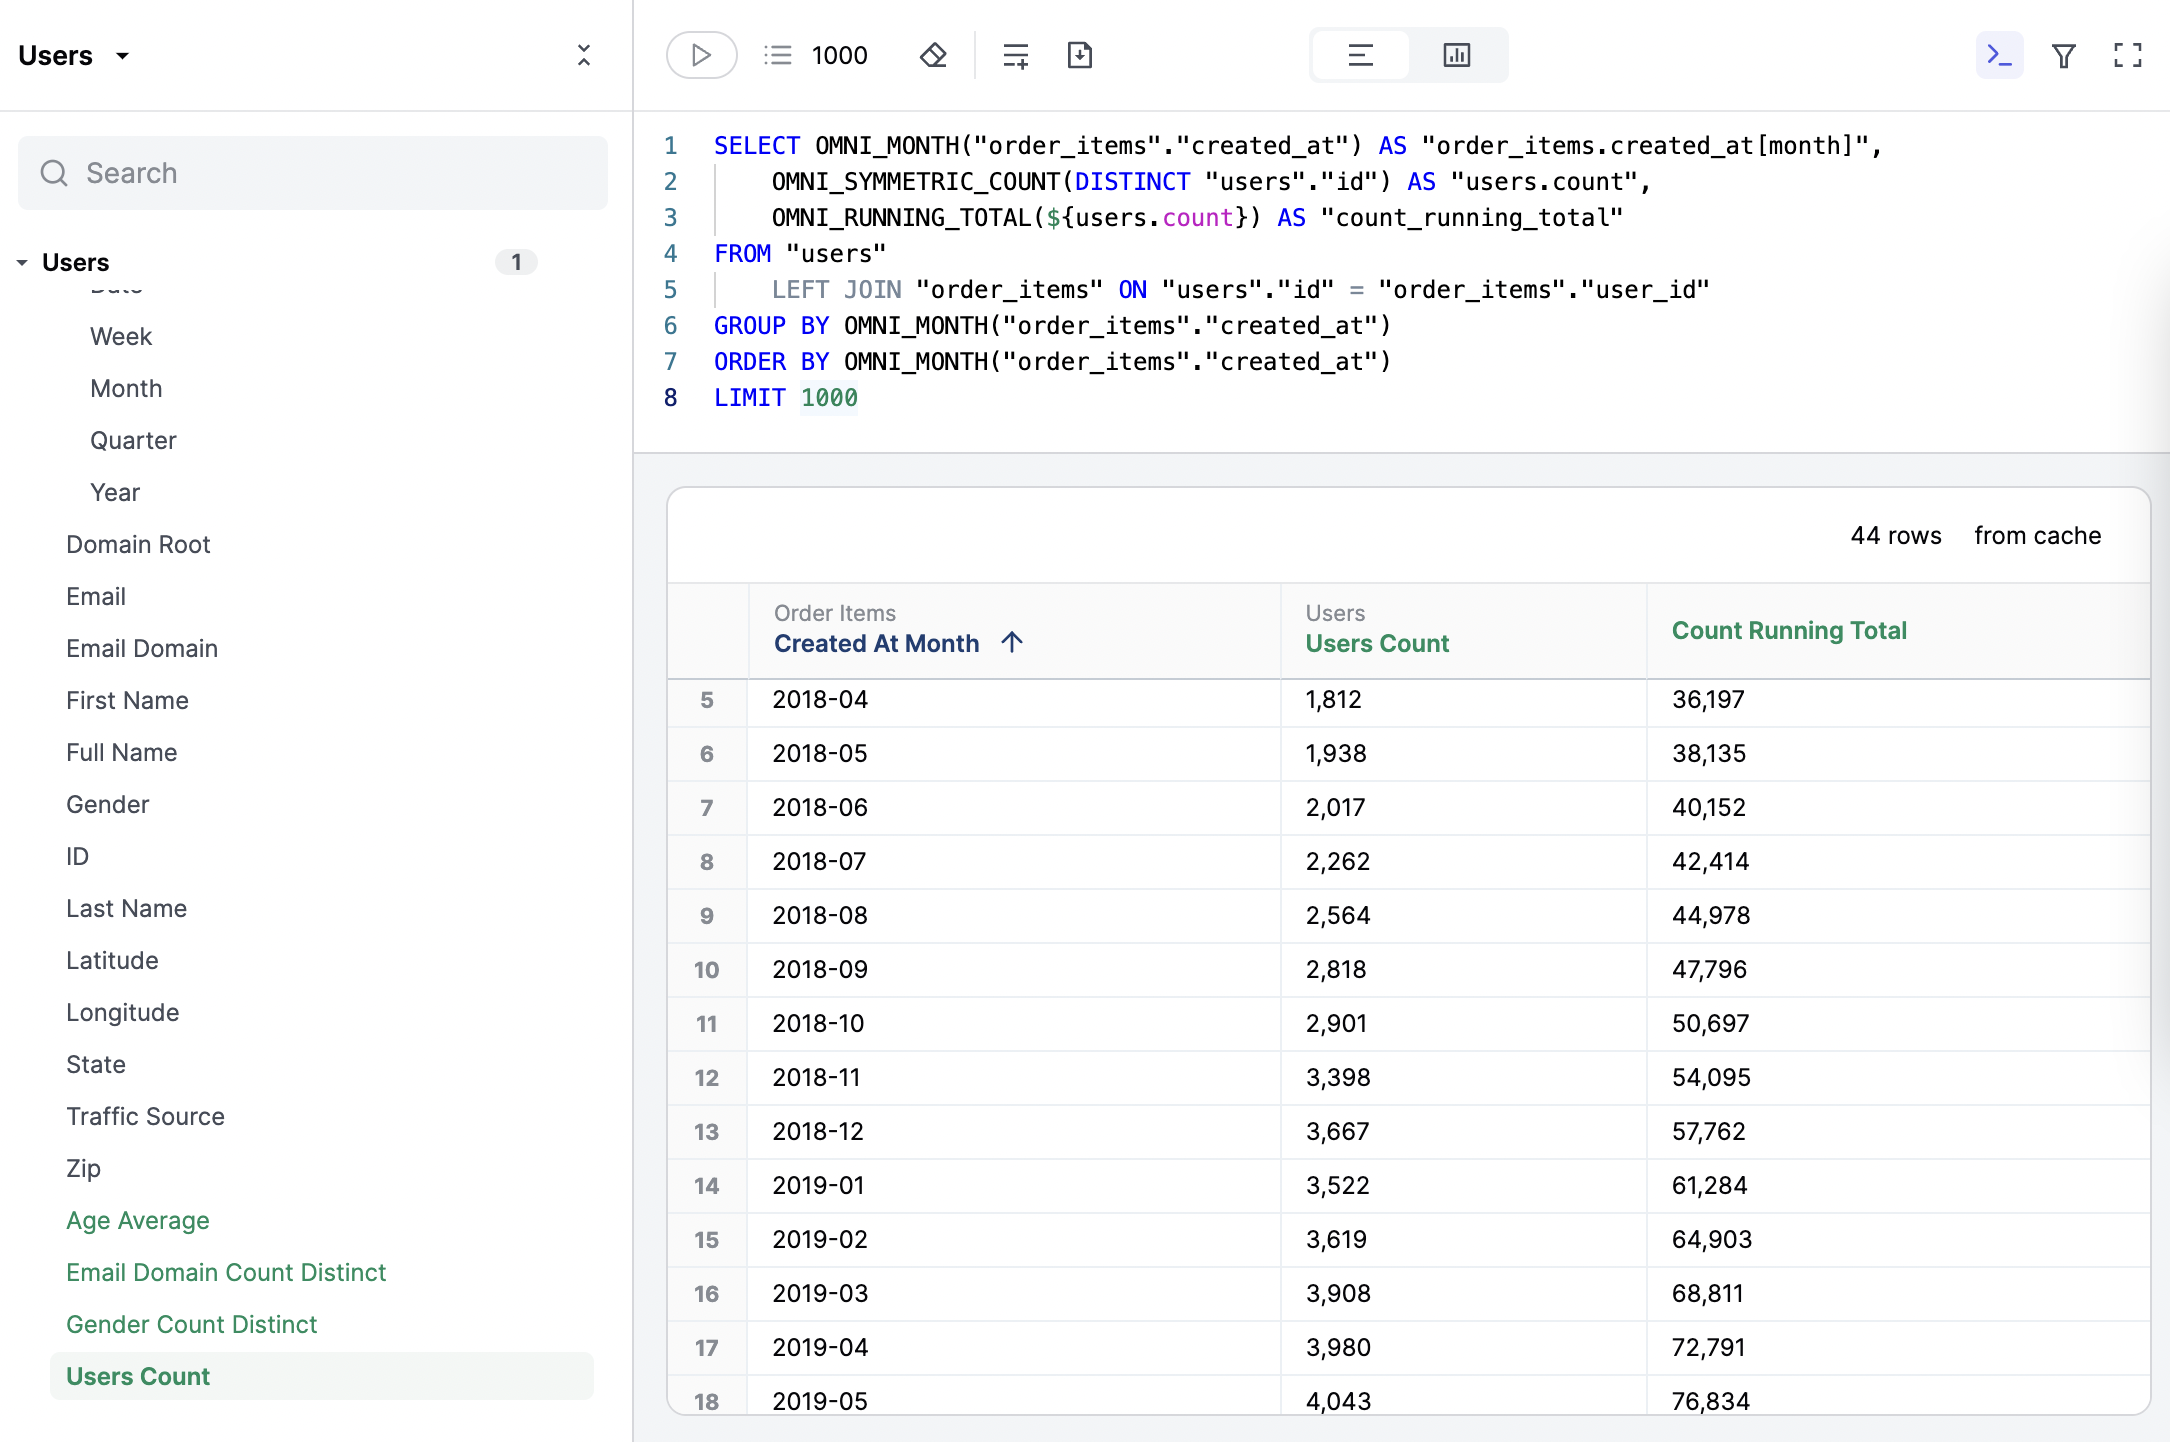
Additionally, we've added special OmniSQL operators that are intended to simplify complex syntax. OmniSQL is an abstraction on top of the dialect SQL that makes writing SQL in Omni even faster than a standard SQL editor. OmniSQL always compiles to the dialect specific SQL, which you can access by looking at Raw SQL in Omni.
You may also see OmniSQL operators pop up in the generated SQL as you manipulate data through the field picker and UI gestures.
Omni SQL operators
Omni offers a handful of accelerator functions that make writing SQL easier and faster. When you build queries through the UI, you may see these show up in the SQL editor. You can also write these directly when hand-writing SQL.
List of Omni SQL operators
Date functions:
OMNI_DATEOMNI_DATETIME_INTERVAL_ADDOMNI_DATETIME_LITERALOMNI_DATETIME_UNIT_INTERVAL_ADDOMNI_DAY_OF_MONTHOMNI_DAY_OF_QUARTEROMNI_DAY_OF_WEEKOMNI_DAY_OF_WEEK_INDEXOMNI_DAY_OF_YEAROMNI_HOUROMNI_HOUR_OF_DAYOMNI_MILLISECONDOMNI_MINUTEOMNI_MONTHOMNI_MONTH_NAMEOMNI_MONTH_NUMOMNI_QUARTEROMNI_QUARTER_OF_YEAROMNI_SECONDOMNI_WEEKOMNI_YEAR
Calculations:
OMNI_OFFSETOMNI_PERCENT_CHANGE_FROM_PREVIOUSOMNI_PERCENT_OF_PREVIOUSOMNI_PERCENT_OF_TOTALOMNI_RANKOMNI_RUNNING_PRODUCTOMNI_RUNNING_TOTAL
Filling Missing Data
Dimension Filling
Often when querying with filters, you may return a result set that does not include every possible dimensions, for example count of sales on days with zero sales. It can be valuable to return these missing dimensions for reporting.
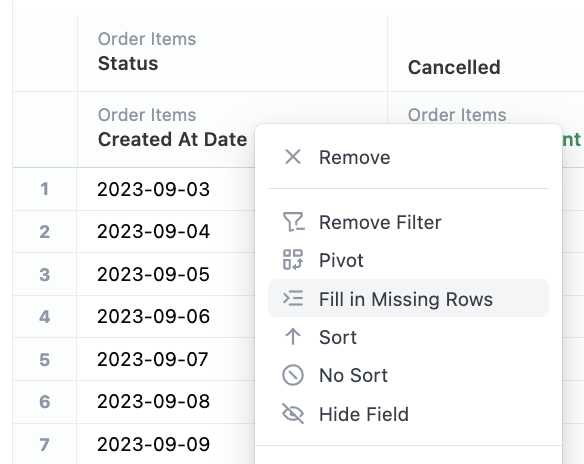
After querying a dimension that can be filled (ranged dates, lists), simply right click on the dimension and select 'Fill in Missing Rows'. Note the option may not always appear on dates when Omni does not know the start and end date. To bring the 'Fill in Missing Rows' option, simply filter the date over a clear time period (ie. 2023-01-01 to 2023-02-01), which Omni will then fill in rows for.
In addition to dates, Omni can fill in missing values for enumeration fields - for now, just bins and groups defined in the data model. This may expand over time.
Note that fill is capped at 8000 values, for more complex use cases, direct SQL is recommended.
Pivoted Table Filling
In addition to filling dimensions, it's often valuable to fill a pivoted table that contains nulls for 'more correct' reporting of aggregates. To replace nulls with 0s in the pivottable, simply select "Fill in Missing Cells in Grid" on a pivoted report:
Joining Tables
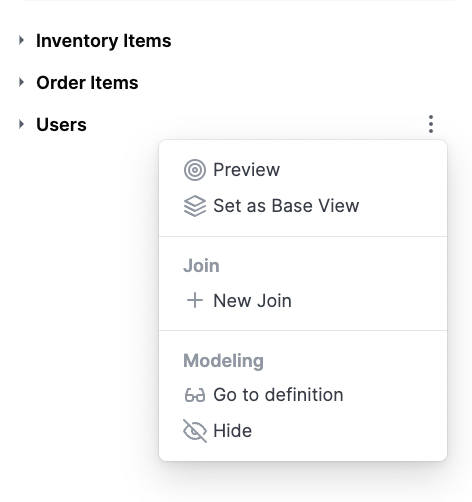
At times, you may need to join tables in a workbook for richer analysis. To join tables in the workbook, open the Join model from the action menu on any view:
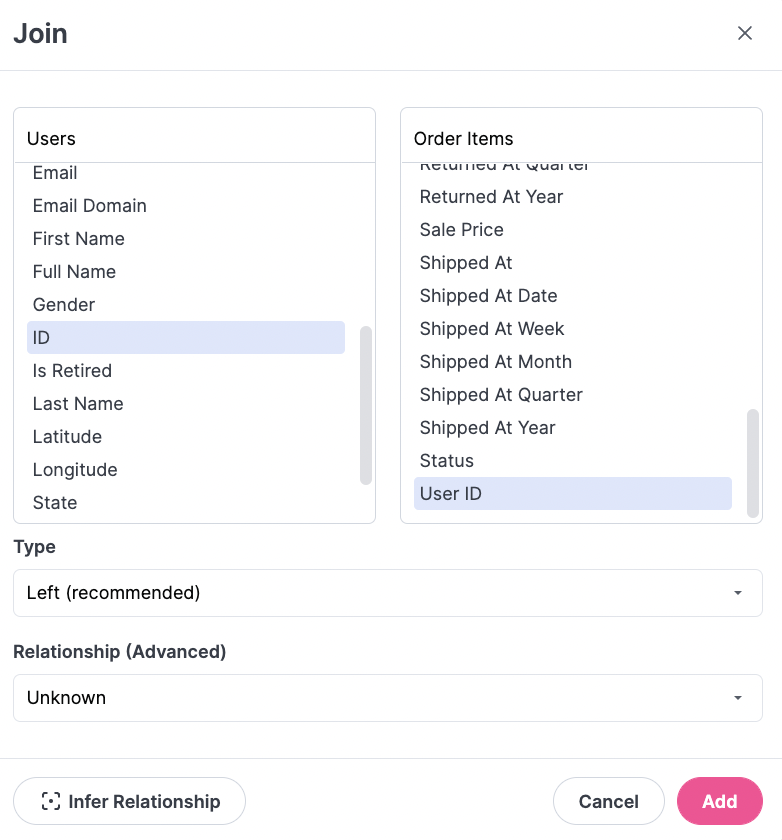
There are three core pieces to configure joins: table and field selection, join type, and relationship:
Adding Joins to a Topic
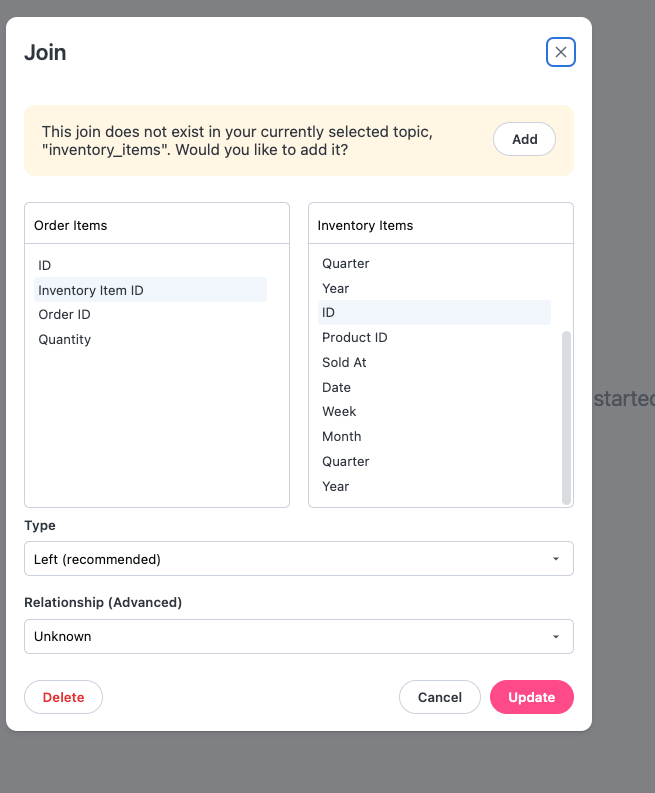
For existing joins that are not available in a topic, users will be prompted whether they want to add said join to the active topic.
Join Table and Field Selection
Simply select the table and corresponding fields to join. Right now compound joins or complex logic is not available in the UI, and must be configured in the model interface. Clicking in the table dropdown will also present a search option if there are many tables in the data warehouse.
Join Type
Omni offers LEFT, RIGHT, INNER, FULL OUTER, and CROSS joins in the UI.
Join Relationship
Join relationships are used to ensure correctness of counts when joins may fan the result set (ie joining many orders to a query about users and counting users). If you know the relationship between your tables, you can select via dropdown. Options include Many to one, One to many, One to one, and Many to many. It is generally recommended to use Many to one joins rather than One to many joins.
For users that may struggle with choosing the correct relationship, when relationship is set to Unknown, the Infer Relationship button will become active. This will examine the cardinality between each join key and select the proper relationship. We recommended using the button, as often uniqueness may not match expectation and this can flag potential data issues like duplicated rows or keys.
Adding Controls
Controls allow a user to swap out one field for another on a query making it more dynamic. There are three main types of controls:
- Time
- Field
- Parent
Time Controls
These controls will allow you to swap the time frame within the underlying query. This provides an easy UI based mechanism to swap from daily to weekly to monthly and back again, all without any underlying work needing to be done to facilitate it from an administrative perspective. A time frame control can be added from either the field picker or from the date field in the results table by choosing Add Time Frame Selector from the three dot menu.
Field
In order to create a control for dimensions or measures, first add one to the query and switch to the Results view. From there, select the three dot menu on the column and Add field selector. A control will appear above the table with a three dot menu for a user to edit the control (change the label, add additional fields, or add a parent control).
Once there are two or more options in the control, a user can select the field they want represented in the table or visualization and dynamically toggle among the options.
Parent Controls
These controls will allow you to coordinate the toggling of multiple controls at once from a single point and click UI. From any existing control, select the option Add parent control. A control will appear above the table, select the three dot menu to edit the control. First add options that will appear in the drop down, then assign the child controls that will be chosen based on the option selected in the parent control.
Controls created in the workbook will not appear on the dashboard. Read more about how to add controls on the dashboard level here.