Set Up Omni
Are you setting up your Omni app for your organization? Follow this guide to learn how to connect to your database, query your data, and promote your data to the shared model.
This guide is designed to walk through how to set up your new Omni app as an Admin user. We'll get you and your team started with a strong foundation 💪 so maintaining your environment in the future is a breeze. We recommend taking these steps when getting started with Omni:
- Connect Omni to your data
- Query your data
- Save resuable data to your semantic model
1. Connect Omni to your data
If you’re the first user to log into Omni, things will probably be pretty barren. That’s a-ok, all great artists have to start from a blank canvas! 🧑🎨
In order to query your data, first, you need to connect Omni to your database. This should be easy-peasy as long as you have the database permissions to create users and/or roles on your database and are an admin in your Omni app. You'll need credentials from your database to plug into Omni to get your data connected!
- Video Tutorial
- Step-by-Step Guide
- Navigate to your Omni app's page, usually something like
your_company_name.omniapp.co. - Click on Admin in the header menu, then find the Connections option in the left-hand panel.
- Follow our database connection docs and follow the instructions for your specific data setup.
2. Build a query
Now that you have made a successful connection to your data, let's get to the fun part of using Omni - querying your data!
For quick reference, here's a simple diagram outlining the different pieces of an Omni workbook that will be referenced throughout this guide:
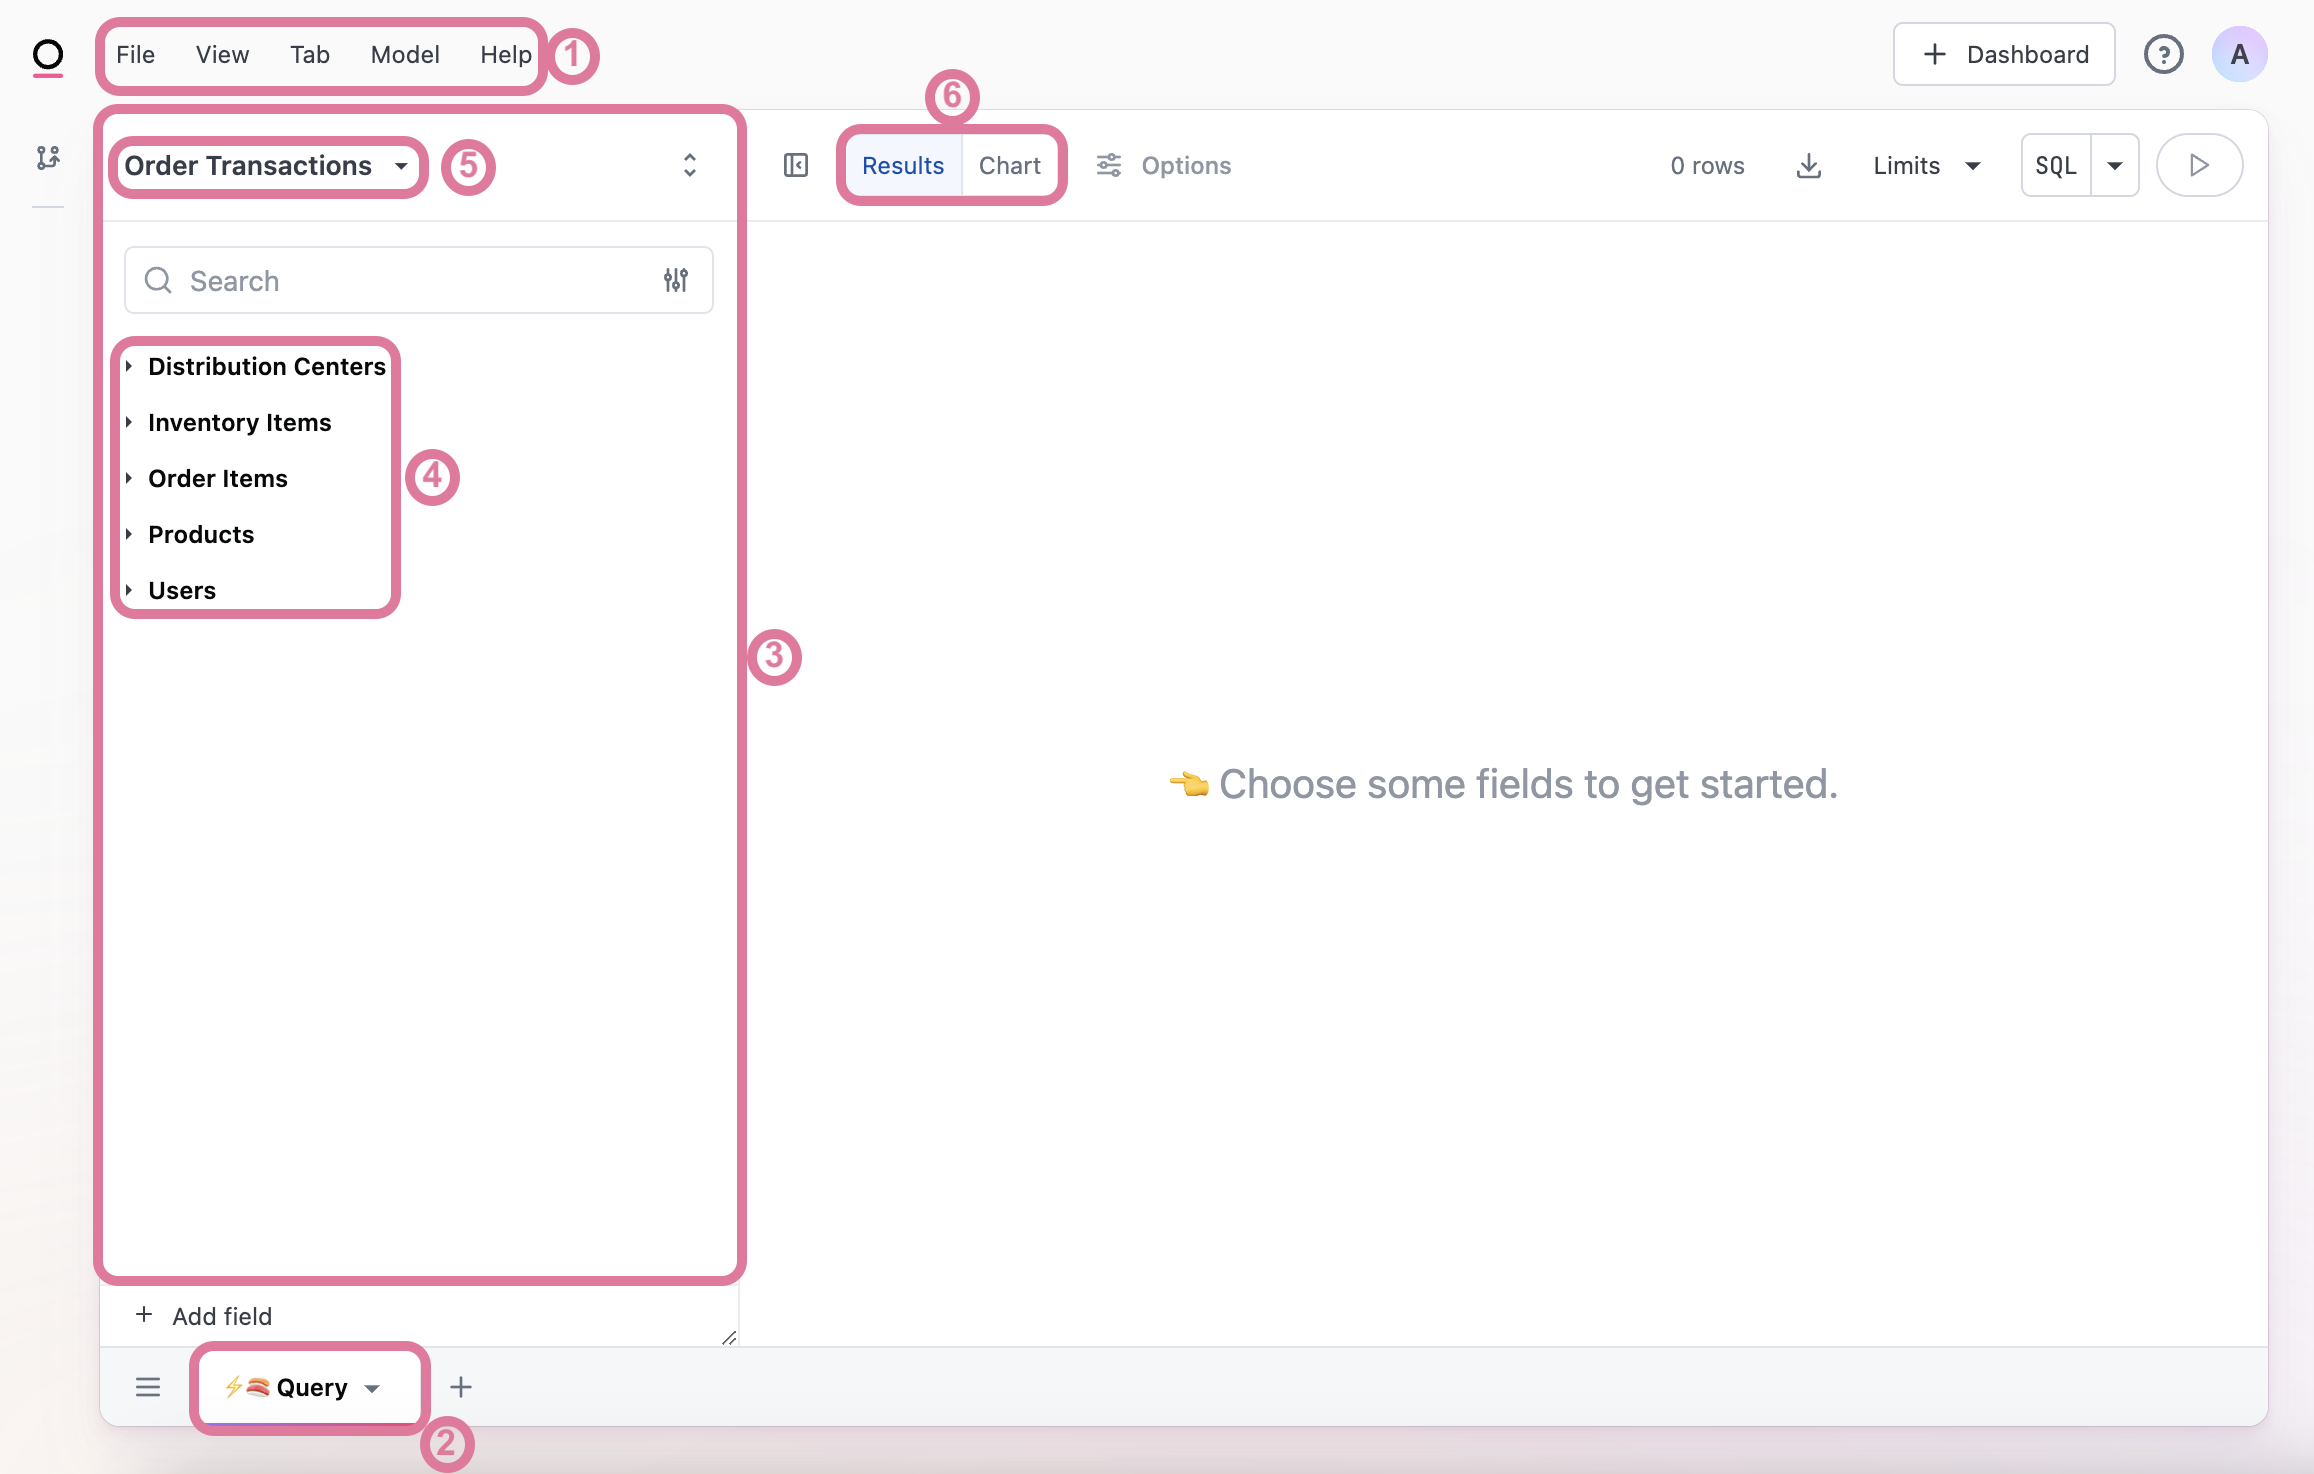
- Menu settings, options and shortcuts
- Query tab
- Field picker
- Views (schema tables)
- Toggle to see other topics or all views and fields in the schema
- Toggle between query results table and visualization charts
a. Navigate to a new workbook
- Navigate to your Omni app's homepage:
your_company_name.omniapp.co - Click on the
** + New **button in the top left corner of your Omni app's homepage. - If you have more than one database connection set up, select the database connection you want to use. (If you don’t see any options here, head back to the set up steps to connect your data to Omni.)
- Click the Schema button and choose the database schema you want to start working with.
- From here you can expand the different schema tables and find the one you’d like to start with (we’ll show you how to add joins below).
b. Select your fields
Start building your query but selecting any desired fields from the field-picker menu. Beyond selecting existing fields, you have further options to customize your query outlined in the next sections of this tutorial.
c. Add a query filter (optional)
Add filters to your query to downsize the query size or target the specific data you're looking for.
i. Use a field in the query
- In the results tab of the workbook, hover over the field column header, click on the drop-down menu that appears and choose Filter.
- Set your filter conditions and value, then hit update and your query will now reflect results based on the filter set.
ii. Use a Field Outside of the Query
- In the workbook field picker (left-hand panel), hover over the field you want to filter on, select the three-dot menu and choose filter from the drop-down menu.
- Set your filter conditions and value, then hit update and your query will now reflect results based on the filter set.
d. Add a quick aggregation (optional)
Quick aggregations allow you to create new aggregation fields quickly, without writing any SQL or developing in the modeling layer. The aggregation options shown for a particular field are dependent on the field type – for example, you’ll see different options if your field is a string vs number. Learn more about the quick aggregations available by field type.
- Video Tutorial
- Step-by-Step Guide
- Go to your desired field's menu, either from the field column header or from the field in the topic field menu, click on the vertical three-dot icon and select Aggregates
- Choose the aggregation that best suits your needs.
e. Add Excel Calculations (optional)
These are a quick way to add calculated fields – think basic math, rolling sums, string functions, date diffs – directly from the table (your finance teams may fall in love with this feature, don't say we didn't warn you!). For common calculations, Omni offers table calculations directly from a field's column-header menu as well as the ability to create custom calculations.
Note, the field you reference in your table calculation must be included in the query results.
i. Quick add calculations
- Video Tutorial
- Step-by-Step Guide
- From the results tab in the workbook, hover over the field's column header, click on the three-dot menu that appears on the right side, and select the Calculations option.
- Click on the quick-add calculation you need and add it will be added to your results table.
- Voilà ✨ you added a table calculation!
ii. Add a custom calculation
- Demo
- Step-by-Step Guide
- From the results tab in the workbook, hover over the field's column header, click on the three-dot menu that appears on the right side, and select the Insert Column Left or Insert Column Right option.
- (Alternative) Go to the function bar and click on the icon of a plus sign and a vertical rectangle, to the right of the ✨ icon. Note, this icon will only add a column to the right of the currently selected column.
- Use Omni's excel-style functions to create a calculation.
- Caveats:
- Fields referenced in the calculation must already be included in the query.
- The calculations created will only be available in this particular workbook, they must be promoted to the Shared Model to be able to reuse them.
- Promote them by heading to that calculation's field menu.
- Ta-da! You just created a custom excel-style calculation 👏
f. Create a custom field (optional)
Custom fields allow you to reference existing fields within your topic and create a new field. For example, if you have first and last name fields in a user table, but you want a full name field instead, you can create that using a custom field. These fields can then be promoted to your model for other users to use when they navigate to this topic to explore data.
- Video Tutorial
- Step-by-Step Guide
- Click on the + Add Field button at the bottom of the field picker menu.
- Give your new field a name.
- Write SQL
- Notes:
- The underlying syntax will be the same as your data warehouse.
- This SQL logic is inputted into the
SELECTstatement of your query when this field is in a query. Keep in mind, supported logic is database dialect dependent. Using window functions may not yield the expected results. - You can reference other fields using ${view.fieldname}.
- :::tip Hint, you can copy the field reference from any field. :::
- Optionally add a field description and/or a group label as desired.
3. Add a join
Use fields from other tables in your chosen database schema by joining additional tables.
- Video Tutorial
- Step-by-Step Guide
- Navigate back to the workbook view by clicking on the Omni icon in the top left-corner of the Omni app.
- Select the + New button and choose your connection to get back to the workbook view.
- Hover over the view name and once the three-dot menu appears, in the drop-down menu, hover over the Joins menu option and click on + New Join.
- Walk through the field inputs in the pop-up modal to create a new join.
This method is only recommended for joins requiring one join condition in the
ONclause.
- Choose the view to join from the Choose right view drop-down.
- Click on the fields you want to join on. Recommend choosing a field like a unique ID.
- The default join type is a Left join but other join types like inner, full outer and cross joins are also available.
- In the Relationship (Advanced) field can you can click on the Infer Relationship button in the bottom left of the modal. This will populate the assumed relationship into this field. Alternatively, if you know your join relationship choose one of the options from the drop-down.
- In this tutorial, we recommend only adding joins to your current topic. In future joins, use the Add to all possible topics option with caution. there may be scenarios where this could expose data to users that you may not want to see.
- Click Add in the bottom right and voilà! You have now added your first join. You can now add more joins, though we recommend being mindful about how many views you join in to keep query performance quick and your workbook uncluttered.
- Once you've added all of your desired joins, we recommend promoting your changes.
4. Create a topic
A topic is a collection of tables, fields, and joins that are pre-modeled and defined to enable quick exploration of that collection of data. Topics are especially useful for organizing your data and creating self-service for users.
- Video Tutorial
- Step-by-Step Guide
- In your field picker, to the right of each view, hover over the view name and a magical three-dot menu will appear. Click on that menu, then expand the Modeling menu and choose Make Topic.
- You have now successfully created your first topic! 🎊
- Navigate to your new topic by clicking the
All Views And Fields ▼in the top left of the field picker and select on the topic (by default named the same as the view (table) you created the topic from). - If the joins you need are not included in the topic by default...
- Click on the three dots next to the table you want to join from.
- Click
Joins, click+ New Joinand follow the Join modal that pops up. For more detailed instructions, follow the Add a Join to your Query tutorial above.
5. Build a visualization
We've been mainly working in the Results tab of the workbook but now let's navigate to the Chart tab to select a visualization for our first query. The default visualization shown is based on the data in the query.
- Video Tutorial
- Step-by-Step-Guide
- To modify the chart type, click on the
Optionsbutton next to theChartbutton. - Choose from any of the default chart options that may best suit the data in your query.
- If you want to add more visualizations in this workbook, click on the
+button next to the "⚡🍣 Query" tab at the bottom of the workbook.
6. Promote your changes to the semantic model layer
Right now, the work you have done (e.g. creating calculations, custom fields, adding join(s), creating topic(s)) only exists in the context of this workbook. This is what we call the workbook layer. If you want to make this logic usable for other users building documents (workbooks or dashboards), we recommend promoting these workbook changes to the semantic model layer. There are two options for promoting your changes to the model layer: promote all changes at once or incrementally promote specific changes.Learn more about shared model promotion in our model management documentation.
- Video Tutorial
- Step-by-Step-Guide
- Click on the “Model Changes” icon on the far left (should be a pink dot next to it). This will show you all the changes you made in this workbook layer.
- Click the “Promote to Shared” pink button at the bottom to promote all changes or alternatively enter branch mode to select which changes you want to promote.
- Tips:
- To see the underlying code that will get promoted, click on the
Go to IDEbutton. You can also navigate to the workbook's Model menu option and selectEdit Model>Workbookoption from the drop-down menu. - Clicking on Combined > Model will show you just the code you added
- If you don’t want to promote everything now, you can click the blue check boxes next to the change to select/deselect items to promote.
- To see the underlying code that will get promoted, click on the
Note, you must be in a branch, to partially promote the changes. To promote all changes you can do that from this modal with all changes selected promotion or from the workbook's model menu. Learn more about branch mode to promote changes in a workbook.
7. Create a dashboard
Now that you have created your first query and customized your workbook, you can add that query to a dashboard. Your dashboard will be tied to the workbook you were working in. Any changes you make in the workbook the dashboard is based on will be reflected on the dashbaord once saved.
- Video Tutorial
- Step-by-Step-Guide
- We recommend renaming your query by clicking the ▼ arrow next to the "Query" tab at the bottom of the workbook. This name will be the title of the visualization on your dashboard.
- Once you have the visualization all set, click on
+ Dashboard. - Give your new dashboard a name and decide if you will save it to your "Personal" or "Shared" folder.
- Click on
Save & create dashboard - Now you can customize your dashboard.
- Add dashboard filters
- Create markdown tiles (click the
Add Textbutton) - Modify dashboard settings
- Schedule this content to your email or Slack integration
- Download content