> ## Documentation Index
> Fetch the complete documentation index at: https://docs.omni.co/llms.txt
> Use this file to discover all available pages before exploring further.
# Configuring table field display options
> Customize how individual fields appear in a table visualization, including as images, links, Markdown, or bars.
In a [table visualization](/visualize-present/visualizations/types/table), you can control how each field is displayed using the options in the field's **Display** tab. To open it, click the icon on a field in the visualization's **Options** panel, then open the **Display** tab.
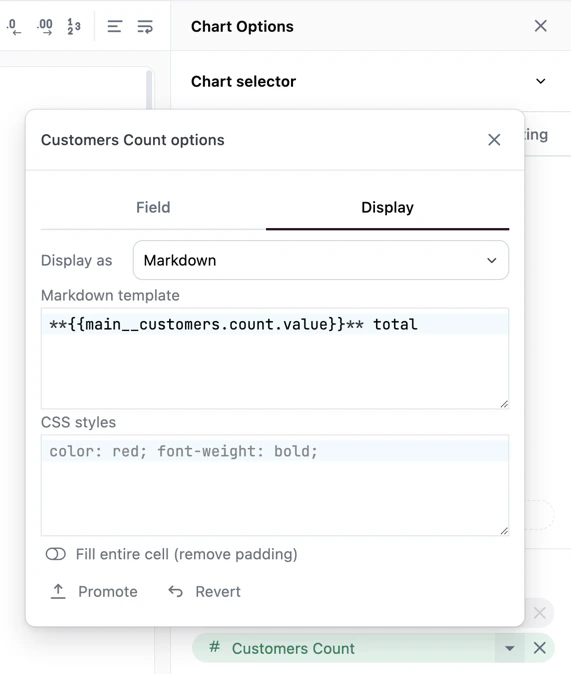 By default, Omni shows the field's original value. From the **Display as** dropdown, you can instead render a field as an image, link, or bar, or—for fields with the `markdown` parameter—as formatted Markdown. The sections below cover each option.
## Displaying fields as images
To display a field as an image, select **Image** from the **Display as** dropdown. The tab will update to display image options, including **Height** and **Width**.
To create a linked image, check the **Link image** box and use the **Link URL** setting to finish configuring the link. This will create a hyperlink that, when clicked, will send the user to a link, a custom link, or an embed event.
The Link URL must be publicly accessible without authentication.
## Displaying fields as links
Omni supports displaying field values as links, making it easy to link to relevant pages from the visualization. Dynamic links for each row can be created in just a few steps:
In the query results table, create a [table calculation](/analyze-explore/calculations) that results in a valid URL. In this example, the `A` column contains a GitHub issue number like `10321`:
```text theme={null}
=CONCAT("https://github.com/blobsrus/issues/",A1)
```
This would result in a value like `https://github.com/blobsrus/issues/10321`.
In the table visualization, hide the calculation column.
Open the visualization's **Options** panel.
In the **Fields** section, click the icon on the field to open the field options dialog.
In the **Display** tab:
* Set **Display as** to **Link**
* Set **URL** to the hidden URL calculation field
## Displaying fields as Markdown
Fields with the `markdown` parameter render as formatted Markdown in table cells. This allows you to display rich text including bold and italic formatting, links, and images using [Mustache](/visualize-present/mustache-reference) templates.
To configure Markdown rendering for a field, add the `markdown` parameter to the [dimension](/modeling/dimensions/parameters/markdown)) or [measure](/modeling/measures/parameters/markdown) definition in your model.
See the [visualization showcase](/showcase) for ready-to-use recipes like [pills](/showcase/visualizations/pills), [star ratings](/showcase/visualizations/star-rating), [status indicators](/showcase/visualizations/status-indicator), and [user profiles](/showcase/visualizations/user-profile).
### Customizing Markdown templates in the workbook
When viewing a field with Markdown in a table visualization, you can customize the Markdown template and CSS in the visualization's **Display** tab without editing the model file.
After customizing the template or CSS, click **Promote** to save your changes to the workbook model. Use **Revert** to restore the original modeled definition.
## Displaying numeric fields as bars
Numeric columns can be displayed as bars in the table, allowing you show relative sizes. Select **Bar** from the **Display as** dropdown to view configuration options.
By default, Omni shows the field's original value. From the **Display as** dropdown, you can instead render a field as an image, link, or bar, or—for fields with the `markdown` parameter—as formatted Markdown. The sections below cover each option.
## Displaying fields as images
To display a field as an image, select **Image** from the **Display as** dropdown. The tab will update to display image options, including **Height** and **Width**.
To create a linked image, check the **Link image** box and use the **Link URL** setting to finish configuring the link. This will create a hyperlink that, when clicked, will send the user to a link, a custom link, or an embed event.
The Link URL must be publicly accessible without authentication.
## Displaying fields as links
Omni supports displaying field values as links, making it easy to link to relevant pages from the visualization. Dynamic links for each row can be created in just a few steps:
In the query results table, create a [table calculation](/analyze-explore/calculations) that results in a valid URL. In this example, the `A` column contains a GitHub issue number like `10321`:
```text theme={null}
=CONCAT("https://github.com/blobsrus/issues/",A1)
```
This would result in a value like `https://github.com/blobsrus/issues/10321`.
In the table visualization, hide the calculation column.
Open the visualization's **Options** panel.
In the **Fields** section, click the icon on the field to open the field options dialog.
In the **Display** tab:
* Set **Display as** to **Link**
* Set **URL** to the hidden URL calculation field
## Displaying fields as Markdown
Fields with the `markdown` parameter render as formatted Markdown in table cells. This allows you to display rich text including bold and italic formatting, links, and images using [Mustache](/visualize-present/mustache-reference) templates.
To configure Markdown rendering for a field, add the `markdown` parameter to the [dimension](/modeling/dimensions/parameters/markdown)) or [measure](/modeling/measures/parameters/markdown) definition in your model.
See the [visualization showcase](/showcase) for ready-to-use recipes like [pills](/showcase/visualizations/pills), [star ratings](/showcase/visualizations/star-rating), [status indicators](/showcase/visualizations/status-indicator), and [user profiles](/showcase/visualizations/user-profile).
### Customizing Markdown templates in the workbook
When viewing a field with Markdown in a table visualization, you can customize the Markdown template and CSS in the visualization's **Display** tab without editing the model file.
After customizing the template or CSS, click **Promote** to save your changes to the workbook model. Use **Revert** to restore the original modeled definition.
## Displaying numeric fields as bars
Numeric columns can be displayed as bars in the table, allowing you show relative sizes. Select **Bar** from the **Display as** dropdown to view configuration options.
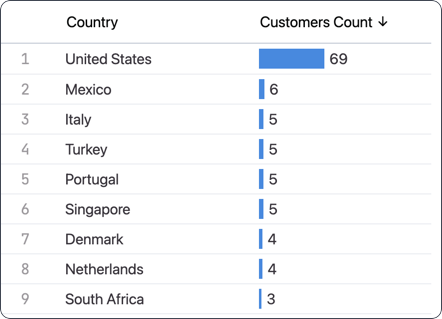 If a column contains negative values, bars will split directions. Column alignment settings will be ignored.
### Setting a fixed range for bars
By default, bars scale automatically relative to the column's data extent—the largest value in the column fills the bar completely, and all other values are scaled proportionally.
You can instead set a fixed range using the **Range** setting in the **Display** tab. With a fixed range, bars render against an absolute scale regardless of the actual data values. For example, if you set a max of 100, a value of 50 will always fill half the bar, even if no row contains a value near 100.
To configure a fixed range:
1. In the field's **Display** tab, locate the **Range** setting
2. Enter a **Min** value, a **Max** value, or both
3. The bars will now scale against the specified range instead of the data extent
When you set a fixed range:
* **Values within the range** scale proportionally between the min and max
* **Values exceeding the max** truncate to a full bar, but the numeric label displays the true value
* **Values below the min** truncate to an empty bar, but the numeric label displays the true value
* To revert to automatic scaling, clear both the Min and Max inputs by deleting their values
The Min value must be strictly less than the Max value. If you enter an invalid range, the input will revert to the previously stored value.
If a column contains negative values, bars will split directions. Column alignment settings will be ignored.
### Setting a fixed range for bars
By default, bars scale automatically relative to the column's data extent—the largest value in the column fills the bar completely, and all other values are scaled proportionally.
You can instead set a fixed range using the **Range** setting in the **Display** tab. With a fixed range, bars render against an absolute scale regardless of the actual data values. For example, if you set a max of 100, a value of 50 will always fill half the bar, even if no row contains a value near 100.
To configure a fixed range:
1. In the field's **Display** tab, locate the **Range** setting
2. Enter a **Min** value, a **Max** value, or both
3. The bars will now scale against the specified range instead of the data extent
When you set a fixed range:
* **Values within the range** scale proportionally between the min and max
* **Values exceeding the max** truncate to a full bar, but the numeric label displays the true value
* **Values below the min** truncate to an empty bar, but the numeric label displays the true value
* To revert to automatic scaling, clear both the Min and Max inputs by deleting their values
The Min value must be strictly less than the Max value. If you enter an invalid range, the input will revert to the previously stored value.