> ## Documentation Index
> Fetch the complete documentation index at: https://docs.omni.co/llms.txt
> Use this file to discover all available pages before exploring further.
# Scatterplots and bubble charts
> Create scatterplot and bubble chart visualizations in Omni to explore correlations, distributions, and data point clusters.
## Examples
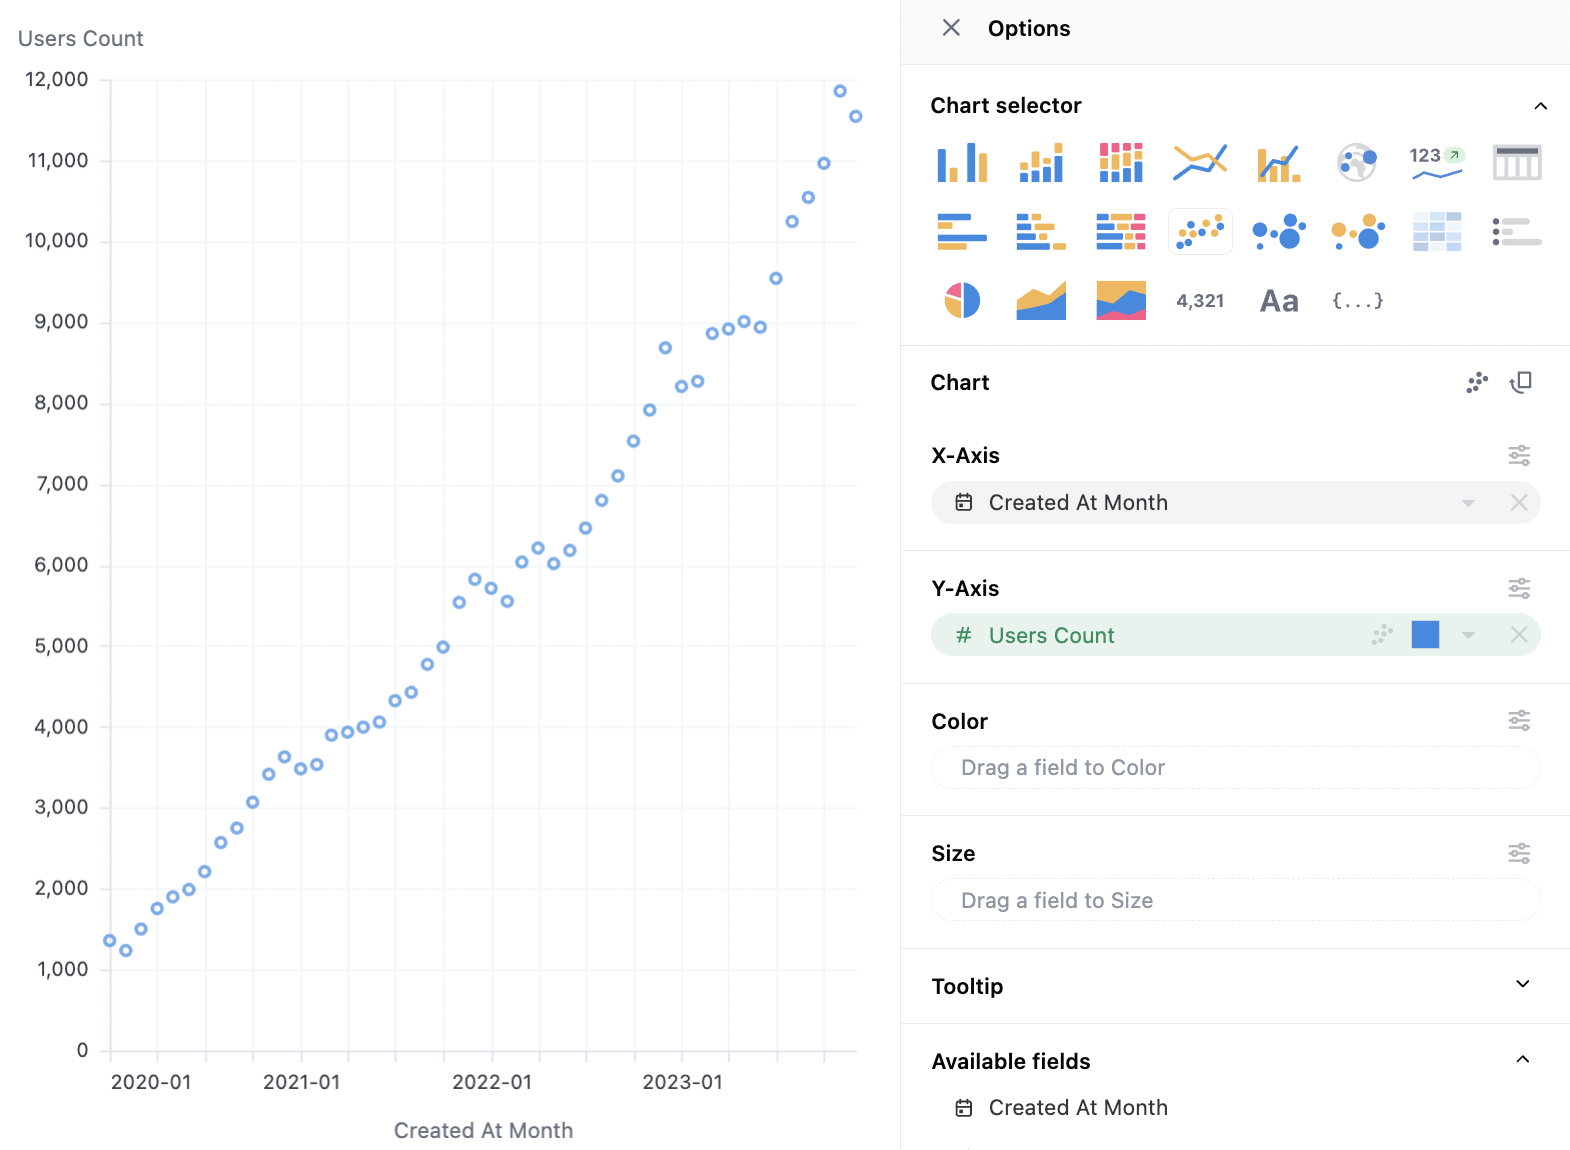
**Basic Scatter:**
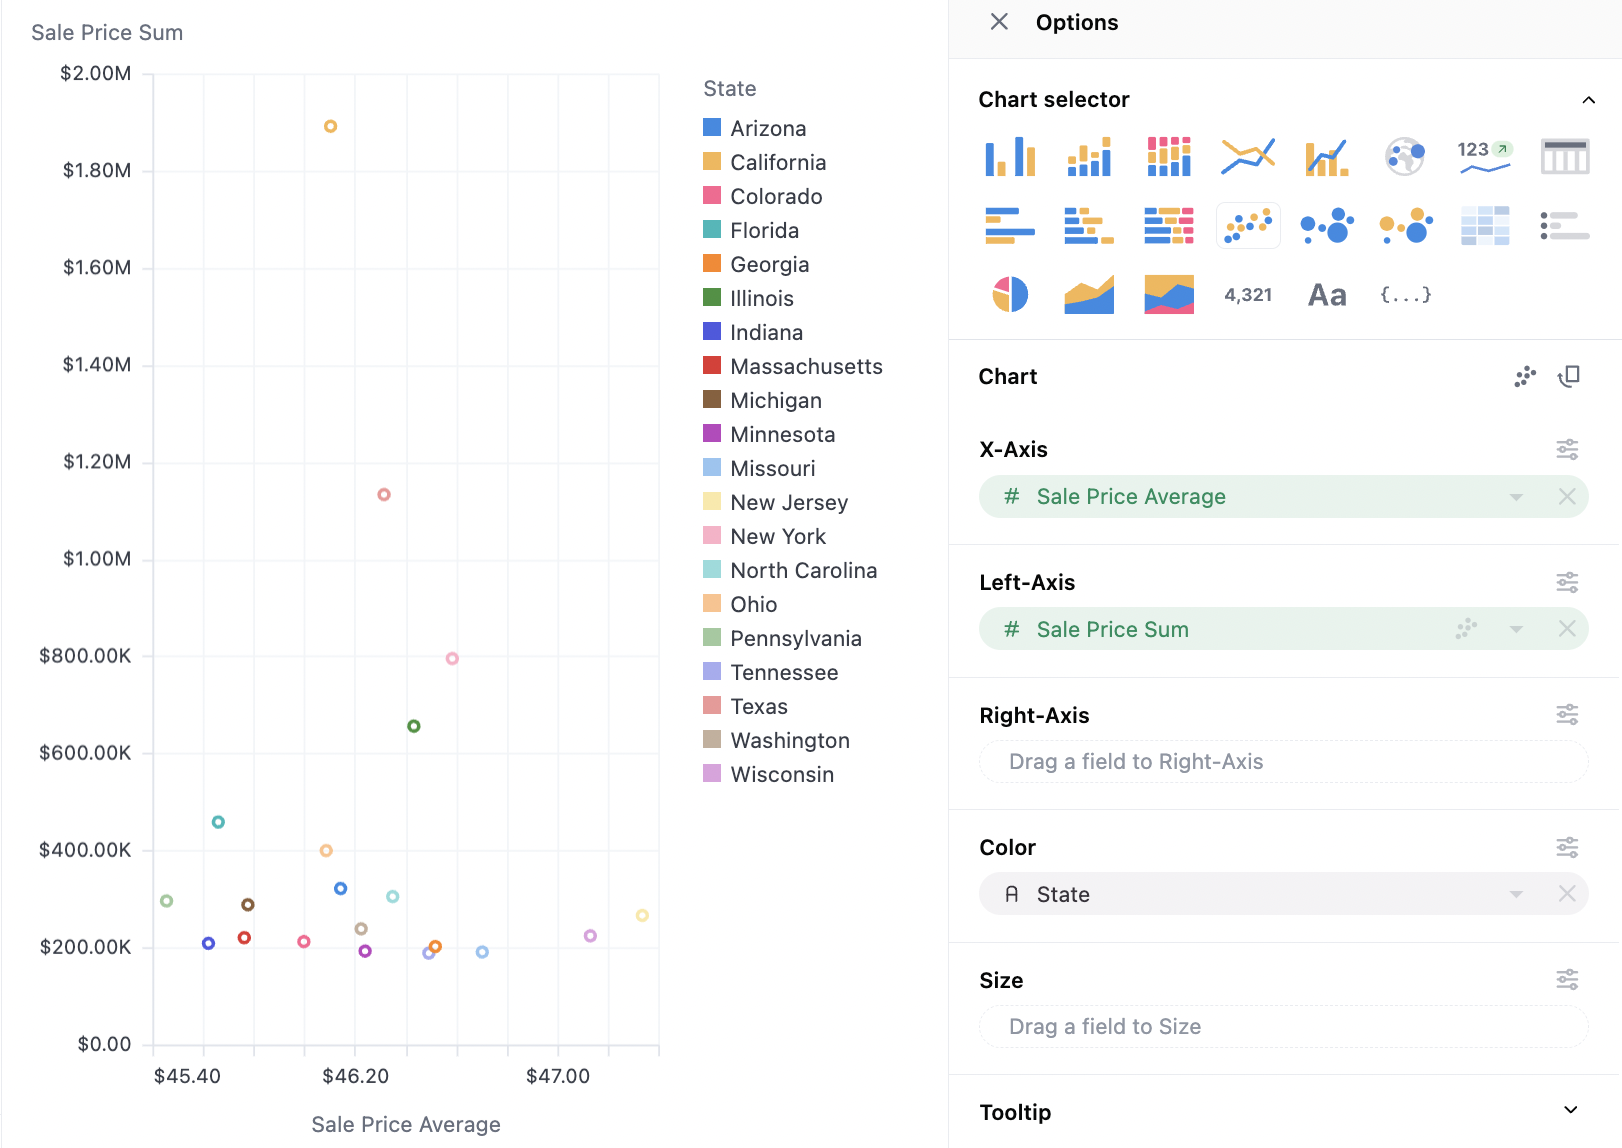
 **Color Scatter:**
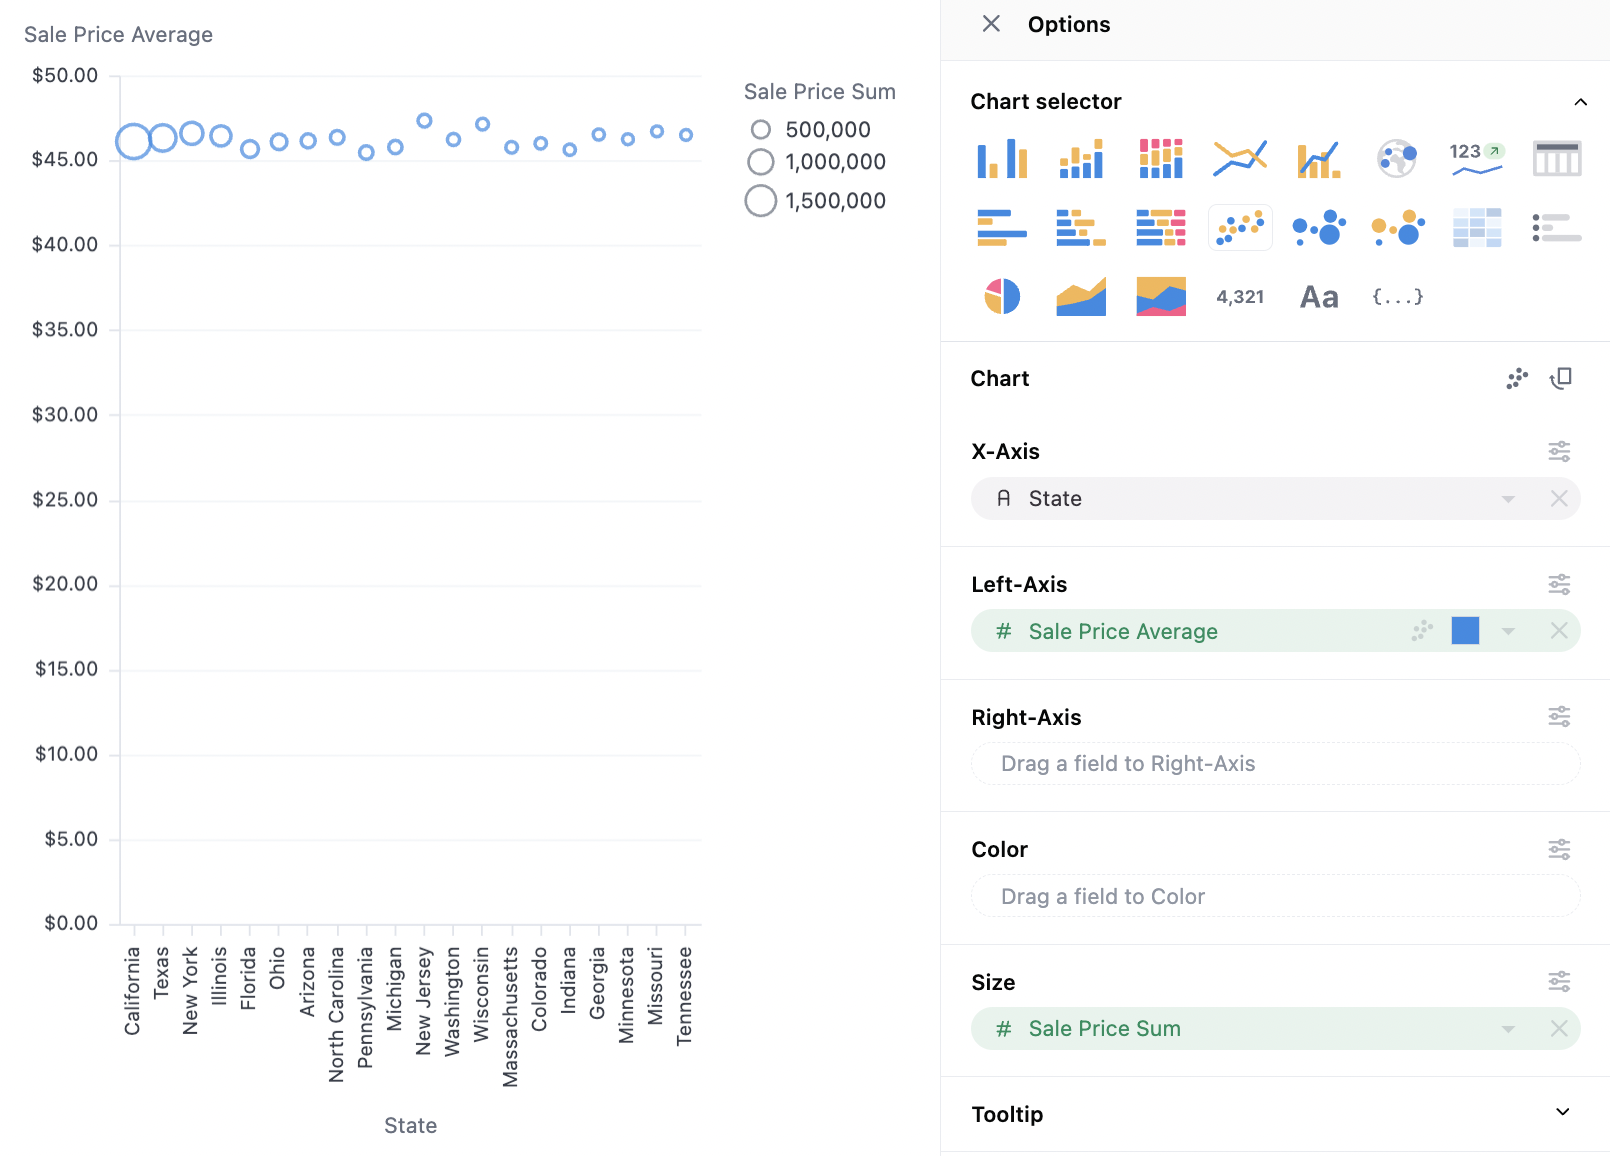
 **Bubble:**
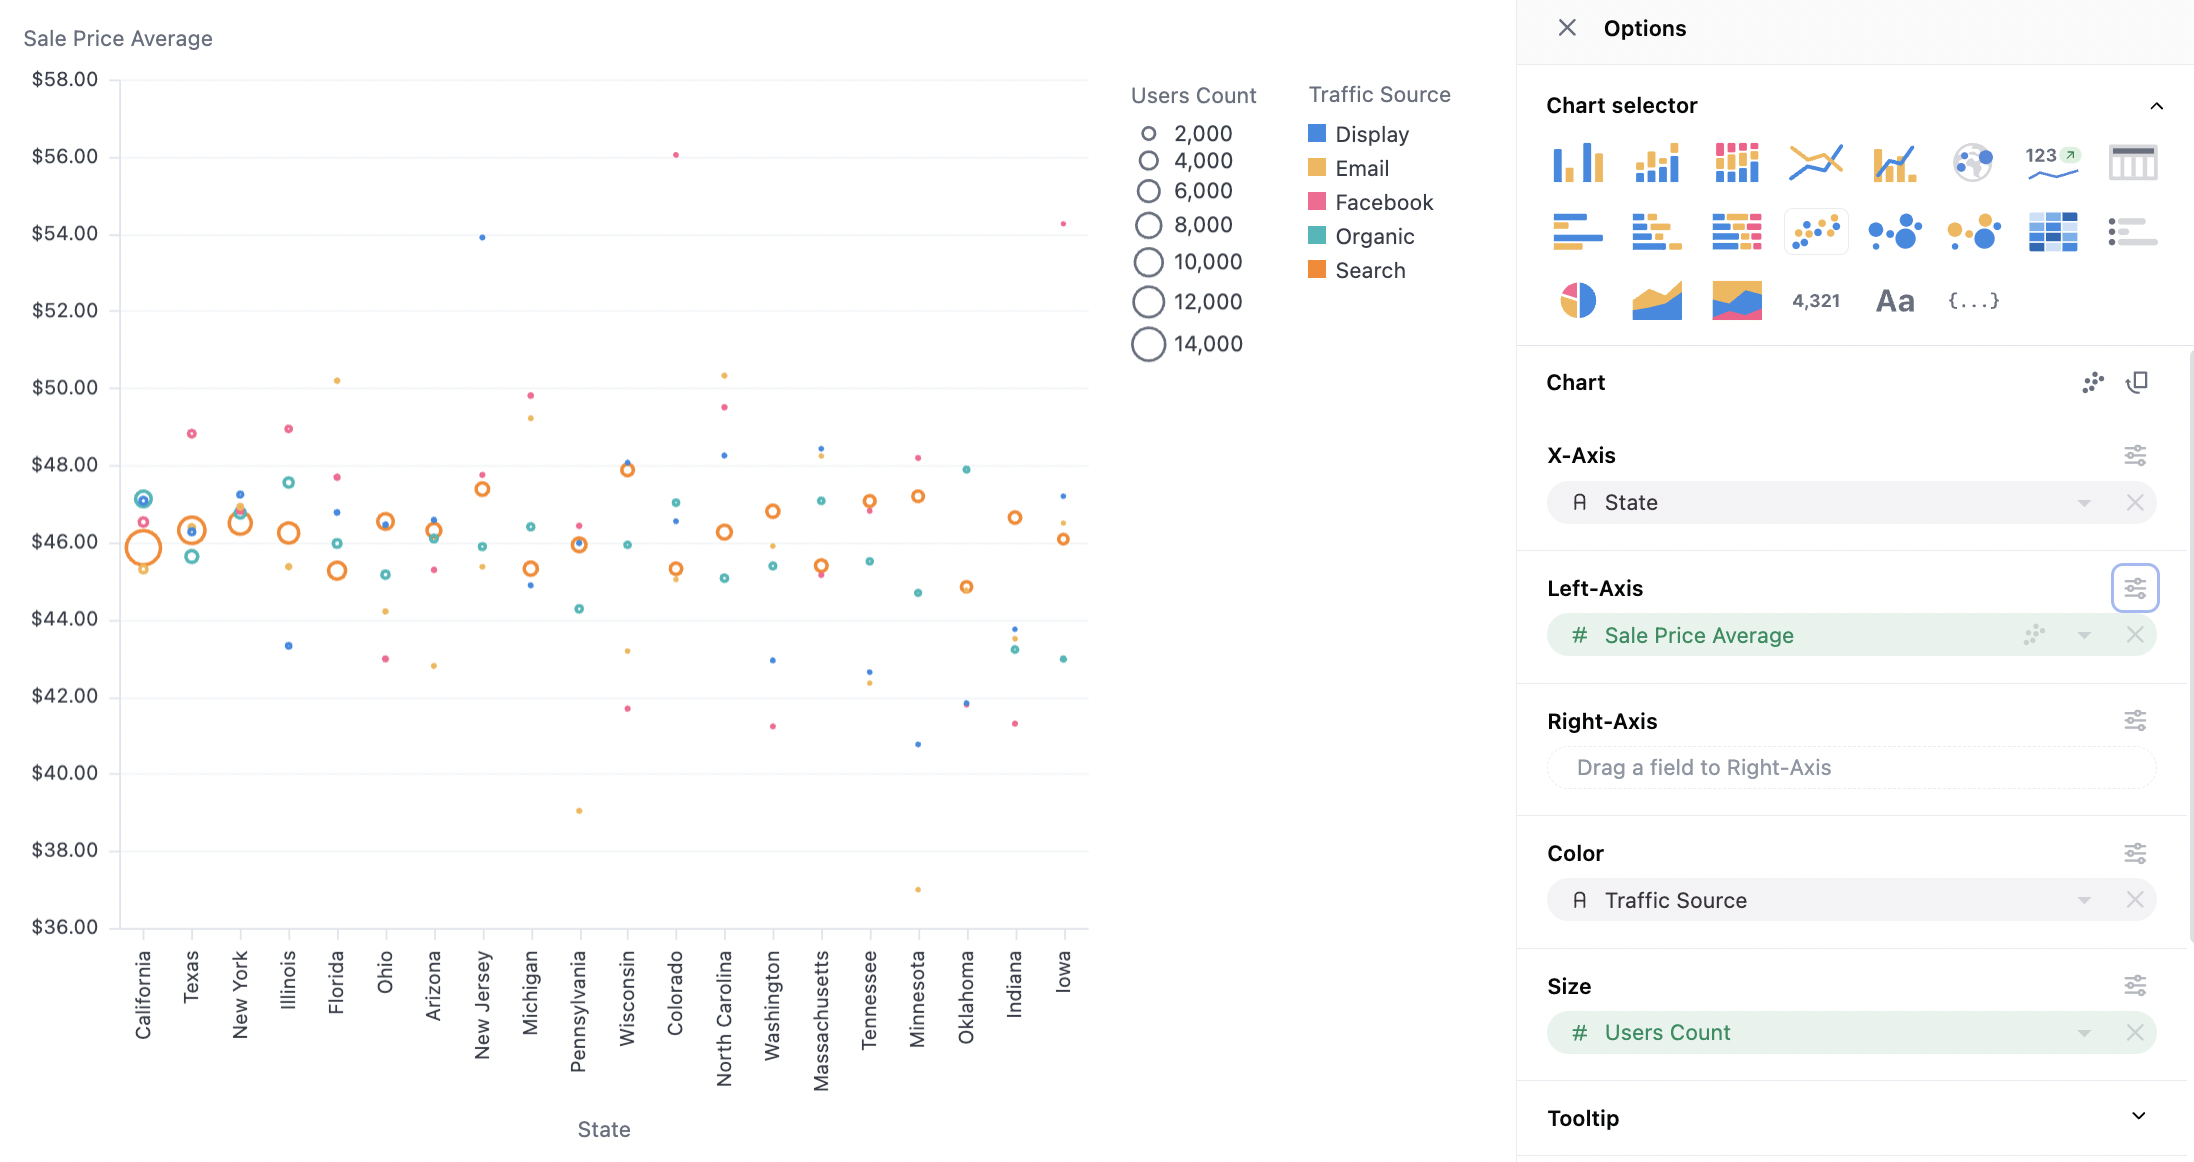
 **Bubble With Color:**
 ## Data Structures
Scatterplots can work with pivoted or unpivoted data. To layer in color or size, simply drag a series onto the optional facets. Note that color will behave differently for numerics (where color will be plotted as a continuous variable) or strings (where color is plotted as an ordinal). For numerics, the behavior can be toggled under color > type.
## Scatter Configuration Notes
### Scatterplot Data Labels
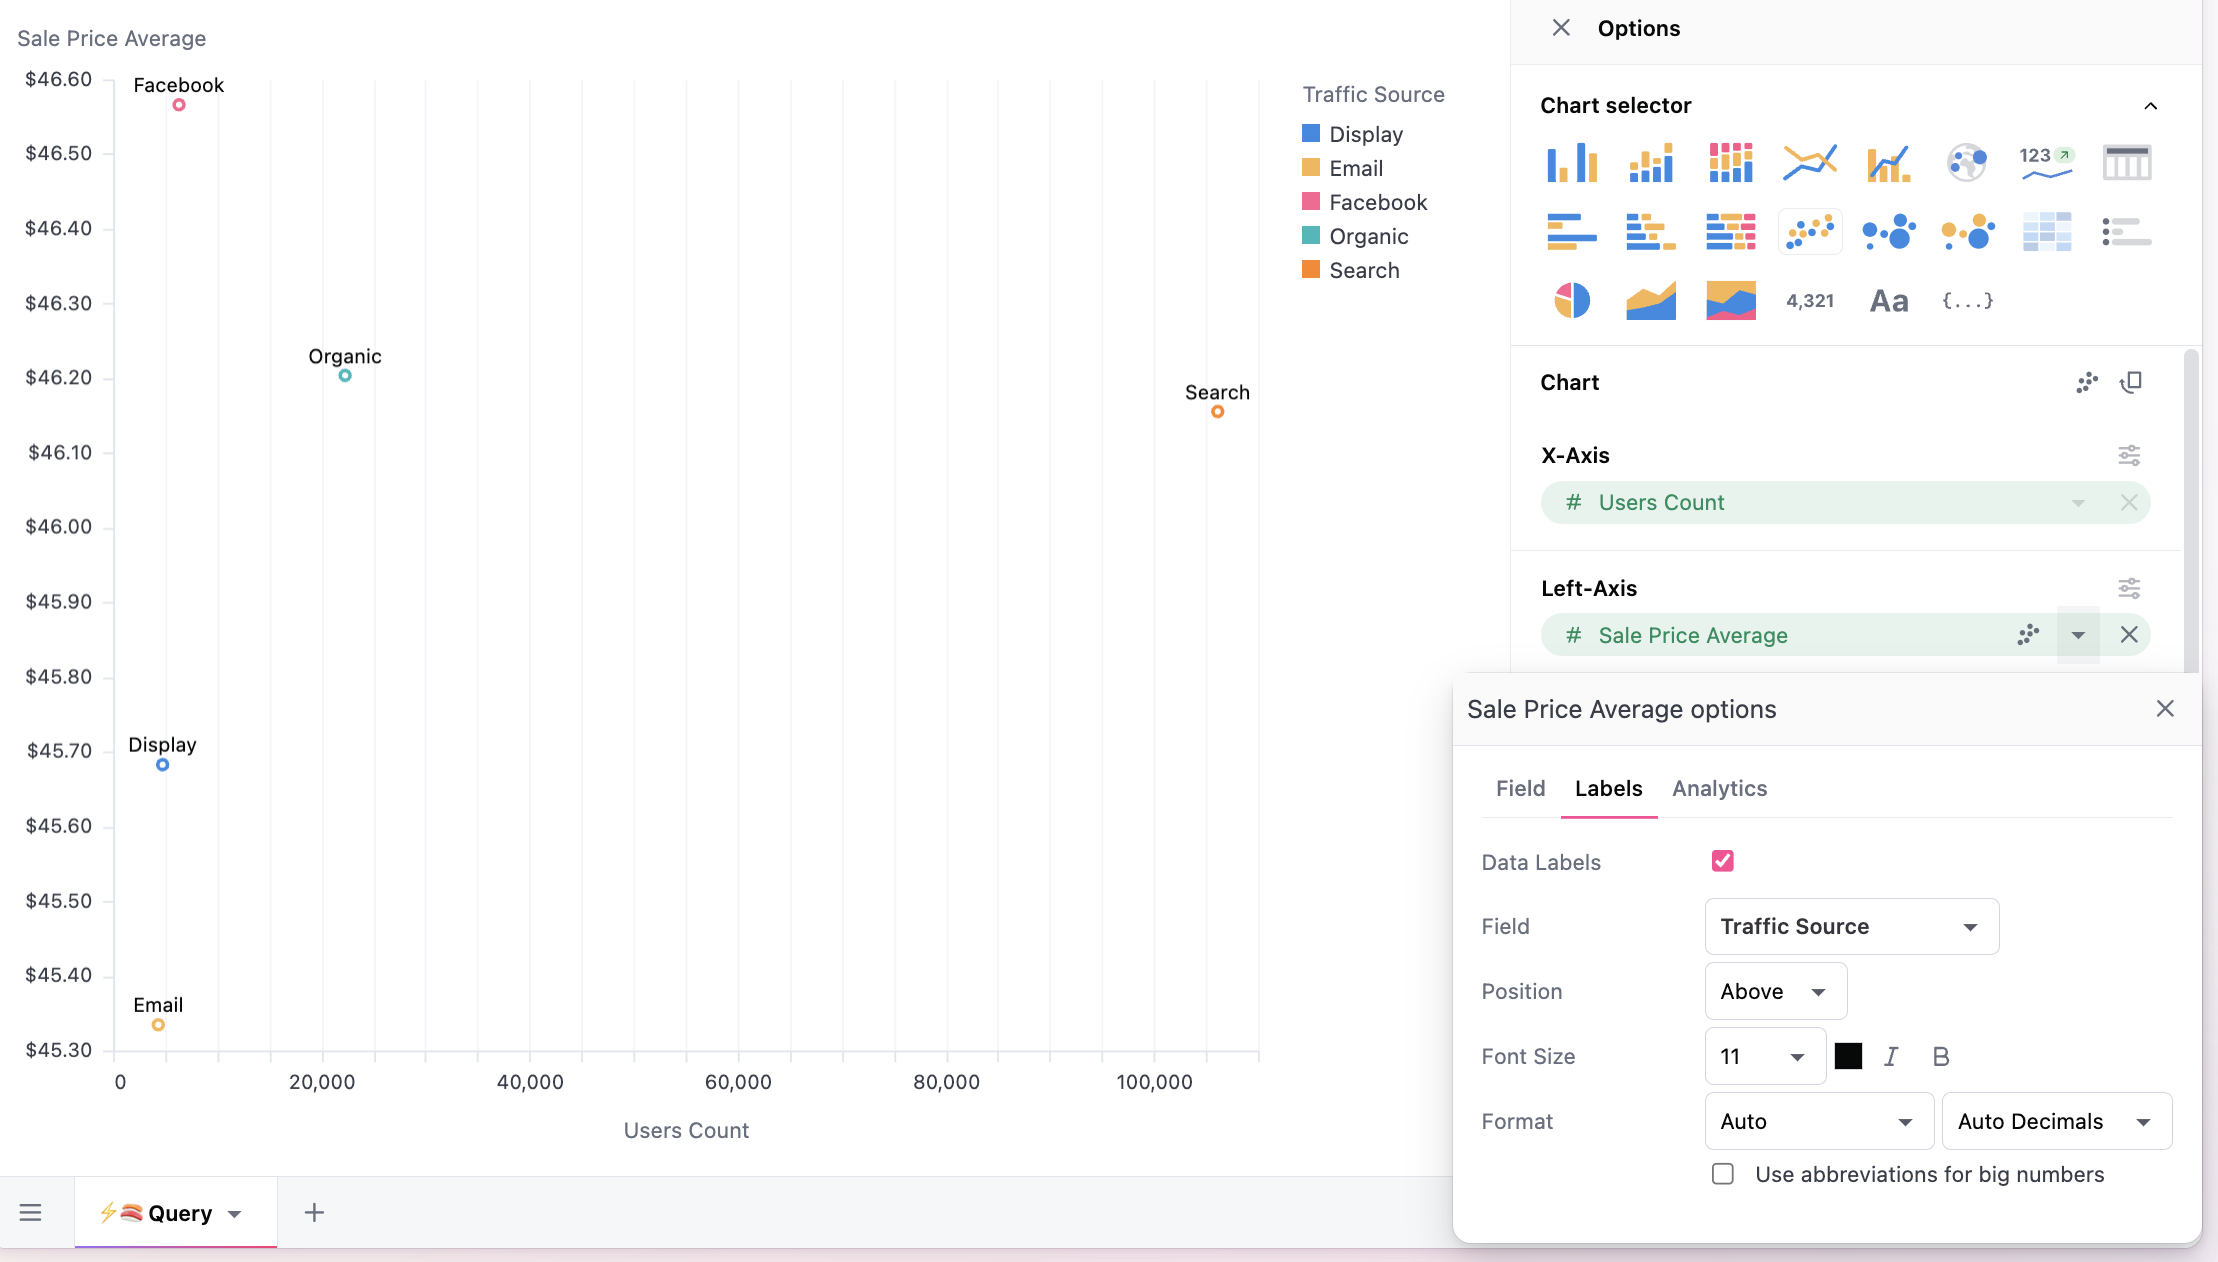
Scatter plots offer limited point-specific configuration, but often desire labels on the points. Series labels are configured from the *Y-Axis menu* (see below), and can be mapped to other series in the results table (often the dimension). For more complex labels, formulas/calculations can build alternative label options.
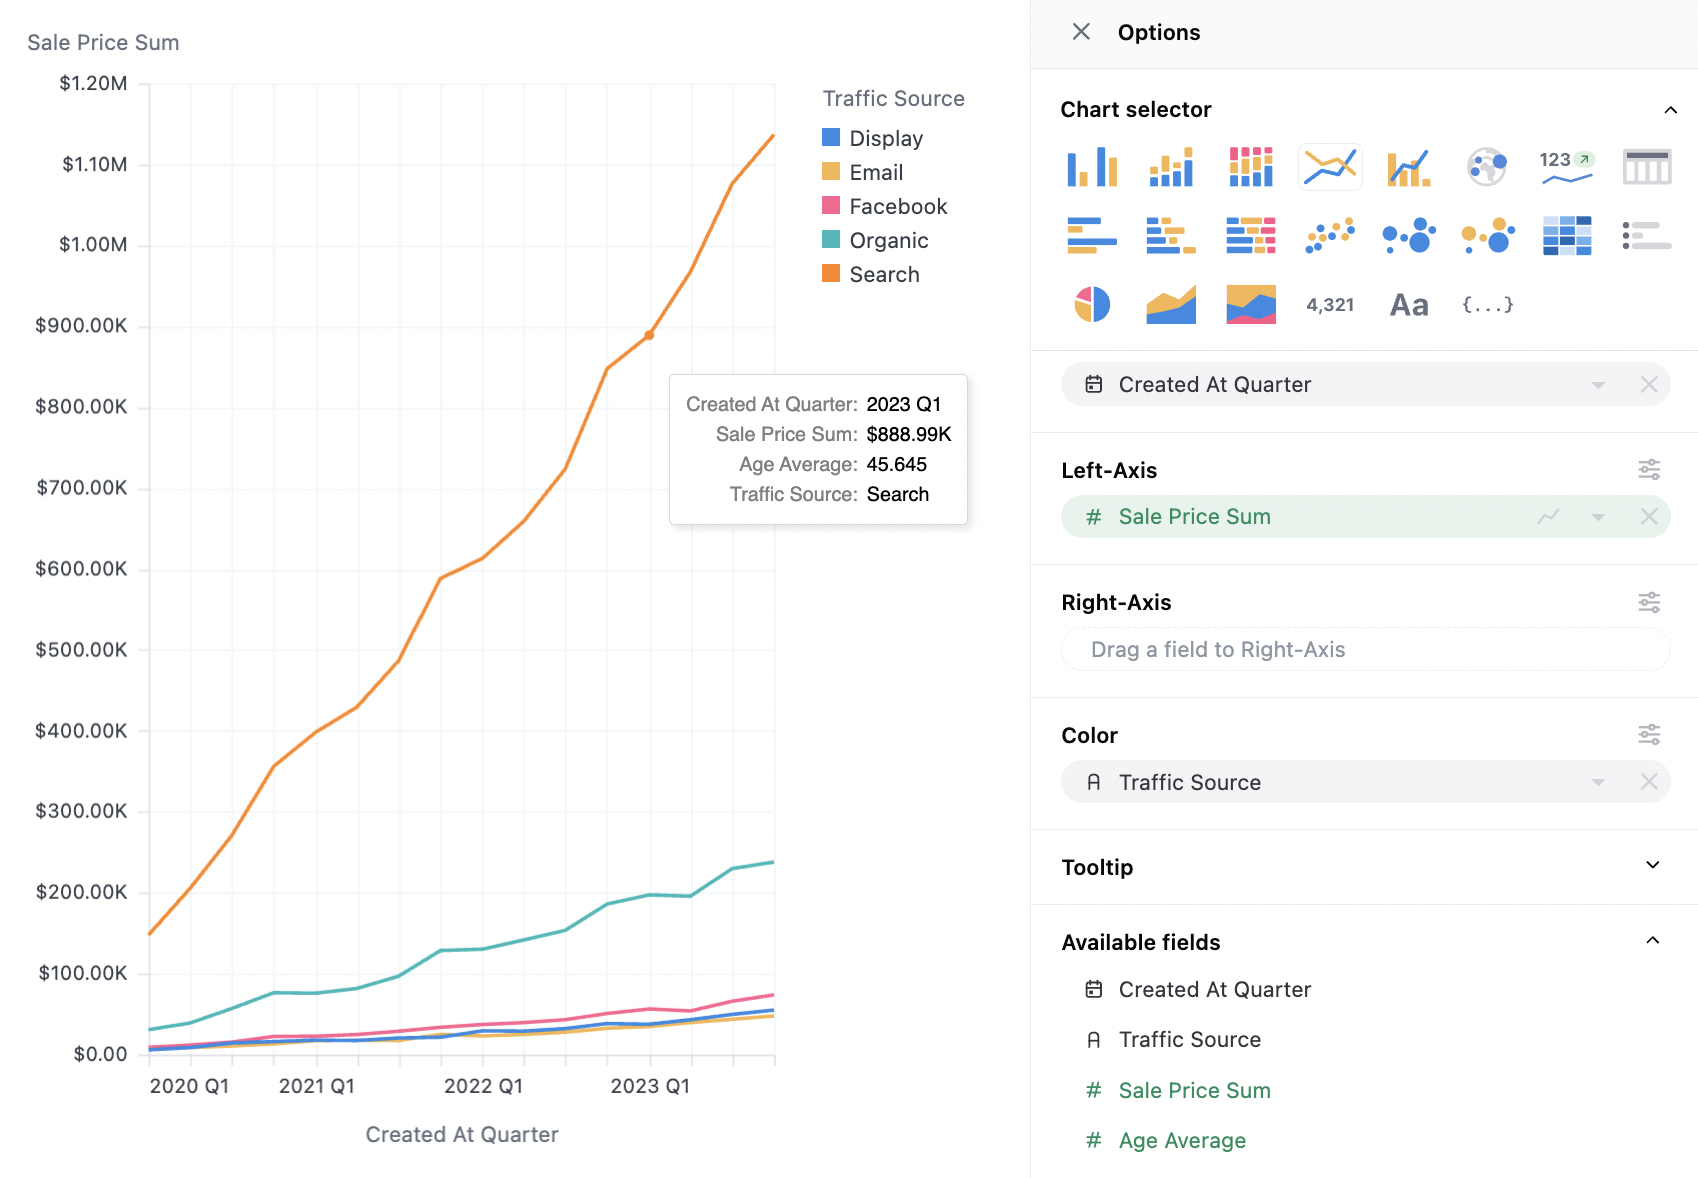
Here we map the dimension (`Traffic Source`) into our series (`Sales Price Average`), note `Traffic Source` is also on color here, hence the legend, but that is not required:
## Data Structures
Scatterplots can work with pivoted or unpivoted data. To layer in color or size, simply drag a series onto the optional facets. Note that color will behave differently for numerics (where color will be plotted as a continuous variable) or strings (where color is plotted as an ordinal). For numerics, the behavior can be toggled under color > type.
## Scatter Configuration Notes
### Scatterplot Data Labels
Scatter plots offer limited point-specific configuration, but often desire labels on the points. Series labels are configured from the *Y-Axis menu* (see below), and can be mapped to other series in the results table (often the dimension). For more complex labels, formulas/calculations can build alternative label options.
Here we map the dimension (`Traffic Source`) into our series (`Sales Price Average`), note `Traffic Source` is also on color here, hence the legend, but that is not required:
 ### Scatterplot Tooltips
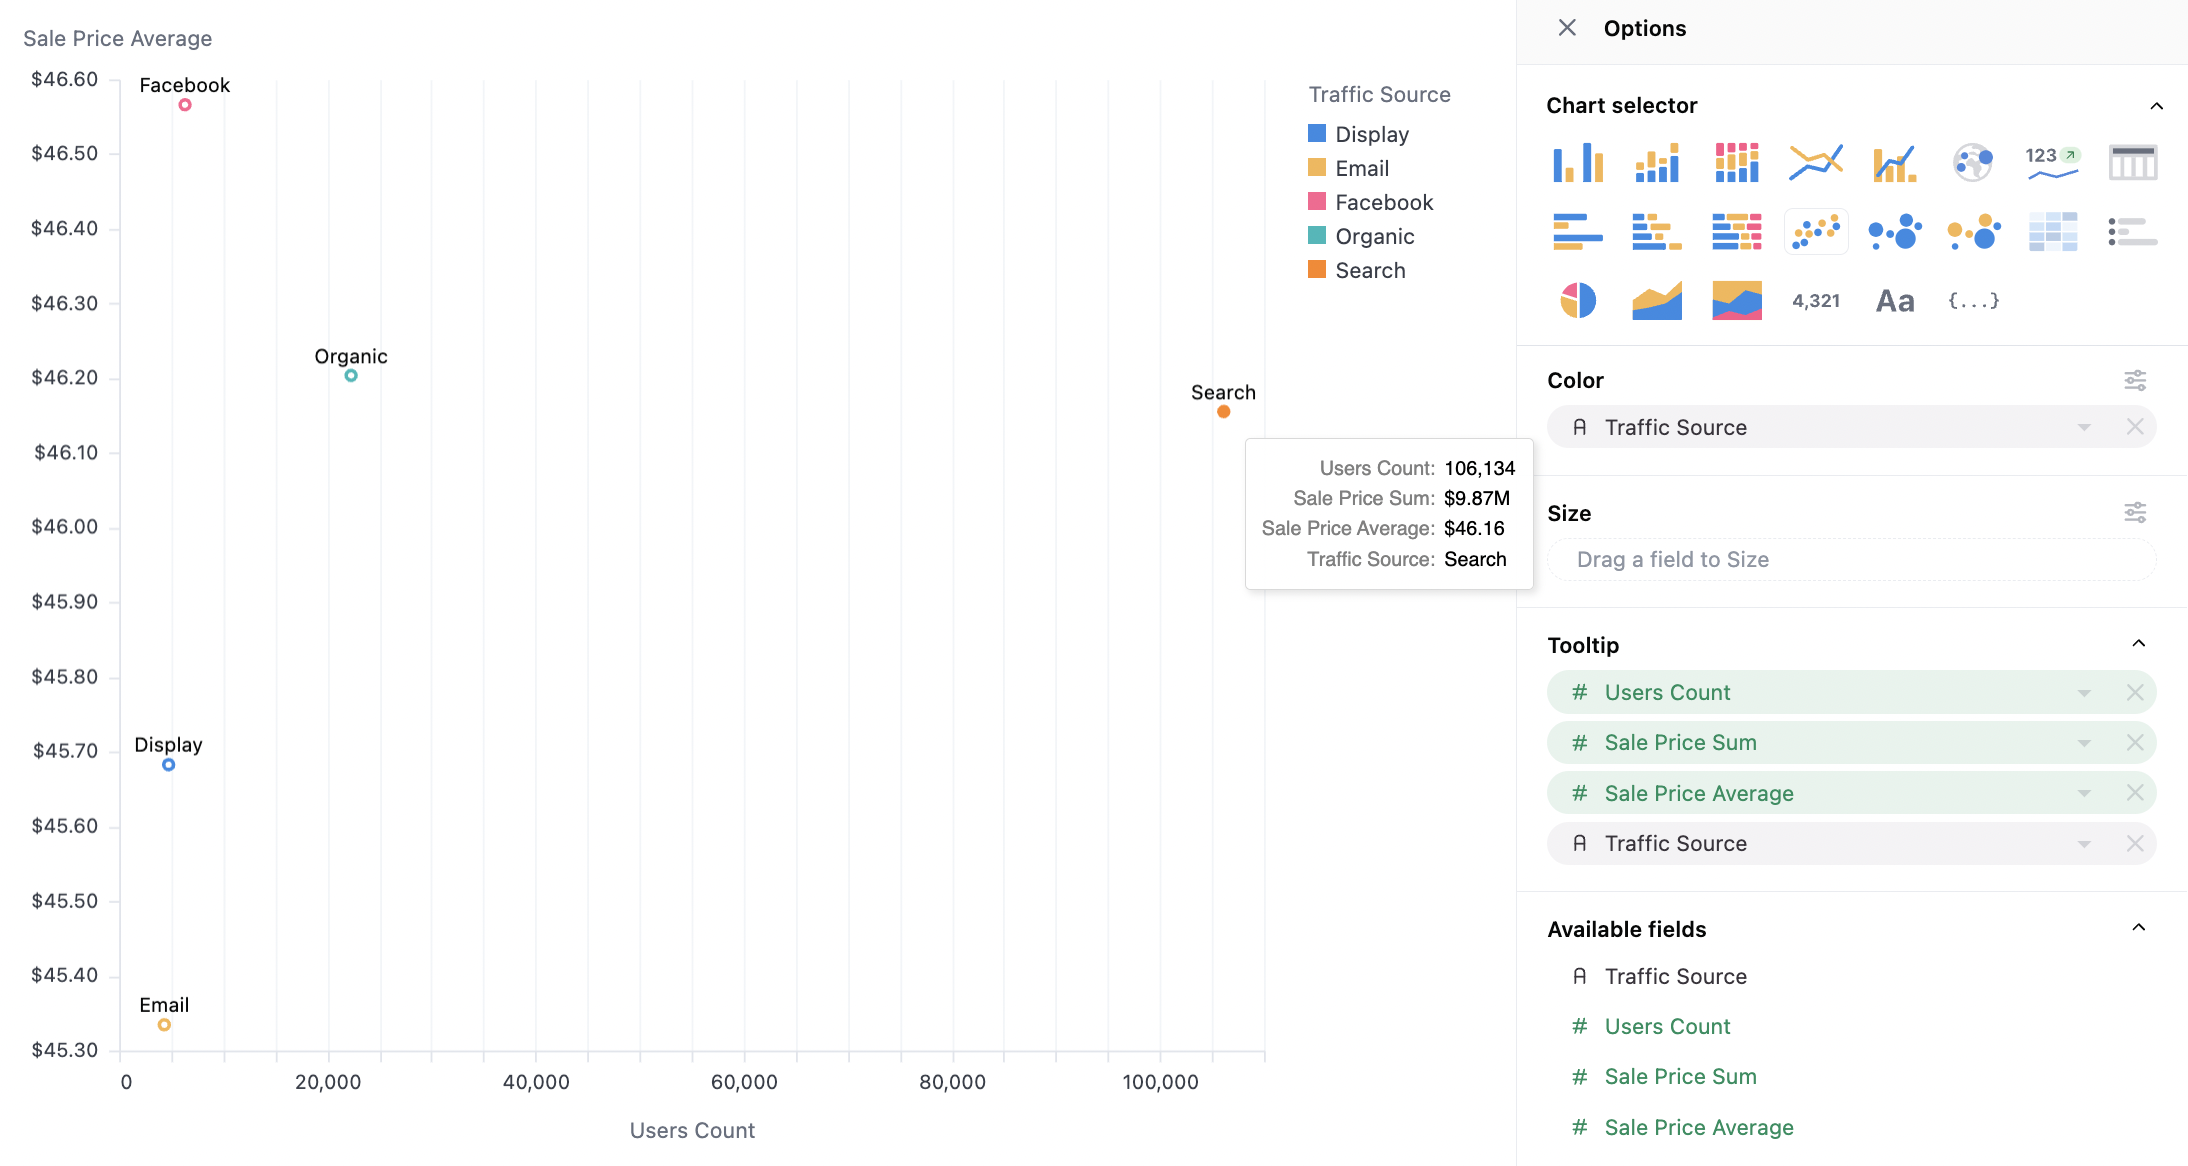
Tooltip control is another frequent need for scatterplots. To configure which dimensions or measures are in the tooltip, they can be dragged to the tooltip section, and are shown in the order listed.
### Scatterplot Tooltips
Tooltip control is another frequent need for scatterplots. To configure which dimensions or measures are in the tooltip, they can be dragged to the tooltip section, and are shown in the order listed.
 ## Overall Configuration Notes
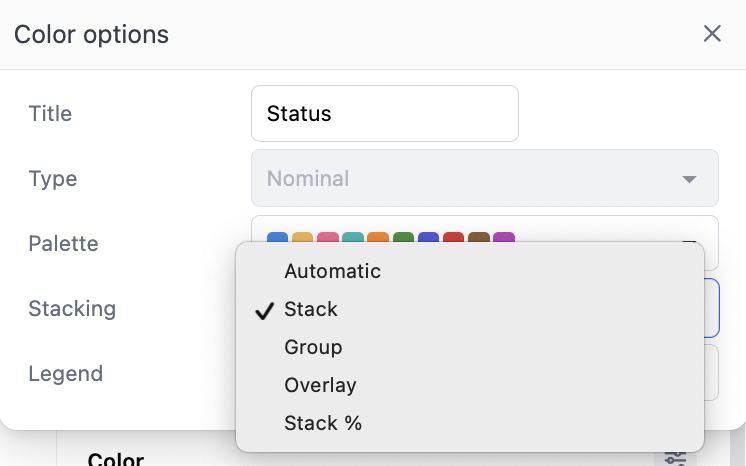
The color section controls overall stacking and grouping behavior overall, which is rarely important for scatterplots. Additionally stack can be set independently on the different y-axis, under the y-axis series configuration (useful for overall grouping of two stacked grouplets):
* Automatic: we'll guess for you
* Stack: Series on same x-axis value, ontop of each other
* Group: Series offset from their baseline x-axis mark into grouplets
* Overlay: Series *ontop* of each other (usually very undesirable, but useful in rare cases)
* Stack %: Series rebased to 100% across each x-axis value
## Overall Configuration Notes
The color section controls overall stacking and grouping behavior overall, which is rarely important for scatterplots. Additionally stack can be set independently on the different y-axis, under the y-axis series configuration (useful for overall grouping of two stacked grouplets):
* Automatic: we'll guess for you
* Stack: Series on same x-axis value, ontop of each other
* Group: Series offset from their baseline x-axis mark into grouplets
* Overlay: Series *ontop* of each other (usually very undesirable, but useful in rare cases)
* Stack %: Series rebased to 100% across each x-axis value
 ## Other Notes
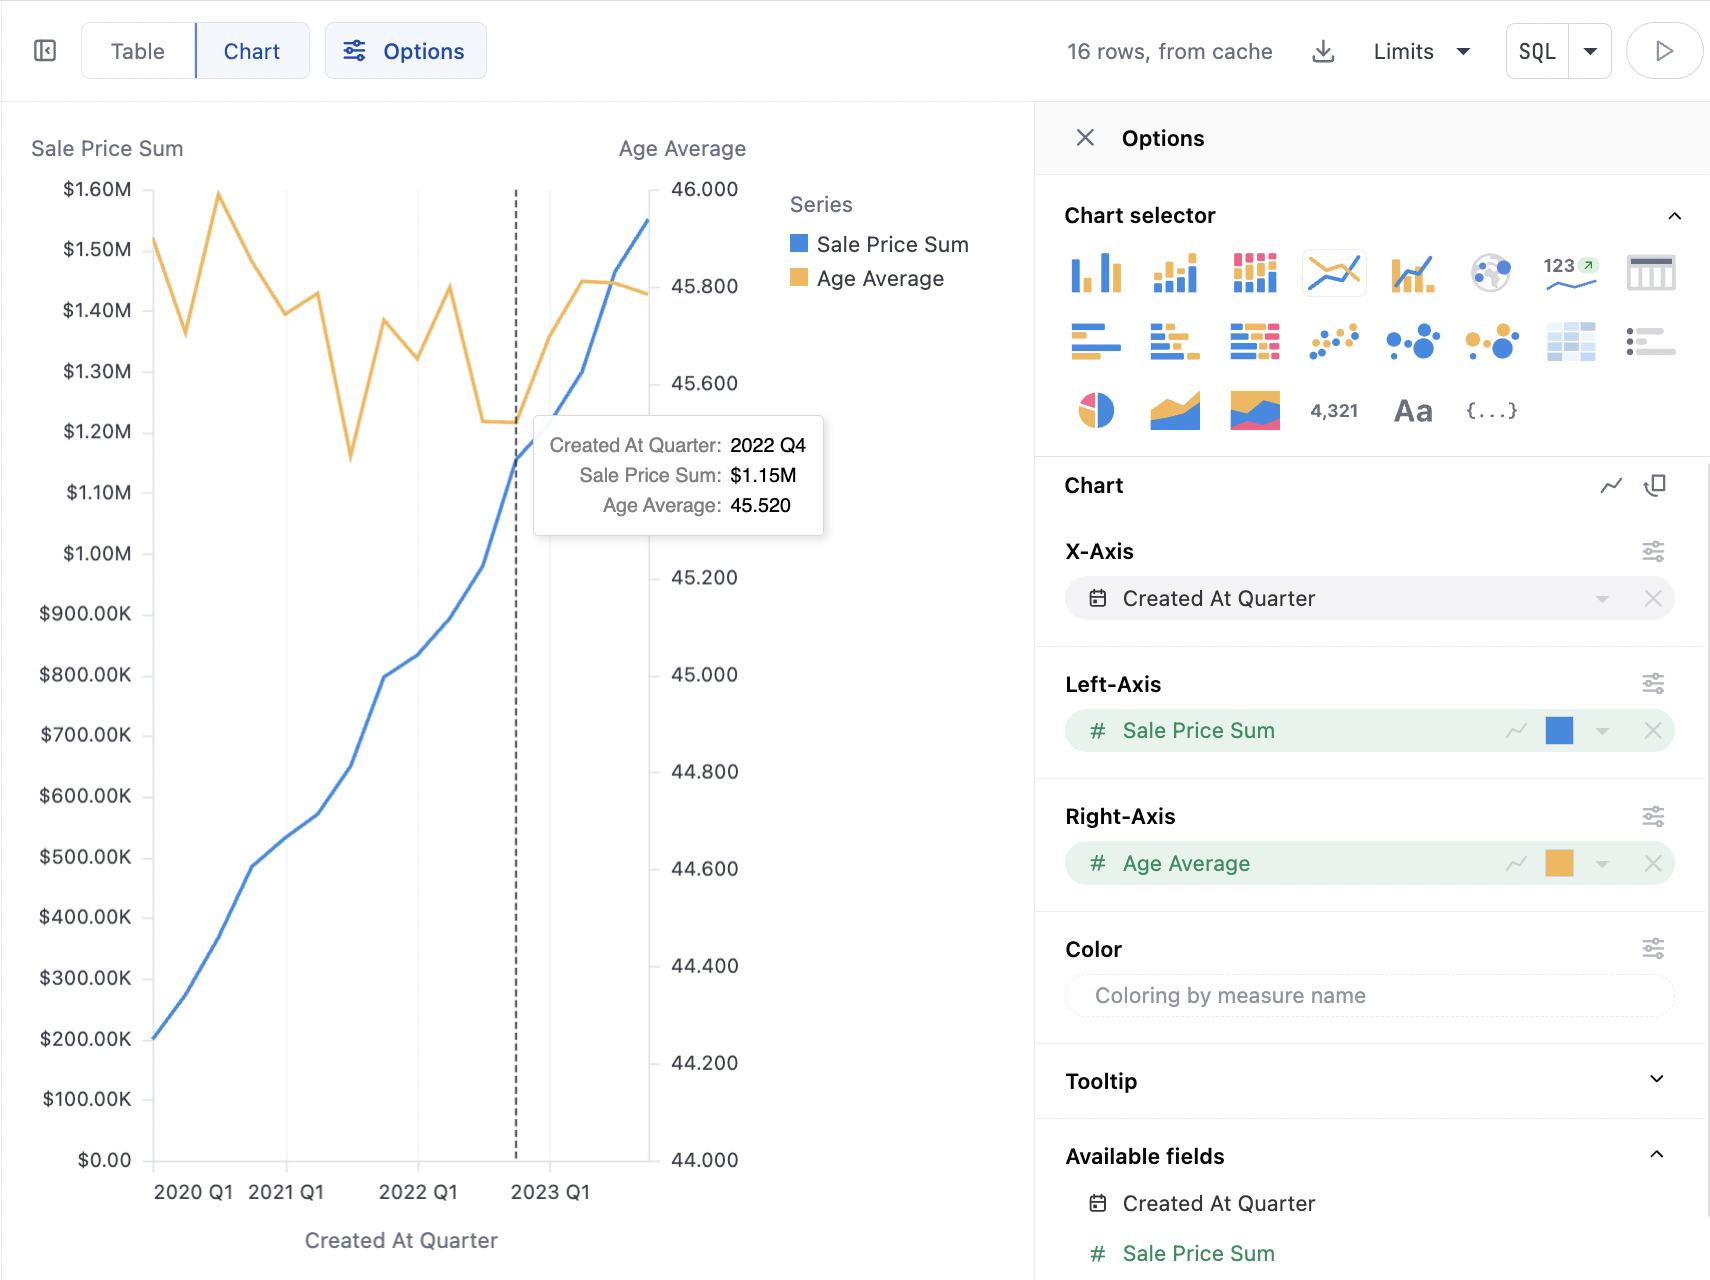
* Time dimension axes are set to temporal with scatterplots (the same as line charts), meaning points will be displayed along a continuous time axis. For charts where ordinal behavior is desired, it's recommended to toggle the individual series from a bar chart accelerator.
* With time fields, order will be automatically set to ascending; other data types will obey the table ordering when graphing
* Tooltips have two styles (see below):
* On scatterplots with multiple measures, hover will highlight all available series along the x-axis vertically, vs just the series being hovered.
* On scatterplots with a dimension mapped to color (and a single measure), the hover will only show the nearest point
## Other Notes
* Time dimension axes are set to temporal with scatterplots (the same as line charts), meaning points will be displayed along a continuous time axis. For charts where ordinal behavior is desired, it's recommended to toggle the individual series from a bar chart accelerator.
* With time fields, order will be automatically set to ascending; other data types will obey the table ordering when graphing
* Tooltips have two styles (see below):
* On scatterplots with multiple measures, hover will highlight all available series along the x-axis vertically, vs just the series being hovered.
* On scatterplots with a dimension mapped to color (and a single measure), the hover will only show the nearest point