> ## Documentation Index
> Fetch the complete documentation index at: https://docs.omni.co/llms.txt
> Use this file to discover all available pages before exploring further.

# Pie & Donut charts

> Pie:
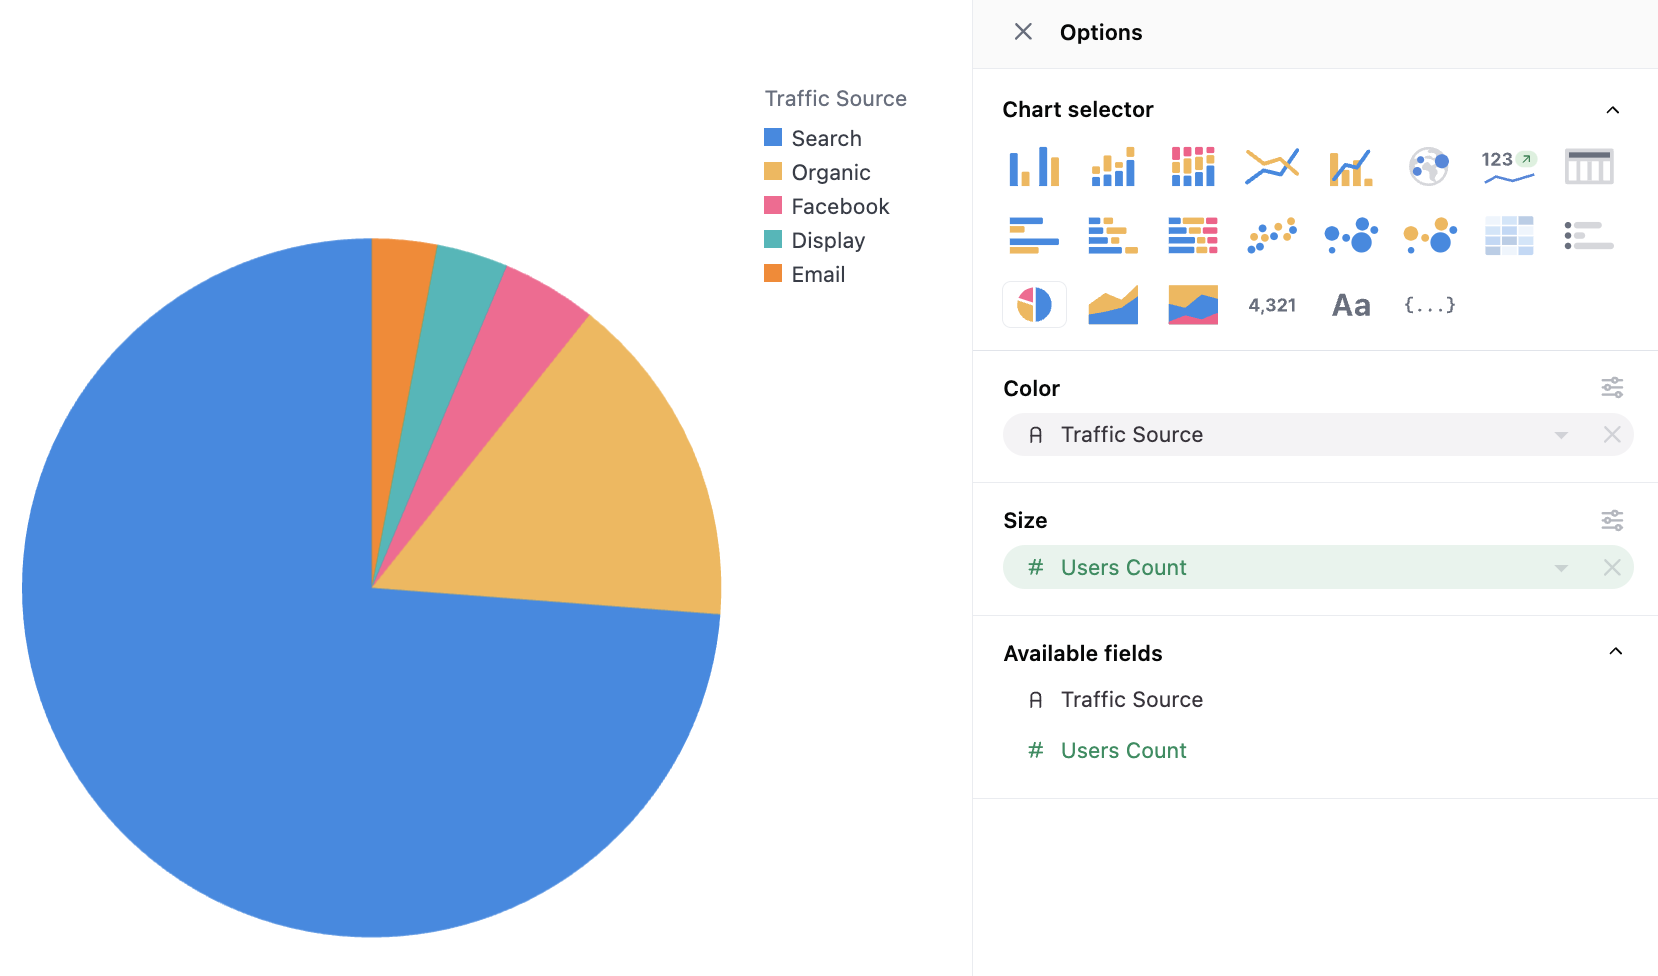
<img src="https://mintcdn.com/omni-e7402367/aZ84MHc8H0bDix_i/images/docs/visualization-and-dashboards/visualization-types/assets/images/pie-7cbe66274db36ae0d67e387ebc532b4c.png?fit=max&auto=format&n=aZ84MHc8H0bDix_i&q=85&s=22edac6d06f12649c07a865be07525e9" alt="" width="1658" height="976" data-path="images/docs/visualization-and-dashboards/visualization-types/assets/images/pie-7cbe66274db36ae0d67e387ebc532b4c.png" />

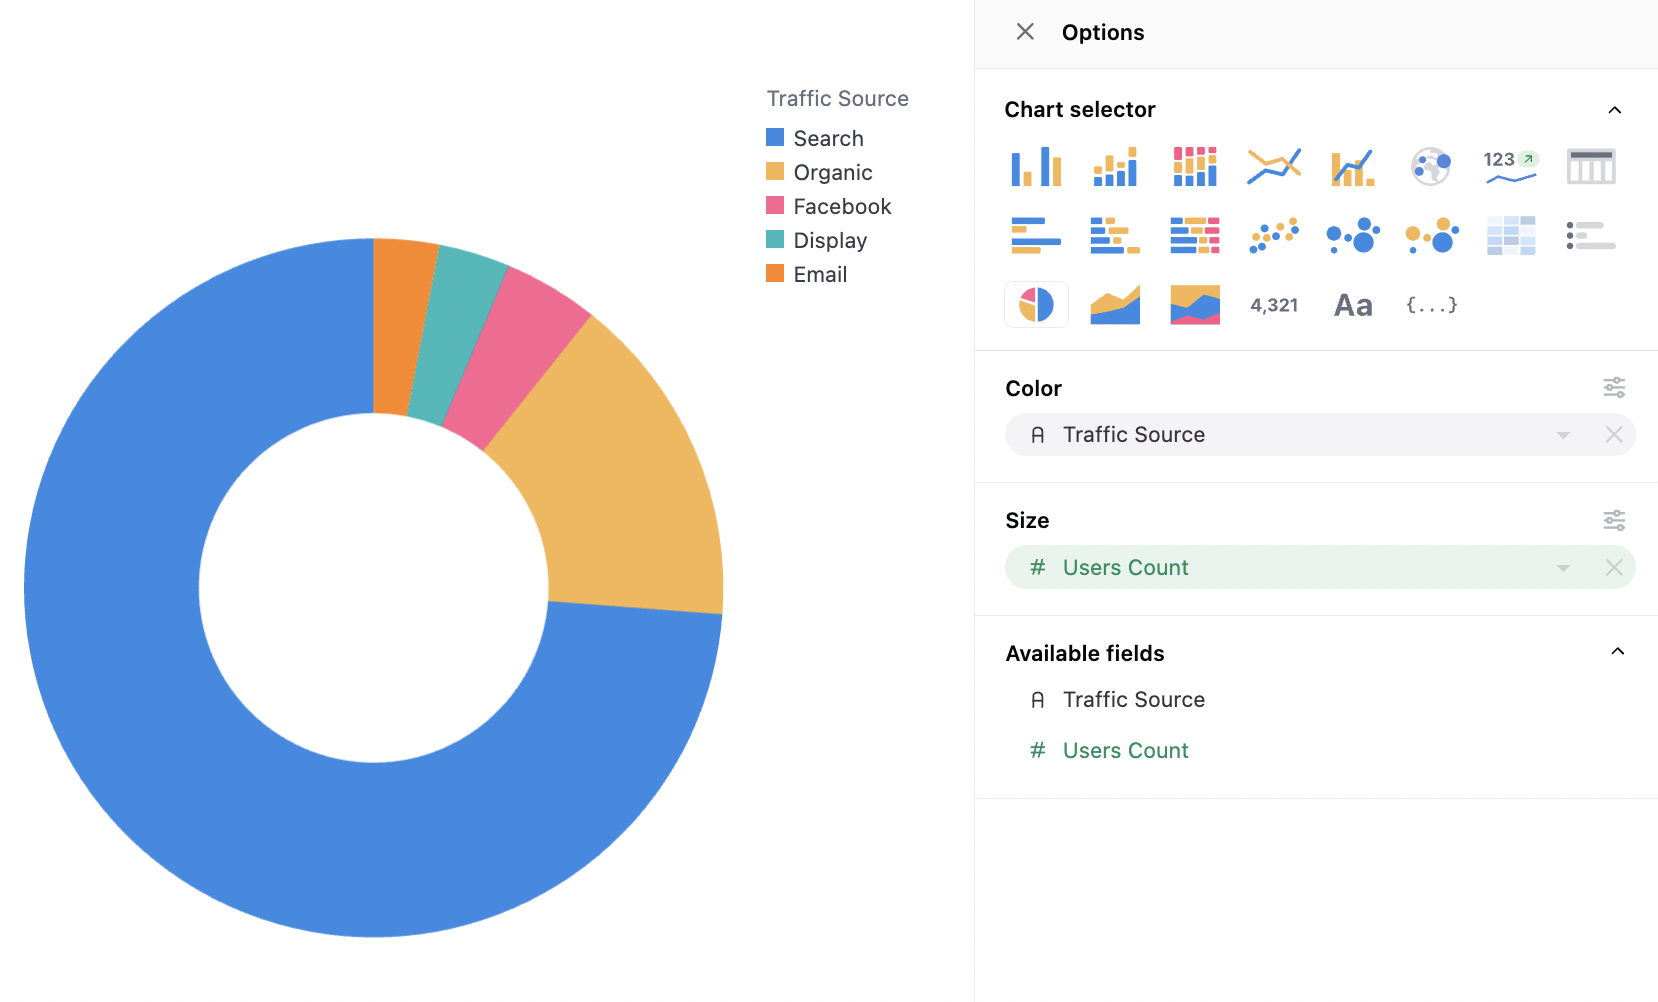
**Donut:**

<img src="https://mintcdn.com/omni-e7402367/K4oAdi8TCvG1dpiF/images/docs/visualization-and-dashboards/visualization-types/assets/images/donut-8932558f7dd4090de51b40e7dee2626b.png?fit=max&auto=format&n=K4oAdi8TCvG1dpiF&q=85&s=5d6272d6f62f52d09794beccee658f6a" alt="" width="1658" height="1002" data-path="images/docs/visualization-and-dashboards/visualization-types/assets/images/donut-8932558f7dd4090de51b40e7dee2626b.png" />

## Data Structure

Pie charts only use two series, the color and the size. If two series are needed in the color, it's recommended to concatenate columns together.

## Configuration Notes

Pie charts use the same color controls as all other charts (more [here](/visualize-present/visualizations/configuration/color)).

## Color configuration

Pie charts support gradient color scale value pins when coloring by continuous numeric fields. This allows you to pin specific minimum, midpoint, and maximum values for the color scale instead of using automatic data ranges.

Pinning these values is useful when you want to maintain consistent color mapping across multiple pie charts or ensure specific values always map to the same colors.

For full details on configuring gradient color scales, see [Gradient color scale values](/visualize-present/visualizations/configuration/color#gradient-color-scale-values).

### Inner Radius

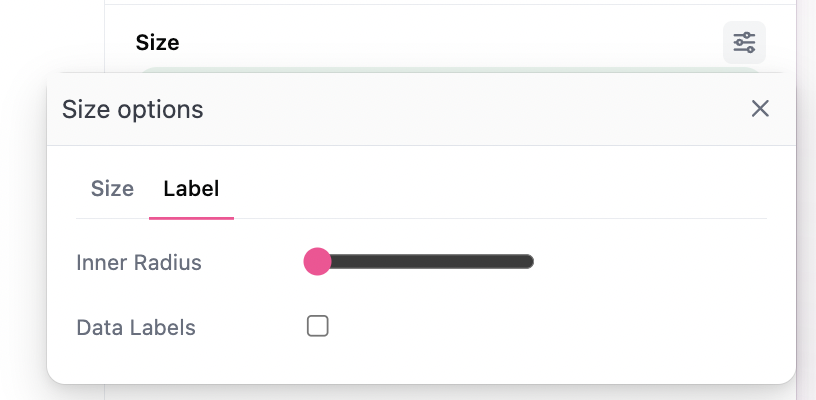
Inner radius will transform the chart between a filled-in pie chart and donut charts of varying thickness:
<img src="https://mintcdn.com/omni-e7402367/K4oAdi8TCvG1dpiF/images/docs/visualization-and-dashboards/visualization-types/assets/images/inner-radius-abfac2fffe7bebfcac5aae1af5c750ed.png?fit=max&auto=format&n=K4oAdi8TCvG1dpiF&q=85&s=47b1cbafa8605f2fb0e1fafe606e65c9" alt="" width="816" height="400" data-path="images/docs/visualization-and-dashboards/visualization-types/assets/images/inner-radius-abfac2fffe7bebfcac5aae1af5c750ed.png" />

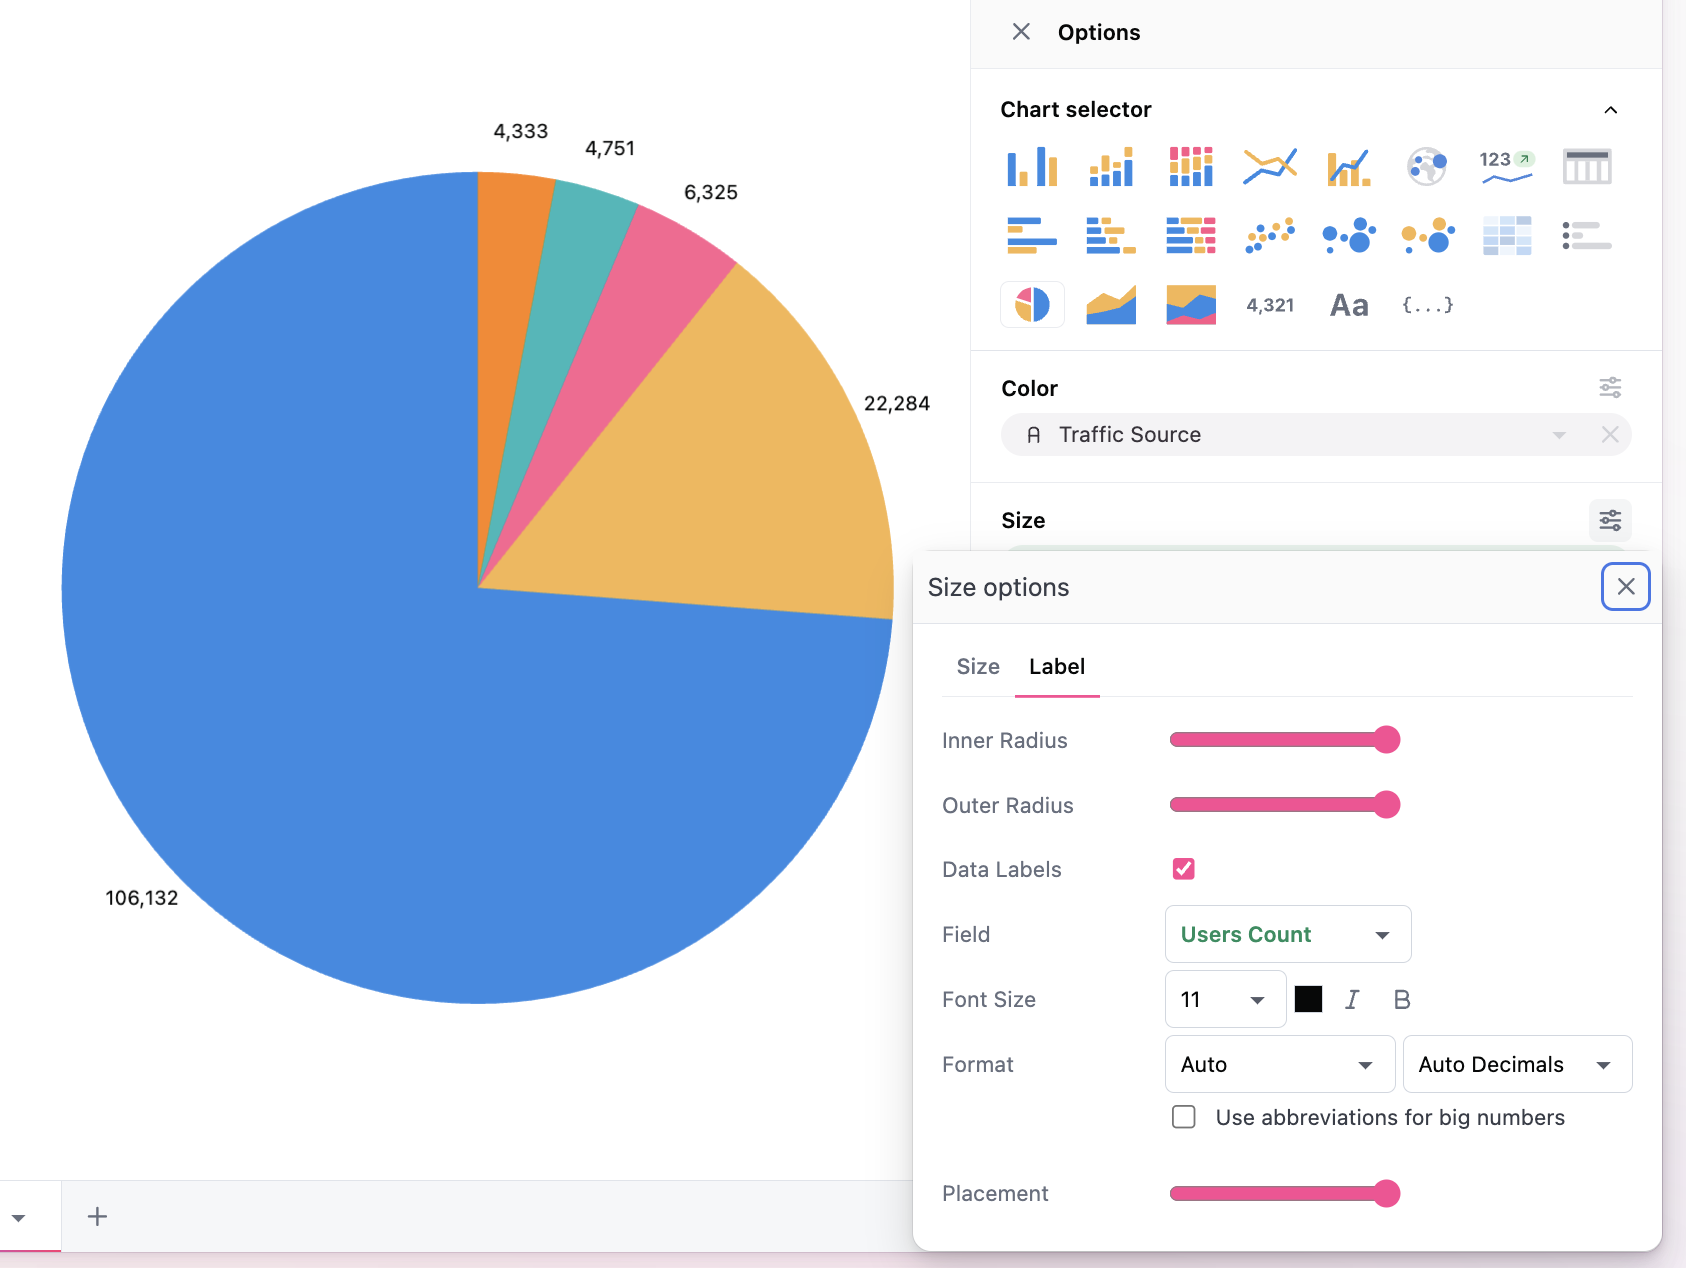
### Pie Labels

Labels are the only other pie-specific configuration available, including inner/outer radius controls, the series mapped to labels, and layout controls for where the label appears. The controls appear under size configuration as shown:
<img src="https://mintcdn.com/omni-e7402367/aZ84MHc8H0bDix_i/images/docs/visualization-and-dashboards/visualization-types/assets/images/pie-labels-0776d243fdafdf319d9c4ecb6c9425d0.png?fit=max&auto=format&n=aZ84MHc8H0bDix_i&q=85&s=77b0fd2999894ebf9de0a445d9b9421f" alt="" width="1686" height="1268" data-path="images/docs/visualization-and-dashboards/visualization-types/assets/images/pie-labels-0776d243fdafdf319d9c4ecb6c9425d0.png" />