> ## Documentation Index
> Fetch the complete documentation index at: https://docs.omni.co/llms.txt
> Use this file to discover all available pages before exploring further.
# Heatmap Charts
> Create heatmap visualizations in Omni to display data density and patterns using color gradients across two-dimensional grids.
## Examples
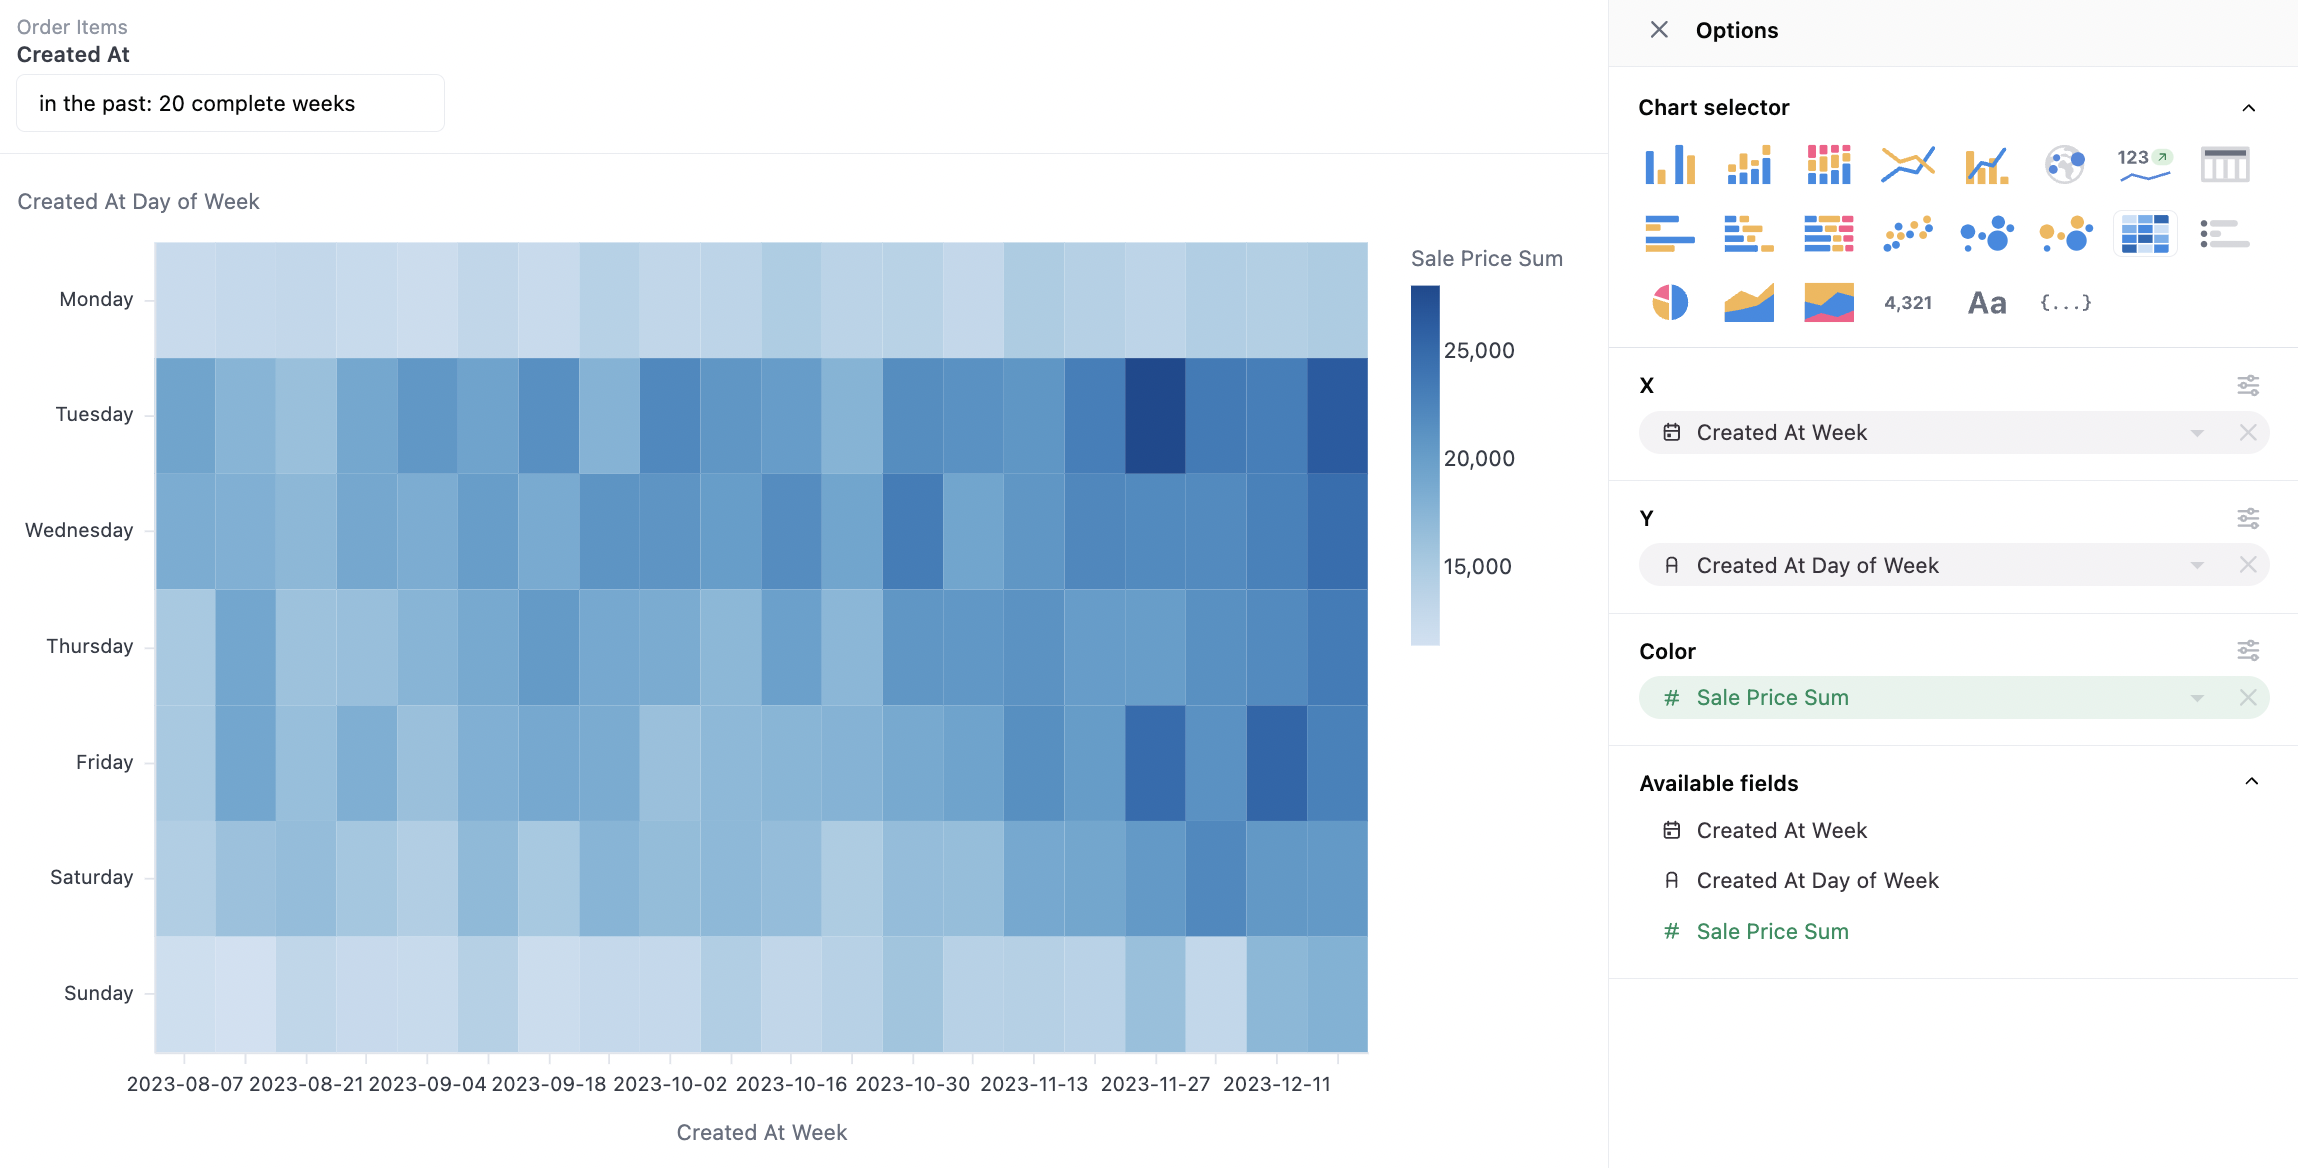
**Heatmap:**
 ## Data Structures
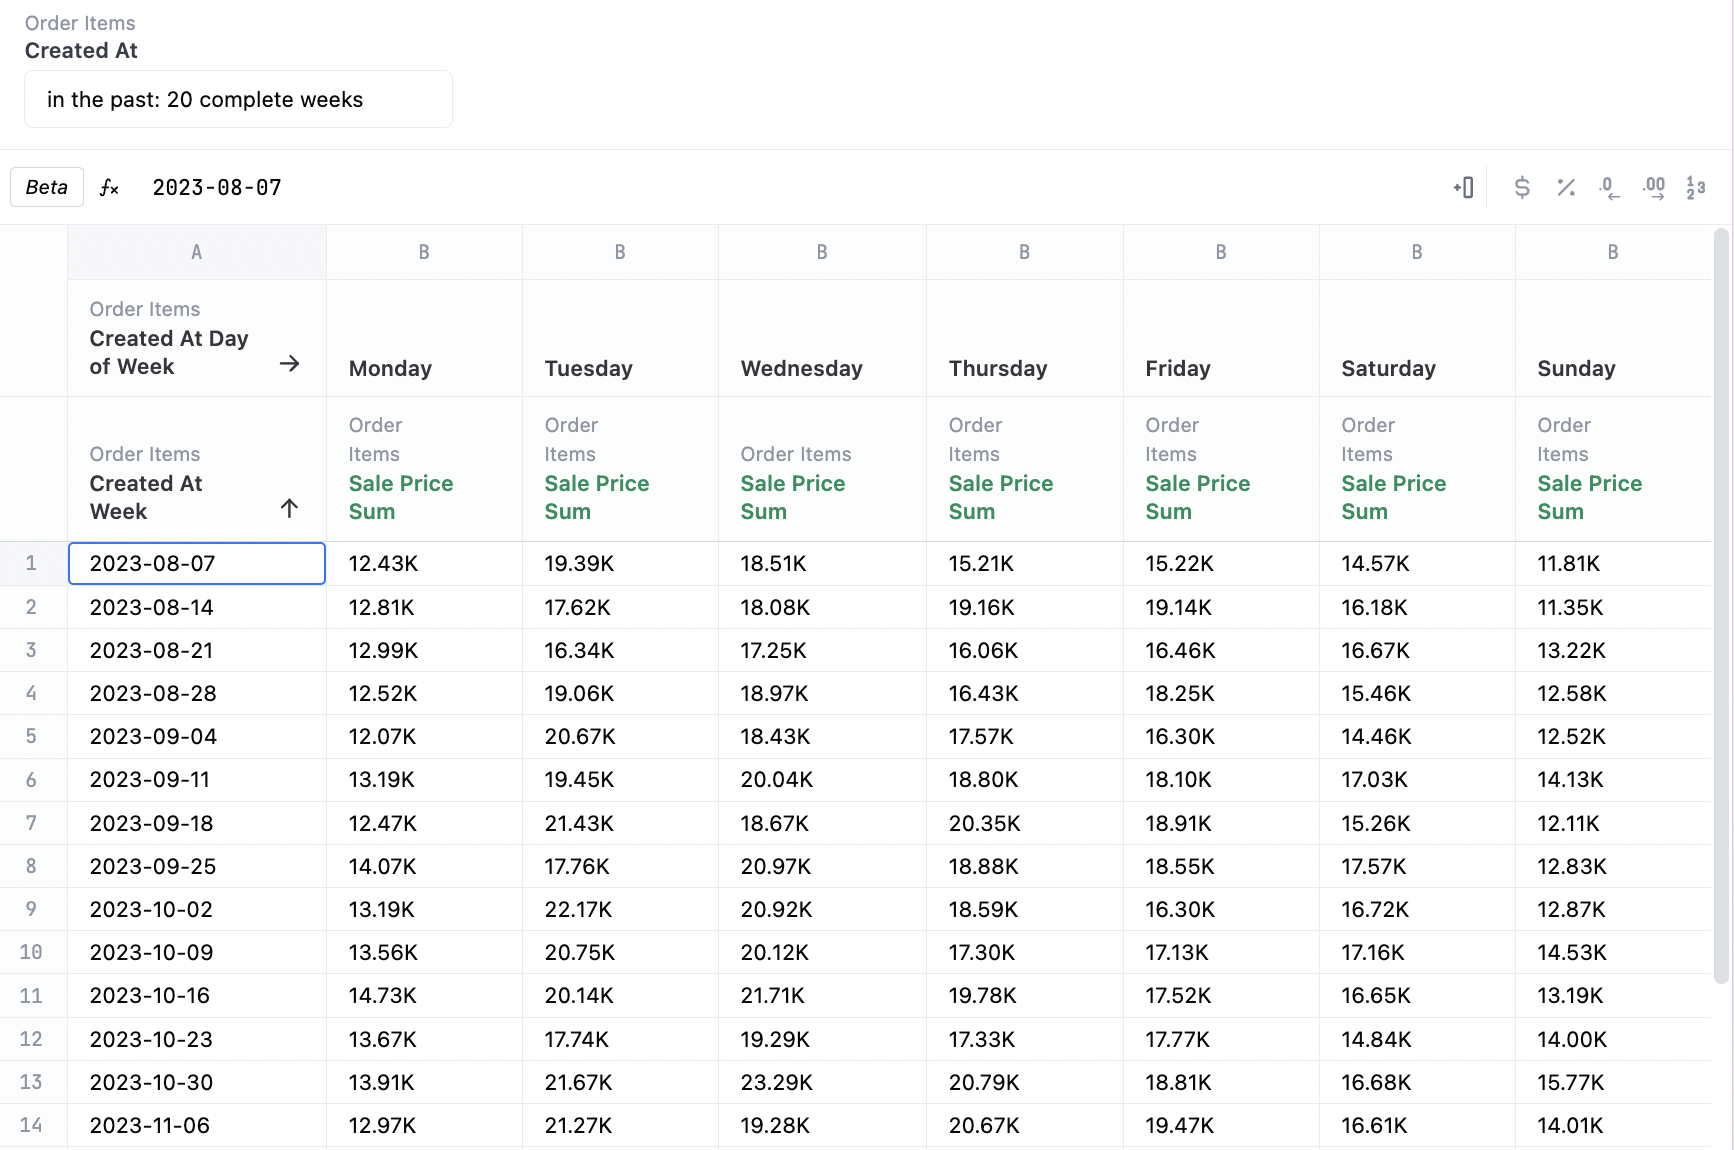
Heatmaps can work with pivoted or unpivoted data, using 2 dimensions and one measure, or with all dimensions where there is a numeric available for the color facet. They often use two time facets, for example:
* `date` & `hour_of_day`
* `week` & `day_of_week`
* `month` & `year`
## Data Structures
Heatmaps can work with pivoted or unpivoted data, using 2 dimensions and one measure, or with all dimensions where there is a numeric available for the color facet. They often use two time facets, for example:
* `date` & `hour_of_day`
* `week` & `day_of_week`
* `month` & `year`
 ## Configuration
There is no heatmap specific configuration, but [color](/visualize-present/visualizations/configuration/color) and [tooltip](/visualize-present/visualizations/configuration/tooltips) controls may be relevant.
## Configuration
There is no heatmap specific configuration, but [color](/visualize-present/visualizations/configuration/color) and [tooltip](/visualize-present/visualizations/configuration/tooltips) controls may be relevant.