> ## Documentation Index
> Fetch the complete documentation index at: https://docs.omni.co/llms.txt
> Use this file to discover all available pages before exploring further.
# Boxplots
> Create boxplot (box and whiskers) charts in Omni to visualize data distributions with quartiles, medians, and outliers.
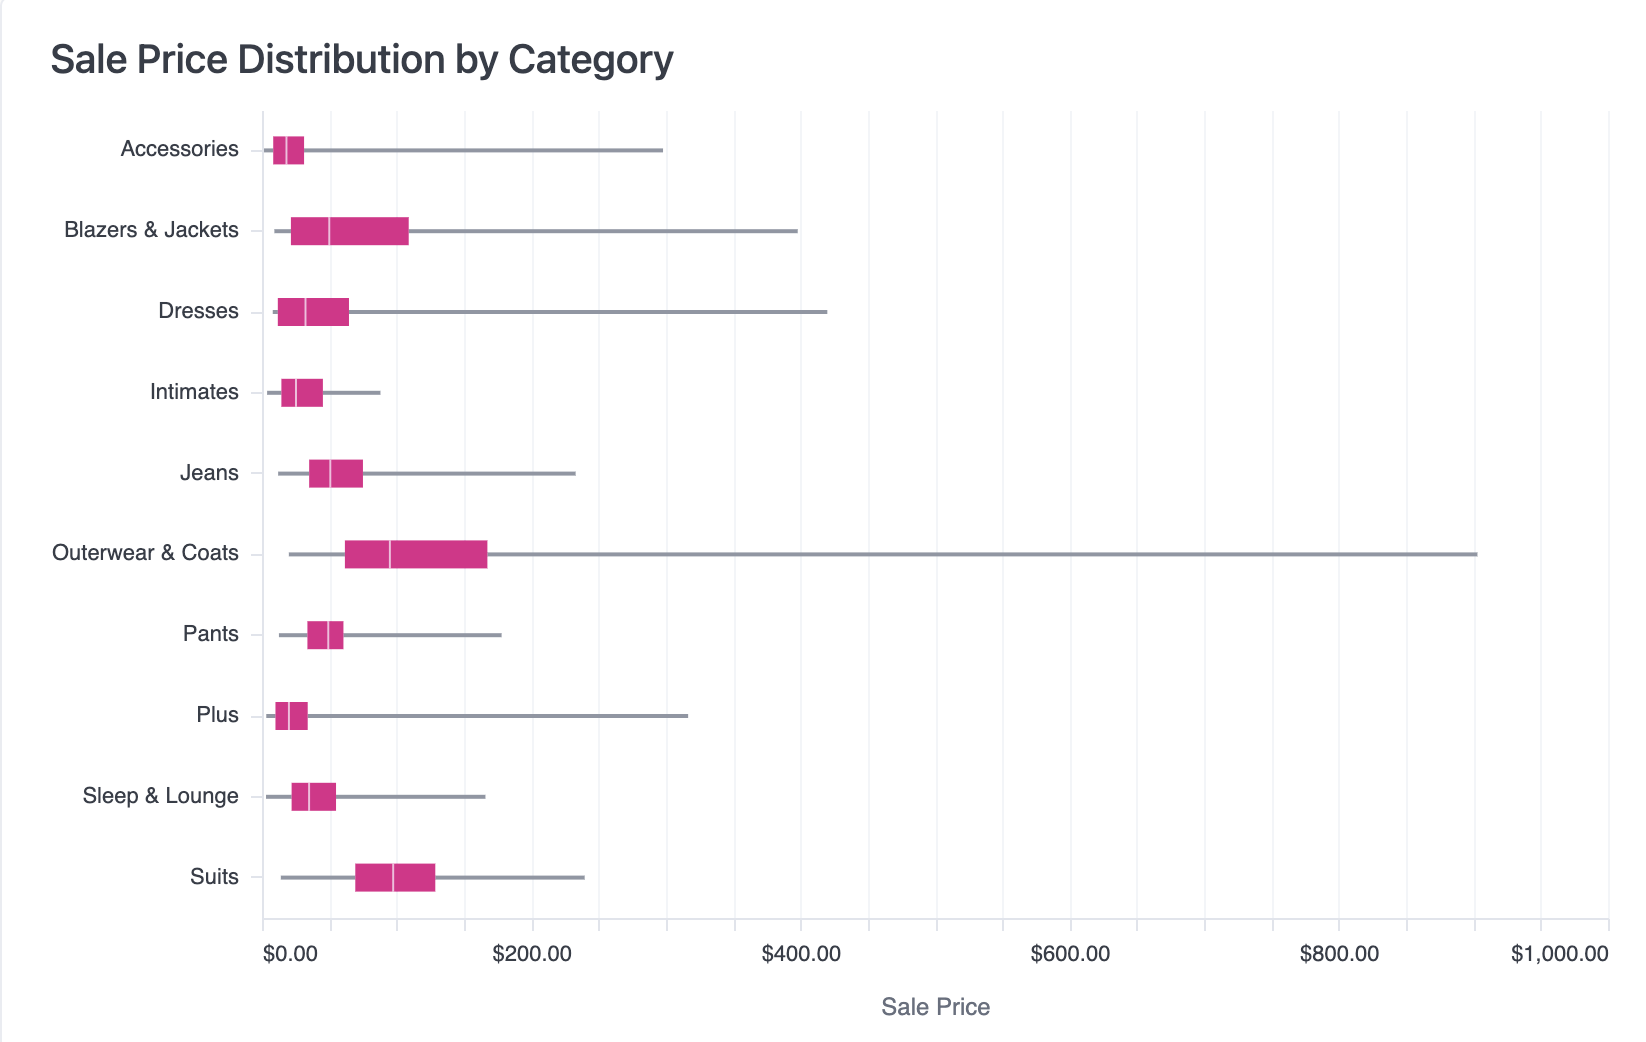
Boxplot charts are a versatile and efficient way to summarize and compare data across categories. Sometimes called a box and whiskers chart, each boxplot shows the distribution of the data in that category by charting its five-number summary:
* Minimum: start of the left whisker line
* First quartile (Q1): left-edge of the box
* Median (Q2): center line
* Third quartile (Q3): right edge of the box
* Maximum value: end of the right whisker line.
To configure a boxplot in Omni, your results should have a category on the y-axis and the unaggregated numeric values on the x-axis.
Looking to use dates within a Boxplot? You'll have to cast the date field to a string first!