> ## Documentation Index
> Fetch the complete documentation index at: https://docs.omni.co/llms.txt
> Use this file to discover all available pages before exploring further.
# Switch between the layers and classic editors
> Move an existing X/Y chart to layers, move a layered chart back to the classic editor, and learn what changes when you switch.
New X/Y charts use [layers](/visualize-present/visualizations/layers). X/Y charts that were created before layers keep the classic editor, which Omni calls the previous chart editor. You can move a chart between the two editors at any time.
## Requirements
* Layers must be turned on for your organization. To turn on layers, contact Omni support.
* The chart is an X/Y chart: bar, line, area, or scatter
* You can edit the workbook
## Move a chart to layers
Moving a chart to layers creates a copy of the tab. The original tab and chart don't change.
1. In the workbook, open the tab with the chart.
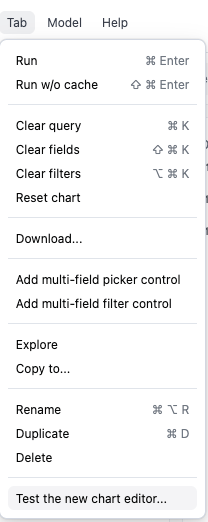
2. Click **Tab > Test the new chart editor...**.
 3. A preview dialog shows the **Current chart** above the **New chart editor** version, which uses layers. Compare the two.
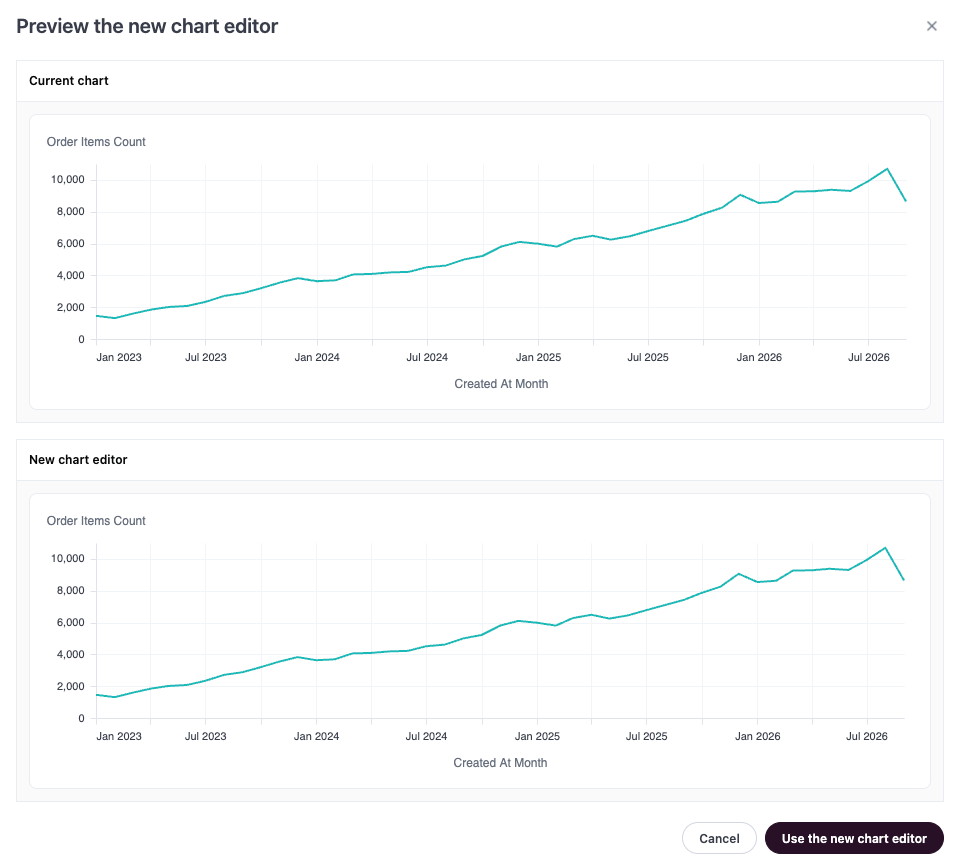 4. Click **Use the new chart editor**. Omni adds a copy of the tab that uses layers.
If **Test the new chart editor...** doesn't display in the **Tab** menu, the chart isn't an X/Y chart, already uses layers, or uses settings that layers can't show.
## Move a chart back to the classic editor
Moving a chart back changes the chart in place. It doesn't create a copy.
1. Open the tab with the layered chart.
2. Click **Tab > Leave the new chart editor...**.
3. Click **Leave new chart editor** to confirm.
4. Click **Use the new chart editor**. Omni adds a copy of the tab that uses layers.
If **Test the new chart editor...** doesn't display in the **Tab** menu, the chart isn't an X/Y chart, already uses layers, or uses settings that layers can't show.
## Move a chart back to the classic editor
Moving a chart back changes the chart in place. It doesn't create a copy.
1. Open the tab with the layered chart.
2. Click **Tab > Leave the new chart editor...**.
3. Click **Leave new chart editor** to confirm.
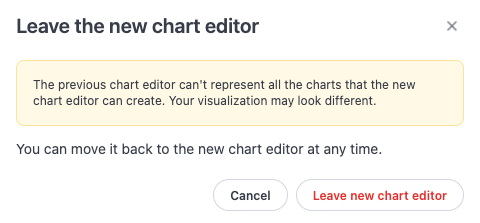 The classic editor can't show all the charts that layers can make, so the chart can look different. Refer to [What changes when you leave layers](#what-changes-when-you-leave-layers). To use layers again, click **Tab > Test the new chart editor...**, which creates a layered copy of the tab.
## What changes when you move to layers
* **Measures with the same mark can become one layer.** If every measure on the left axis uses the same mark, those measures become one [Measure values](/visualize-present/visualizations/layers/measure-names-values) layer, so that they stack or group as before. If the left axis doesn't qualify, Omni checks the right axis. The layer is colored by the chart's color field, or by **Measure names** if the chart had no color field. The layer keeps the stacking, the colors that you set by hand for each measure, and the **Simple totals** setting.
* **Only the first measure's labels and analytics are kept** for those measures. Data labels, regression lines, and moving averages on the other measures are removed.
* **Chart-wide settings move to each layer.** The chart's mark, color, size, and labels are copied to every layer.
* **Colors can change.** Layers use one [chart palette](/visualize-present/visualizations/layers#chart-palette) across all layers, so a chart with more than one layer can get different colors.
* **Legends and tooltips look different.** Legend symbols match the mark, and the tooltip on a line, area, or scatter layer displays when you hover near a point.
* **The X-axis order can change.** With **Automatic** sort, a text field on the X-axis follows the order of the query results.
## What changes when you leave layers
The classic editor has one color setting and one size setting for the whole chart. When you leave layers:
* A **Measure values** layer becomes one series for each measure. Each series gets the layer's labels, regression line, and moving average.
* Each measure keeps its mark and its labels.
* A color or size field stays only if every layer uses the same one. If the layers use different color or size fields, those settings don't display, and neither does the stacking that depends on them.
* **Measure names** on the X-axis has no equivalent in the classic editor, so the chart has no X-axis.
## Troubleshooting
Separate layers don't stack on each other. Put the measures in one [Measure values](/visualize-present/visualizations/layers/measure-names-values) layer, color the layer by **Measure names**, and set **Stacking** to **Stacked**.
Layers on one axis share the axis's scale. If one layer uses **Stacked %** and another layer on the same axis uses a different stacking option, the percentage layer draws on the other layer's scale. Use the same stacking option for every layer on the axis, or move one layer to the other axis.
Layers that color by the same field share one color setup. Refer to [One color setup per field](/visualize-present/visualizations/layers#one-color-setup-per-field).
**Size** is available only on **Scatter** layers. Changing the layer's mark removes the size setting.
Omni hides labels that overlap other labels. Turn on **Show all** in the layer's label options.
The layer doesn't use every dimension in the query. Refer to [Smart aggregation](/visualize-present/visualizations/layers/smart-aggregation).
## Next steps
* [Build X/Y charts with layers](/visualize-present/visualizations/layers)
* [Measure names and Measure values](/visualize-present/visualizations/layers/measure-names-values)
The classic editor can't show all the charts that layers can make, so the chart can look different. Refer to [What changes when you leave layers](#what-changes-when-you-leave-layers). To use layers again, click **Tab > Test the new chart editor...**, which creates a layered copy of the tab.
## What changes when you move to layers
* **Measures with the same mark can become one layer.** If every measure on the left axis uses the same mark, those measures become one [Measure values](/visualize-present/visualizations/layers/measure-names-values) layer, so that they stack or group as before. If the left axis doesn't qualify, Omni checks the right axis. The layer is colored by the chart's color field, or by **Measure names** if the chart had no color field. The layer keeps the stacking, the colors that you set by hand for each measure, and the **Simple totals** setting.
* **Only the first measure's labels and analytics are kept** for those measures. Data labels, regression lines, and moving averages on the other measures are removed.
* **Chart-wide settings move to each layer.** The chart's mark, color, size, and labels are copied to every layer.
* **Colors can change.** Layers use one [chart palette](/visualize-present/visualizations/layers#chart-palette) across all layers, so a chart with more than one layer can get different colors.
* **Legends and tooltips look different.** Legend symbols match the mark, and the tooltip on a line, area, or scatter layer displays when you hover near a point.
* **The X-axis order can change.** With **Automatic** sort, a text field on the X-axis follows the order of the query results.
## What changes when you leave layers
The classic editor has one color setting and one size setting for the whole chart. When you leave layers:
* A **Measure values** layer becomes one series for each measure. Each series gets the layer's labels, regression line, and moving average.
* Each measure keeps its mark and its labels.
* A color or size field stays only if every layer uses the same one. If the layers use different color or size fields, those settings don't display, and neither does the stacking that depends on them.
* **Measure names** on the X-axis has no equivalent in the classic editor, so the chart has no X-axis.
## Troubleshooting
Separate layers don't stack on each other. Put the measures in one [Measure values](/visualize-present/visualizations/layers/measure-names-values) layer, color the layer by **Measure names**, and set **Stacking** to **Stacked**.
Layers on one axis share the axis's scale. If one layer uses **Stacked %** and another layer on the same axis uses a different stacking option, the percentage layer draws on the other layer's scale. Use the same stacking option for every layer on the axis, or move one layer to the other axis.
Layers that color by the same field share one color setup. Refer to [One color setup per field](/visualize-present/visualizations/layers#one-color-setup-per-field).
**Size** is available only on **Scatter** layers. Changing the layer's mark removes the size setting.
Omni hides labels that overlap other labels. Turn on **Show all** in the layer's label options.
The layer doesn't use every dimension in the query. Refer to [Smart aggregation](/visualize-present/visualizations/layers/smart-aggregation).
## Next steps
* [Build X/Y charts with layers](/visualize-present/visualizations/layers)
* [Measure names and Measure values](/visualize-present/visualizations/layers/measure-names-values)