> ## Documentation Index
> Fetch the complete documentation index at: https://docs.omni.co/llms.txt
> Use this file to discover all available pages before exploring further.
# Smart aggregation
> Learn how layered charts add totals and subtotals to your query so that each layer plots correct values when it doesn't use every dimension.
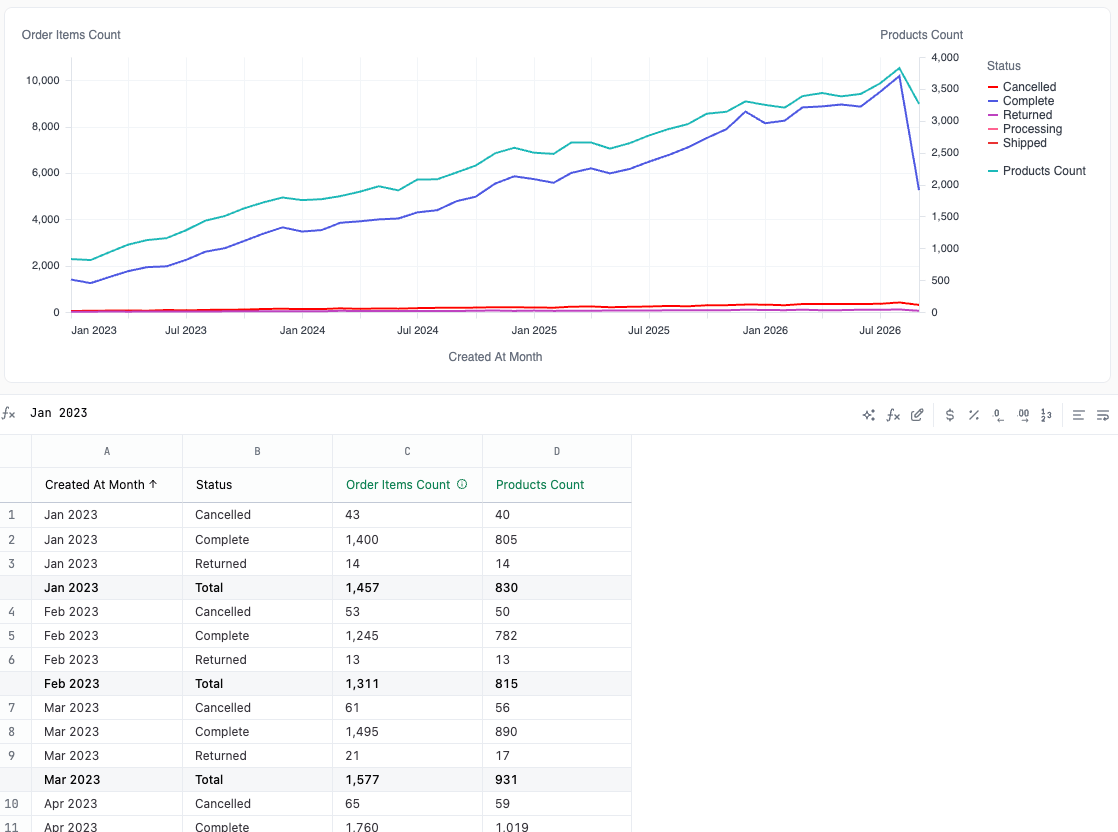
A query can have more dimensions than a layer uses. For example, a query has `Created At Month`, `Status`, `Order Items Count`, and `Products Count`. One layer plots `Order Items Count` colored by `Status`. Another layer plots `Products Count` as one line, without `Status`.
The `Products Count` layer needs one value for each month, but the query returns one row for each month and status. Smart aggregation gets the correct value for each month by adding totals to your query.
 ## How smart aggregation works
When a layer doesn't use every dimension in the query, Omni changes the query to get the totals that the layer needs:
* Omni adds [totals or subtotals](/analyze-explore/point-click-queries#column-totals) to the query. The layer plots the total rows. The layers that use every dimension plot the other rows.
* To get the correct totals, Omni can change the order of the grouped dimensions in the results table.
The totals come from your database. Omni doesn't add or average values in the browser, because a total calculated from rows in the browser can be wrong. For example, a count of distinct products isn't the sum of the counts for each status.
## What to expect
* **The query changes.** You see the added total rows and the new dimension order in the results table.
* **Omni adds only the totals that it needs.** If you remove totals from the query, Omni doesn't add them again unless a change to the chart or the query needs them.
* **Some layers can't get totals.** When Omni can't produce the totals it needs, the layer plots every row of the query. A line layer then looks jagged, because it has one point for each value of the unused dimension. This happens with:
* Two layers that each leave out a different dimension. For example, one layer is colored by `Country` and another layer is colored by `Gender`. Omni can get totals across `Gender` for the first layer or across `Country` for the second layer, but not both. One of the layers looks jagged.
* A dimension order that you set by hand in the results table
* A pivot whose order would need to change
* A [Measure values](/visualize-present/visualizations/layers/measure-names-values) layer
* Fields that aren't numbers
* **Layers can look jagged for a moment** while the query runs again with the new totals.
## Troubleshooting
The layer is plotting one point for each value of a dimension that it doesn't use. Check the results table for total rows. If there are none, try one of these options:
* Add the dimension to the layer, for example as its **Color**.
* Remove the dimension from the query.
* Change the dimension order in the results table back to the order that Omni set.
Each layer leaves out a different dimension, and the query can get totals across only one of them. For example, the `Order Items Count` layer is colored by `Country`, and the `Users Count` layer is colored by `Gender`. To get totals for both layers, [pivot](/analyze-explore/point-click-queries#pivoting) one of the two dimensions in the results table.
Smart aggregation added them for a layer that doesn't use every dimension. To remove them, give every layer the same dimensions, or remove the dimension that the layer doesn't use from the query.
## Next steps
* [Build X/Y charts with layers](/visualize-present/visualizations/layers)
* [Measure names and Measure values](/visualize-present/visualizations/layers/measure-names-values)
## How smart aggregation works
When a layer doesn't use every dimension in the query, Omni changes the query to get the totals that the layer needs:
* Omni adds [totals or subtotals](/analyze-explore/point-click-queries#column-totals) to the query. The layer plots the total rows. The layers that use every dimension plot the other rows.
* To get the correct totals, Omni can change the order of the grouped dimensions in the results table.
The totals come from your database. Omni doesn't add or average values in the browser, because a total calculated from rows in the browser can be wrong. For example, a count of distinct products isn't the sum of the counts for each status.
## What to expect
* **The query changes.** You see the added total rows and the new dimension order in the results table.
* **Omni adds only the totals that it needs.** If you remove totals from the query, Omni doesn't add them again unless a change to the chart or the query needs them.
* **Some layers can't get totals.** When Omni can't produce the totals it needs, the layer plots every row of the query. A line layer then looks jagged, because it has one point for each value of the unused dimension. This happens with:
* Two layers that each leave out a different dimension. For example, one layer is colored by `Country` and another layer is colored by `Gender`. Omni can get totals across `Gender` for the first layer or across `Country` for the second layer, but not both. One of the layers looks jagged.
* A dimension order that you set by hand in the results table
* A pivot whose order would need to change
* A [Measure values](/visualize-present/visualizations/layers/measure-names-values) layer
* Fields that aren't numbers
* **Layers can look jagged for a moment** while the query runs again with the new totals.
## Troubleshooting
The layer is plotting one point for each value of a dimension that it doesn't use. Check the results table for total rows. If there are none, try one of these options:
* Add the dimension to the layer, for example as its **Color**.
* Remove the dimension from the query.
* Change the dimension order in the results table back to the order that Omni set.
Each layer leaves out a different dimension, and the query can get totals across only one of them. For example, the `Order Items Count` layer is colored by `Country`, and the `Users Count` layer is colored by `Gender`. To get totals for both layers, [pivot](/analyze-explore/point-click-queries#pivoting) one of the two dimensions in the results table.
Smart aggregation added them for a layer that doesn't use every dimension. To remove them, give every layer the same dimensions, or remove the dimension that the layer doesn't use from the query.
## Next steps
* [Build X/Y charts with layers](/visualize-present/visualizations/layers)
* [Measure names and Measure values](/visualize-present/visualizations/layers/measure-names-values)