> ## Documentation Index
> Fetch the complete documentation index at: https://docs.omni.co/llms.txt
> Use this file to discover all available pages before exploring further.
# Build X/Y charts with layers
> Use layers to control the mark, stacking, color, size, and labels of each measure in a bar, line, area, or scatter chart.
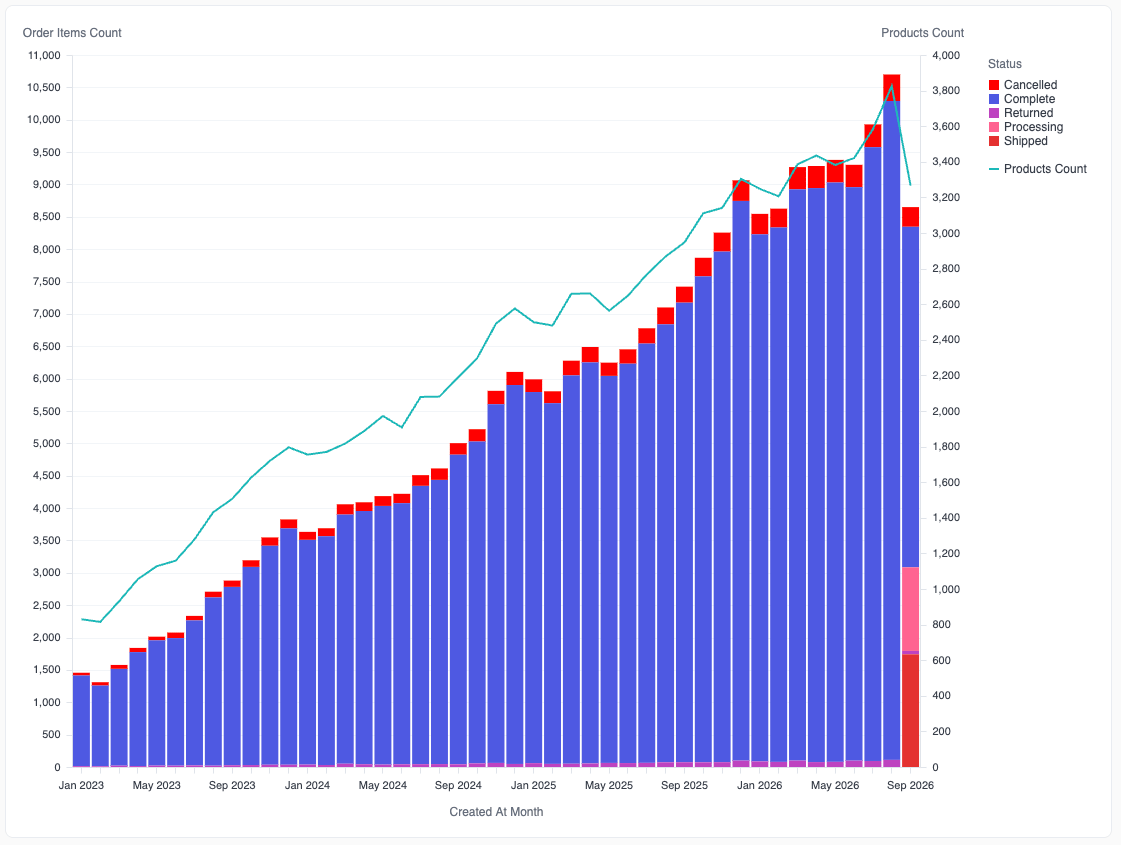
Layers give each measure in an X/Y chart its own settings. Every measure you plot on the left or right axis becomes a layer, and each layer has its own mark type, stacking, color, size, and labels. You can draw one measure as bars and another as a line, color one measure by a dimension and leave the other a single color, or put measures on separate axes with independent scales.
 ## Requirements
Layers must be turned on for your organization. To turn on layers, contact Omni support.
Layers apply to X/Y charts: bar, line, area, and scatter. Other chart types, such as tables, pie charts, and maps, don't use layers.
When enabled, new X/Y charts use layers automatically. Existing charts keep the classic editor until you move them to layers.
Refer to [Switch between the layers and classic editors](/visualize-present/visualizations/layers/switch-editors) to move an existing chart to layers, or to move a chart back.
## How layers work
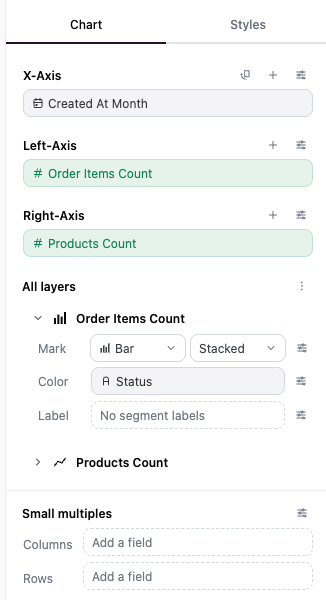
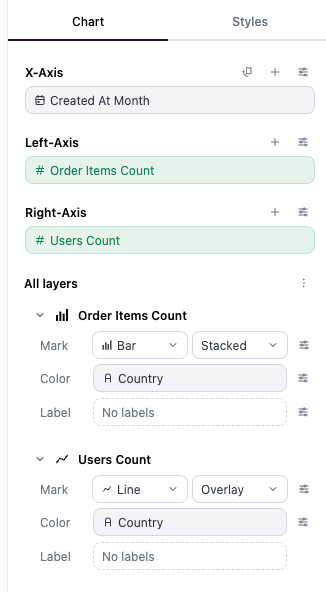
Each measure on the Y-axis is one layer. A chart with one Y-axis shows a single **Y-Axis** section. When you drag a field over it, or when the chart has a right axis, the section splits into **Left-Axis** and **Right-Axis**, and each axis has its own scale. The first layer in a list draws on top. Drag a layer by its handle to change the order.
A layer that stacks, such as a bar layer colored by `Status`, stacks only its own segments. Separate layers never stack on each other. To stack or group several measures together, put them in one [Measure values](/visualize-present/visualizations/layers/measure-names-values) layer.
## Chart options
When a chart uses layers, the **Chart options** panel has two tabs:
* **Chart** - The axes, the layers, Small multiples, Tooltip, Measure values, and Available fields
* **Styles** - The chart palette and the legends
## Requirements
Layers must be turned on for your organization. To turn on layers, contact Omni support.
Layers apply to X/Y charts: bar, line, area, and scatter. Other chart types, such as tables, pie charts, and maps, don't use layers.
When enabled, new X/Y charts use layers automatically. Existing charts keep the classic editor until you move them to layers.
Refer to [Switch between the layers and classic editors](/visualize-present/visualizations/layers/switch-editors) to move an existing chart to layers, or to move a chart back.
## How layers work
Each measure on the Y-axis is one layer. A chart with one Y-axis shows a single **Y-Axis** section. When you drag a field over it, or when the chart has a right axis, the section splits into **Left-Axis** and **Right-Axis**, and each axis has its own scale. The first layer in a list draws on top. Drag a layer by its handle to change the order.
A layer that stacks, such as a bar layer colored by `Status`, stacks only its own segments. Separate layers never stack on each other. To stack or group several measures together, put them in one [Measure values](/visualize-present/visualizations/layers/measure-names-values) layer.
## Chart options
When a chart uses layers, the **Chart options** panel has two tabs:
* **Chart** - The axes, the layers, Small multiples, Tooltip, Measure values, and Available fields
* **Styles** - The chart palette and the legends
 ### Add and change fields
You can drag fields to the axes and other sections. You can also use these controls:
* Click **+** in a section header, or click an empty **Add a field** slot, to pick a field from a list.
* Right-click a field, or open its menu, to use these options:
* **Field properties...** - Opens the field's title, format, and analytics settings, such as regression lines and moving averages
* **Aggregation** - Changes how the field aggregates
* **Switch to...** - Replaces the field with another field in place
* Click the **X** on a field to remove it.
### Layer settings
Each layer has these rows:
| Row | What it controls |
| --------- | --------------------------------------------------------------------------------------------------------------------------------------------- |
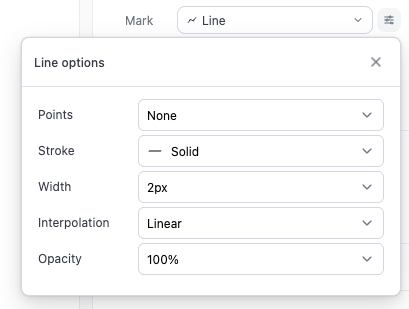
| **Mark** | The mark type: **Area**, **Bar**, **Line**, or **Scatter**. A **Stacking** select displays next to the mark when the layer has a color field. |
| **Color** | **Single color**, or a field that colors the layer's segments |
| **Size** | **Fixed size**, or a field that sets the size of each point. This row displays only for **Scatter** layers. |
| **Label** | The data labels for the layer. Pick any field to label the layer with it. |
Click the icon at the end of a row to open more options for that row.
### Add and change fields
You can drag fields to the axes and other sections. You can also use these controls:
* Click **+** in a section header, or click an empty **Add a field** slot, to pick a field from a list.
* Right-click a field, or open its menu, to use these options:
* **Field properties...** - Opens the field's title, format, and analytics settings, such as regression lines and moving averages
* **Aggregation** - Changes how the field aggregates
* **Switch to...** - Replaces the field with another field in place
* Click the **X** on a field to remove it.
### Layer settings
Each layer has these rows:
| Row | What it controls |
| --------- | --------------------------------------------------------------------------------------------------------------------------------------------- |
| **Mark** | The mark type: **Area**, **Bar**, **Line**, or **Scatter**. A **Stacking** select displays next to the mark when the layer has a color field. |
| **Color** | **Single color**, or a field that colors the layer's segments |
| **Size** | **Fixed size**, or a field that sets the size of each point. This row displays only for **Scatter** layers. |
| **Label** | The data labels for the layer. Pick any field to label the layer with it. |
Click the icon at the end of a row to open more options for that row.
 ### Change every layer at once
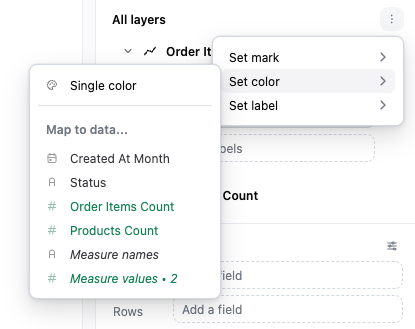
When a chart has two or more layers, an **All layers** header displays above them. Open the header's menu to set the same value on every layer.
A value set from **All layers** replaces the value on each layer.
### Change every layer at once
When a chart has two or more layers, an **All layers** header displays above them. Open the header's menu to set the same value on every layer.
A value set from **All layers** replaces the value on each layer.
 ## Stacking
A layer can stack when it has a color field. For a Measure values layer, the color field is usually **Measure names**. The **Stacking** select displays next to the layer's mark only when the layer has a color field.
| Option | Result | Available for |
| ------------- | ---------------------------------------------------- | ------------- |
| **Stacked** | Segments stack on top of each other | All marks |
| **Stacked %** | Segments stack and show each segment's share of 100% | All marks |
| **Grouped** | Segments display side by side | Bar |
| **Overlay** | Segments draw on top of each other | All marks |
Bar and area layers stack by default. Line and scatter layers overlay by default.
A chart with two or more measure layers and no color field overlays the layers. To stack the measures, move them into [Measure values](/visualize-present/visualizations/layers/measure-names-values).
### Stack order
For a **Stacked** or **Stacked %** layer, open the mark options to control the order of the segments:
* **Sort stack by** - The segment order:
* **Label** - Alphabetical by the color field's values
* **Segment value** - By each segment's value within its own stack. Not available for area or line layers.
* **Overall sum** - By each segment's total across all stacks
* **Unsorted** - The order of the query results
* **Sort order** - Ascending or descending, for example **Ascending (A to Z)** or **Descending (Z to A)**. This setting doesn't display for **Unsorted**.
## Stacking
A layer can stack when it has a color field. For a Measure values layer, the color field is usually **Measure names**. The **Stacking** select displays next to the layer's mark only when the layer has a color field.
| Option | Result | Available for |
| ------------- | ---------------------------------------------------- | ------------- |
| **Stacked** | Segments stack on top of each other | All marks |
| **Stacked %** | Segments stack and show each segment's share of 100% | All marks |
| **Grouped** | Segments display side by side | Bar |
| **Overlay** | Segments draw on top of each other | All marks |
Bar and area layers stack by default. Line and scatter layers overlay by default.
A chart with two or more measure layers and no color field overlays the layers. To stack the measures, move them into [Measure values](/visualize-present/visualizations/layers/measure-names-values).
### Stack order
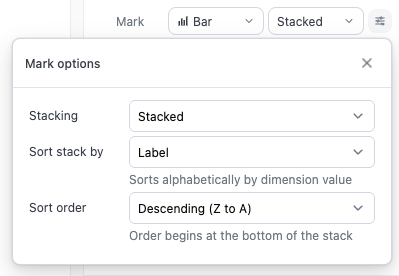
For a **Stacked** or **Stacked %** layer, open the mark options to control the order of the segments:
* **Sort stack by** - The segment order:
* **Label** - Alphabetical by the color field's values
* **Segment value** - By each segment's value within its own stack. Not available for area or line layers.
* **Overall sum** - By each segment's total across all stacks
* **Unsorted** - The order of the query results
* **Sort order** - Ascending or descending, for example **Ascending (A to Z)** or **Descending (Z to A)**. This setting doesn't display for **Unsorted**.
 ### Percentage axes
Layers on one axis share that axis's scale. The axis shows percentages only when every layer on it uses **Stacked %**. If you mix **Stacked %** with another option on one axis, a warning icon displays on the layer. The percentage layer's values run from 0 to 1 on the same scale as the other layers, so it's squashed at the bottom of the chart.
## Color and legends
### One color setup per field
Color settings belong to the field, not to the layer. If two layers color by `Country`, they share one set of colors and one legend. A change to the colors from one layer also changes the other layer.
### Percentage axes
Layers on one axis share that axis's scale. The axis shows percentages only when every layer on it uses **Stacked %**. If you mix **Stacked %** with another option on one axis, a warning icon displays on the layer. The percentage layer's values run from 0 to 1 on the same scale as the other layers, so it's squashed at the bottom of the chart.
## Color and legends
### One color setup per field
Color settings belong to the field, not to the layer. If two layers color by `Country`, they share one set of colors and one legend. A change to the colors from one layer also changes the other layer.
 ### Chart palette
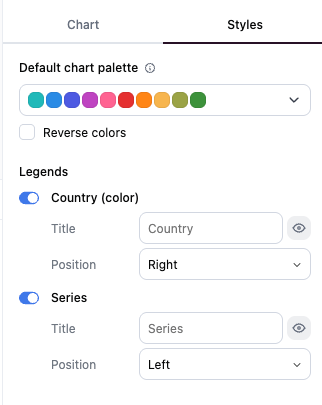
The **Styles** tab has the **Default chart palette** for the chart. All layers take colors from this palette unless a layer's color field has its own palette. Omni assigns palette colors in this order, so that layers don't duplicate colors:
1. Layers without a color field take the first colors, one each.
2. Each color field takes the next batch of colors, one for each of its values.
A color that you set by hand, or a color from the model's [`colors` parameter](/modeling/dimensions/parameters/colors), keeps its place and doesn't move the other colors.
### Legends
The **Styles** tab also lists each legend on the chart. A chart has one legend for each color field and each size field. When a chart has two or more layers, the layers without a color field share one **Series** legend, which has no title by default.
### Chart palette
The **Styles** tab has the **Default chart palette** for the chart. All layers take colors from this palette unless a layer's color field has its own palette. Omni assigns palette colors in this order, so that layers don't duplicate colors:
1. Layers without a color field take the first colors, one each.
2. Each color field takes the next batch of colors, one for each of its values.
A color that you set by hand, or a color from the model's [`colors` parameter](/modeling/dimensions/parameters/colors), keeps its place and doesn't move the other colors.
### Legends
The **Styles** tab also lists each legend on the chart. A chart has one legend for each color field and each size field. When a chart has two or more layers, the layers without a color field share one **Series** legend, which has no title by default.
 #### Filter with the legend
Legends in the chart are interactive. Click an item in a legend to show only that item. Cmd+click (Mac) or Ctrl+click (Windows) to select more than one item. When you select items in one legend, layers that belong to other legends are hidden until you clear the selection.
## Labels and totals
Labels are set per layer. Pick a field in a layer's **Label** row to label that layer. The field doesn't have to be the layer's measure.
For a stacked layer, the label options include **Simple totals**, which labels the total of each stack. Simple totals are calculated per layer. To total several measures, put them in one Measure values layer and turn on **Simple totals** for that layer.
#### Filter with the legend
Legends in the chart are interactive. Click an item in a legend to show only that item. Cmd+click (Mac) or Ctrl+click (Windows) to select more than one item. When you select items in one legend, layers that belong to other legends are hidden until you clear the selection.
## Labels and totals
Labels are set per layer. Pick a field in a layer's **Label** row to label that layer. The field doesn't have to be the layer's measure.
For a stacked layer, the label options include **Simple totals**, which labels the total of each stack. Simple totals are calculated per layer. To total several measures, put them in one Measure values layer and turn on **Simple totals** for that layer.
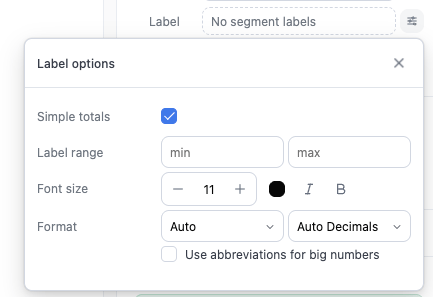 Omni hides labels that overlap, and labels on bars often overlap. If labels are missing, turn on **Show all** in the layer's label options.
## Tooltips
On line, area, and scatter layers, the tooltip displays when you hover near a point, and the point is highlighted.
## Axis sort order
For a text field on the X-axis:
* **Automatic** keeps the order of the query results when the query is sorted.
* **Ascending** sorts alphabetically.
* **Descending** sorts in reverse alphabetical order.
## Limitations
* Separate layers don't stack on each other. Use [Measure values](/visualize-present/visualizations/layers/measure-names-values) to stack measures.
* Each color field has one set of colors for the whole chart. You can't color the same field differently in two layers.
* Layers on one axis share the axis's scale and title.
* Two layers that each leave out a different dimension can't both get totals. One of them looks jagged. Refer to [Smart aggregation](/visualize-present/visualizations/layers/smart-aggregation#what-to-expect).
* **Size** is available only on **Scatter** layers. If you change a scatter layer to another mark, its size setting is removed.
## Next steps
* [Measure names and Measure values](/visualize-present/visualizations/layers/measure-names-values)
* [Smart aggregation](/visualize-present/visualizations/layers/smart-aggregation)
* [Switch between the layers and classic editors](/visualize-present/visualizations/layers/switch-editors)
* [Build visualizations with AI](/ai/visualizations)
Omni hides labels that overlap, and labels on bars often overlap. If labels are missing, turn on **Show all** in the layer's label options.
## Tooltips
On line, area, and scatter layers, the tooltip displays when you hover near a point, and the point is highlighted.
## Axis sort order
For a text field on the X-axis:
* **Automatic** keeps the order of the query results when the query is sorted.
* **Ascending** sorts alphabetically.
* **Descending** sorts in reverse alphabetical order.
## Limitations
* Separate layers don't stack on each other. Use [Measure values](/visualize-present/visualizations/layers/measure-names-values) to stack measures.
* Each color field has one set of colors for the whole chart. You can't color the same field differently in two layers.
* Layers on one axis share the axis's scale and title.
* Two layers that each leave out a different dimension can't both get totals. One of them looks jagged. Refer to [Smart aggregation](/visualize-present/visualizations/layers/smart-aggregation#what-to-expect).
* **Size** is available only on **Scatter** layers. If you change a scatter layer to another mark, its size setting is removed.
## Next steps
* [Measure names and Measure values](/visualize-present/visualizations/layers/measure-names-values)
* [Smart aggregation](/visualize-present/visualizations/layers/smart-aggregation)
* [Switch between the layers and classic editors](/visualize-present/visualizations/layers/switch-editors)
* [Build visualizations with AI](/ai/visualizations)