> ## Documentation Index
> Fetch the complete documentation index at: https://docs.omni.co/llms.txt
> Use this file to discover all available pages before exploring further.
# Y-axis (left axis / right axis)
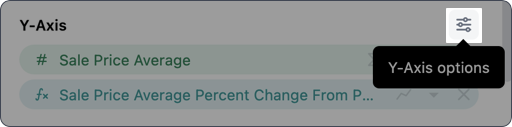
> To access the configuration options for the Y-axis, click the (configuration options) icon to the right of the label:
 ## Options
These settings control only the axis itself. To customize the [series mapped to the axis](/visualize-present/visualizations/configuration/series-configuration), use the dropdown next to the series/field.
The settings in the **Y-Axis** tab control the title, type, domain, scale, and stacking of the axis.
### Axis types
The **Type** setting controls the type of Y-axis used in the visualization. Omni will select a default axis type depending on the data in the query, but you can override it using this setting.
**Note**: Depending on the selected type, some settings - such as domain and scale - may become unavailable.
## Labels
The settings in the **Labels** tab allow you to customize how labels associated with the Y-axis display in the visualization:
* **Show labels** - If enabled, labels will display on the Y-axis
* **Show axis line** - If enabled, a line representing the Y-axis will display
* **Show ticks** - If enabled, ticks will display along the Y-axis
* **Font** - Options for customizing the styling and color of Y-axis labels
When selecting axis colors, note that there aren't separate settings for light and dark mode.
The default palette will adjust colors based on the selected mode - such as a dark axis in light mode - but when explicitly defined, the color you select will be used in both light and dark mode.
* **Format** - Defines the format Y-axis labels use, such as the number of decimals for numbers
* **Label rotation** - Controls the degree of rotation for Y-axis labels
* **Ticks** - Controls the number of ticks that display between labels
## Reference lines
## Options
These settings control only the axis itself. To customize the [series mapped to the axis](/visualize-present/visualizations/configuration/series-configuration), use the dropdown next to the series/field.
The settings in the **Y-Axis** tab control the title, type, domain, scale, and stacking of the axis.
### Axis types
The **Type** setting controls the type of Y-axis used in the visualization. Omni will select a default axis type depending on the data in the query, but you can override it using this setting.
**Note**: Depending on the selected type, some settings - such as domain and scale - may become unavailable.
## Labels
The settings in the **Labels** tab allow you to customize how labels associated with the Y-axis display in the visualization:
* **Show labels** - If enabled, labels will display on the Y-axis
* **Show axis line** - If enabled, a line representing the Y-axis will display
* **Show ticks** - If enabled, ticks will display along the Y-axis
* **Font** - Options for customizing the styling and color of Y-axis labels
When selecting axis colors, note that there aren't separate settings for light and dark mode.
The default palette will adjust colors based on the selected mode - such as a dark axis in light mode - but when explicitly defined, the color you select will be used in both light and dark mode.
* **Format** - Defines the format Y-axis labels use, such as the number of decimals for numbers
* **Label rotation** - Controls the degree of rotation for Y-axis labels
* **Ticks** - Controls the number of ticks that display between labels
## Reference lines
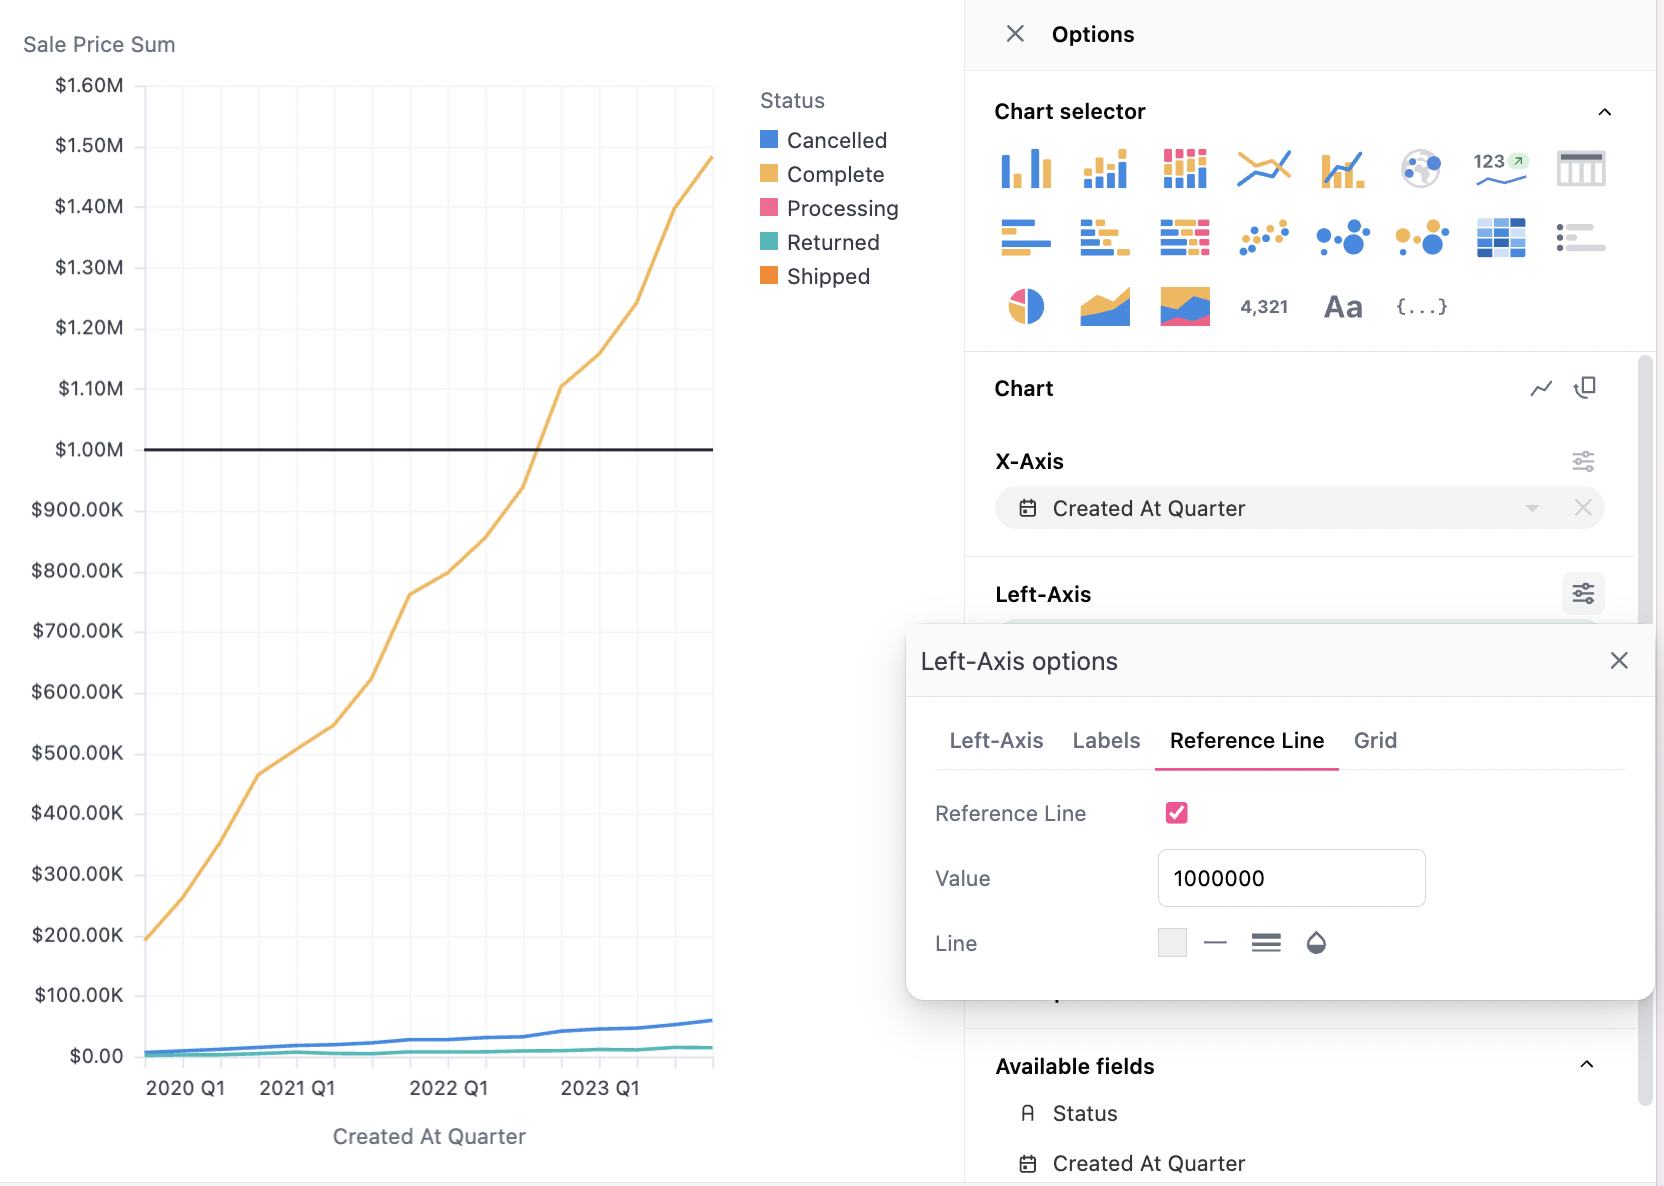 Settings in the **Reference line** tab allow you to define a reference line, which is a quick way to set targets on a chart. There is limited configuration for these, so more complex use cases may be better served with table calculations as a regular, independent series.
## Grid
Settings in the **Grid** tab control if and how grid lines display in the background of the visualization.
## Vega-lite options
Long-tail axis configuration is available in the [Vega-lite spec](https://vega.github.io/vega-lite/docs/axis.html).
Settings in the **Reference line** tab allow you to define a reference line, which is a quick way to set targets on a chart. There is limited configuration for these, so more complex use cases may be better served with table calculations as a regular, independent series.
## Grid
Settings in the **Grid** tab control if and how grid lines display in the background of the visualization.
## Vega-lite options
Long-tail axis configuration is available in the [Vega-lite spec](https://vega.github.io/vega-lite/docs/axis.html).