> ## Documentation Index
> Fetch the complete documentation index at: https://docs.omni.co/llms.txt
> Use this file to discover all available pages before exploring further.
# Series configuration
> Configure individual chart series in Omni, including chart type, axis assignment, label formatting, and data display options.
Each series / field offers configuration in addition to the axis configuration. In this area the data itself can be controlled (vs the axis or facet like color). To configure the or generally follow the corresponding settings.
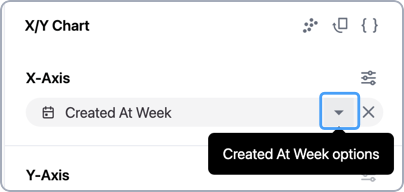
To access the configuration menu, click the **caret** to the left of the `X` in either an X-axis or Y-axis field in the **Chart Options**:
 ## X-Axis series configuration
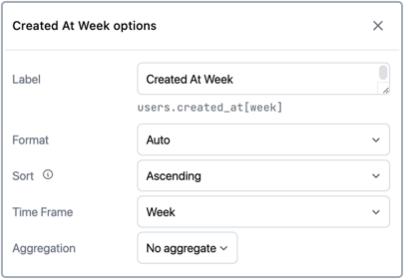 The X-Axis configuration offers controls for the label (which mirrors the x-axis label controls). Additional configuration is available for formatting of values (number, percentage, currency, and integer) as well as number of decimals. By default series will mirror formatting in the results table (auto).
## Y-Axis series configuration
The X-Axis configuration offers controls for the label (which mirrors the x-axis label controls). Additional configuration is available for formatting of values (number, percentage, currency, and integer) as well as number of decimals. By default series will mirror formatting in the results table (auto).
## Y-Axis series configuration
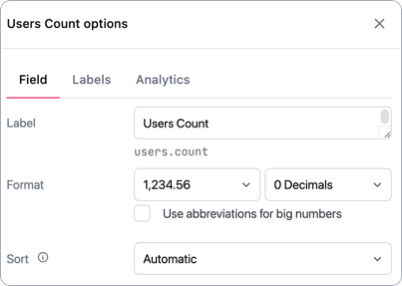 The y-axis configuration will mirror the x-axis configuration with additional controls for labeling data points and trendlines.
### Visualization data labels
The y-axis configuration will mirror the x-axis configuration with additional controls for labeling data points and trendlines.
### Visualization data labels
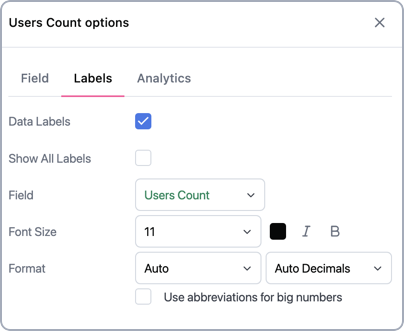 The **Labels** tab contains configuration options for data labels, which display as values above each point in the graph.
To make the labels more dense, check the **Show all labels** box.
By default, points are labeled with the series in use, but can also reference other fields (ie. labeling a measure-measure XY scatterplot with data labels for the dimension).
Position will move the label vis-a-vis the data point (by default overlaid).
### Trendlines / moving average / regression lines
The **Labels** tab contains configuration options for data labels, which display as values above each point in the graph.
To make the labels more dense, check the **Show all labels** box.
By default, points are labeled with the series in use, but can also reference other fields (ie. labeling a measure-measure XY scatterplot with data labels for the dimension).
Position will move the label vis-a-vis the data point (by default overlaid).
### Trendlines / moving average / regression lines
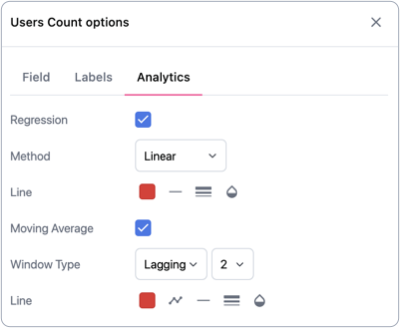 The **Analytics** tab contains configuration options for adding moving averages to charts or regression lines. **Note**: Displaying the regression formula or r-squared isn't currently supported.
**For moving averages,** the trend line will mirror the order in the table when toggling between center and lagging, so for desired behavior the table may need to be resorted.
**For more custom trendlines and moving averages,** it's recommended to build [calculations](/analyze-explore/calculations) in the results table.
The **Analytics** tab contains configuration options for adding moving averages to charts or regression lines. **Note**: Displaying the regression formula or r-squared isn't currently supported.
**For moving averages,** the trend line will mirror the order in the table when toggling between center and lagging, so for desired behavior the table may need to be resorted.
**For more custom trendlines and moving averages,** it's recommended to build [calculations](/analyze-explore/calculations) in the results table.