> ## Documentation Index
> Fetch the complete documentation index at: https://docs.omni.co/llms.txt
> Use this file to discover all available pages before exploring further.

# Preview mode

> Test how your dashboard will behave for viewers without leaving the editor.

export const CheckIcon = ({label}) => {
  return <span>
      <Icon icon="circle-check" iconType="solid" color="#26bd6c" />
      {label && ` ${label}`}
    </span>;
};

export const XCircleIcon = ({label}) => {
  return <span>
      <Icon icon="circle-xmark" iconType="solid" color="#ff2465" />
      {label && ` ${label}`}
    </span>;
};

export const MarkdownVariablesIcon = ({label}) => {
  return <span>
      <svg stroke="currentColor" fill="none" stroke-width="2" viewBox="0 0 24 24" stroke-linecap="round" stroke-linejoin="round" height="1em" width="1em" xmlns="http://www.w3.org/2000/svg" style={{
    display: "inline",
    verticalAlign: "middle"
  }}><path d="M3 12v-7a2 2 0 0 1 2 -2h14a2 2 0 0 1 2 2v14a2 2 0 0 1 -2 2h-7"></path><path d="M3 10h18"></path><path d="M10 3v10"></path><path d="M2 17a1 1 0 0 1 1 -1h4a1 1 0 0 1 1 1v4a1 1 0 0 1 -1 1h-4a1 1 0 0 1 -1 -1v-4z"></path></svg>
    </span>;
};

export const DashboardIcon = ({label}) => {
  return <span>
      <svg fill="none" height="1em" strokeWidth="2" viewBox="0 0 24 24" width="1em" xmlns="http://www.w3.org/2000/svg" style={{
    display: "inline",
    verticalAlign: "middle"
  }}><path d="M12.5625 3V21M12 9.75H3M21 15.375H12.5625M7 21H17C19.2091 21 21 19.2091 21 17V7C21 4.79086 19.2091 3 17 3H7C4.79086 3 3 4.79086 3 7V17C3 19.2091 4.79086 21 7 21Z" stroke="currentColor"></path></svg>
      {label && ` ${label}`}
    </span>;
};

export const WorkbookIcon = ({label}) => {
  return <span>
      <svg fill="none" height="1em" stroke-width="2" viewBox="0 0 24 24" width="1em" xmlns="http://www.w3.org/2000/svg" style={{
    display: "inline",
    verticalAlign: "middle"
  }}><path d="M9.1875 3V15.375M21 15.375H3M7 21H17C19.2091 21 21 19.2091 21 17V7C21 4.79086 19.2091 3 17 3H7C4.79086 3 3 4.79086 3 7V17C3 19.2091 4.79086 21 7 21Z" stroke="currentColor"></path></svg>
      {label && ` ${label}`}
    </span>;
};

export const WorkbookNumberFormatIcon = ({label}) => {
  return <span>
      <svg stroke="currentColor" fill="none" stroke-width="2" viewBox="0 0 30 30" stroke-linecap="round" stroke-linejoin="round" height="1.75em" width="1.75em" xmlns="http://www.w3.org/2000/svg" style={{
    display: "inline",
    verticalAlign: "middle"
  }}><path d="M8 10v-7l-2 2"></path><path d="M6 16a2 2 0 1 1 4 0c0 .591 -.601 1.46 -1 2l-3 3h4"></path><path d="M15 14a2 2 0 1 0 2 -2a2 2 0 1 0 -2 -2"></path><path d="M6.5 10h3"></path></svg>
    </span>;
};

export const DashboardPreviewIcon = ({label}) => {
  return <span>
      <svg stroke="currentColor" fill="none" stroke-width="2" viewBox="0 0 24 24" stroke-linecap="round" stroke-linejoin="round" height="1em" width="1em" xmlns="http://www.w3.org/2000/svg" style={{
    display: "inline",
    verticalAlign: "middle"
  }}><path d="M3 16m0 1a1 1 0 0 1 1 -1h3a1 1 0 0 1 1 1v3a1 1 0 0 1 -1 1h-3a1 1 0 0 1 -1 -1z"></path><path d="M4 12v-6a2 2 0 0 1 2 -2h12a2 2 0 0 1 2 2v12a2 2 0 0 1 -2 2h-6"></path><path d="M12 8h4v4"></path><path d="M16 8l-5 5"></path></svg>
    </span>;
};

export const DashboardCatalogIcon = ({label}) => {
  return <span>
      <svg stroke="currentColor" fill="none" stroke-width="2" viewBox="0 0 24 24" stroke-linecap="round" stroke-linejoin="round" height="1em" width="1em" xmlns="http://www.w3.org/2000/svg" style={{
    display: "inline",
    verticalAlign: "middle"
  }}><path d="M10 19h-6a1 1 0 0 1 -1 -1v-14a1 1 0 0 1 1 -1h6a2 2 0 0 1 2 2a2 2 0 0 1 2 -2h6a1 1 0 0 1 1 1v14a1 1 0 0 1 -1 1h-6a2 2 0 0 0 -2 2a2 2 0 0 0 -2 -2z"></path><path d="M12 5v16"></path><path d="M7 7h1"></path><path d="M7 11h1"></path><path d="M16 7h1"></path><path d="M16 11h1"></path><path d="M16 15h1"></path></svg>
      {label && ` ${label}`}
    </span>;
};

export const DashboardAddItemIcon = ({label}) => {
  return <span>
      <svg stroke="currentColor" fill="none" stroke-width="2" viewBox="0 0 24 24" stroke-linecap="round" stroke-linejoin="round" height="1em" width="1em" xmlns="http://www.w3.org/2000/svg" style={{
    display: "inline",
    verticalAlign: "middle"
  }}><path d="M4 4m0 1a1 1 0 0 1 1 -1h4a1 1 0 0 1 1 1v4a1 1 0 0 1 -1 1h-4a1 1 0 0 1 -1 -1z"></path><path d="M4 14m0 1a1 1 0 0 1 1 -1h4a1 1 0 0 1 1 1v4a1 1 0 0 1 -1 1h-4a1 1 0 0 1 -1 -1z"></path><path d="M14 14m0 1a1 1 0 0 1 1 -1h4a1 1 0 0 1 1 1v4a1 1 0 0 1 -1 1h-4a1 1 0 0 1 -1 -1z"></path><path d="M14 7l6 0"></path><path d="M17 4l0 6"></path></svg>
      {label && ` ${label}`}
    </span>;
};

export const DashboardControlIcon = ({label}) => {
  return <span>
      <svg stroke="currentColor" fill="none" stroke-width="2" viewBox="0 0 24 24" stroke-linecap="round" stroke-linejoin="round" height="1em" width="1em" xmlns="http://www.w3.org/2000/svg" style={{
    display: "inline",
    verticalAlign: "middle"
  }}><path d="M3 3m0 3a3 3 0 0 1 3 -3h12a3 3 0 0 1 3 3v12a3 3 0 0 1 -3 3h-12a3 3 0 0 1 -3 -3z"></path><path d="M3 11l8 -8"></path><path d="M3 17l14 -14"></path></svg>
      {label && ` ${label}`}
    </span>;
};

export const DashboardChartIcon = ({label}) => {
  return <span>
      <svg stroke="currentColor" fill="none" stroke-width="2" viewBox="0 0 24 24" stroke-linecap="round" stroke-linejoin="round" height="1em" width="1em" xmlns="http://www.w3.org/2000/svg" style={{
    display: "inline",
    verticalAlign: "middle"
  }}><path d="M3 3v18h18"></path><path d="M20 18v3"></path><path d="M16 16v5"></path><path d="M12 13v8"></path><path d="M8 16v5"></path><path d="M3 11c6 0 5 -5 9 -5s3 5 9 5"></path></svg>
      {label && ` ${label}`}
    </span>;
};

export const DashboardLayoutIcon = ({label}) => {
  return <span>
      <svg stroke="currentColor" fill="none" stroke-width="2" viewBox="0 0 24 24" stroke-linecap="round" stroke-linejoin="round" height="1em" width="1em" xmlns="http://www.w3.org/2000/svg" style={{
    display: "inline",
    verticalAlign: "middle"
  }}><path d="M4 7l16 0"></path><path d="M4 17l16 0"></path><path d="M7 4l0 16"></path><path d="M17 4l0 16"></path></svg>
      {label && ` ${label}`}
    </span>;
};

export const DashboardTextIcon = ({label}) => {
  return <span>
      <svg stroke="currentColor" fill="none" stroke-width="2" viewBox="0 0 24 24" stroke-linecap="round" stroke-linejoin="round" height="1em" width="1em" xmlns="http://www.w3.org/2000/svg" style={{
    display: "inline",
    verticalAlign: "middle"
  }}><path d="M4 20l3 0"></path><path d="M14 20l7 0"></path><path d="M6.9 15l6.9 0"></path><path d="M10.2 6.3l5.8 13.7"></path><path d="M5 20l6 -16l2 0l7 16"></path></svg>
      {label && ` ${label}`}
    </span>;
};

export const DashboardStackContainerIcon = ({label}) => {
  return <span>
      <svg width="1em" height="1em" viewBox="0 0 24 24" fill="none" xmlns="http://www.w3.org/2000/svg" style={{
    display: "inline",
    verticalAlign: "middle"
  }}><path d="M4 5C4 4.73478 4.10536 4.48043 4.29289 4.29289C4.48043 4.10536 4.73478 4 5 4H19C19.2652 4 19.5196 4.10536 19.7071 4.29289C19.8946 4.48043 20 4.73478 20 5V9C20 9.26522 19.8946 9.51957 19.7071 9.70711C19.5196 9.89464 19.2652 10 19 10H5C4.73478 10 4.48043 9.89464 4.29289 9.70711C4.10536 9.51957 4 9.26522 4 9V5Z" stroke="currentColor" stroke-width="2" stroke-linecap="round" stroke-linejoin="round"></path><path d="M4 15C4 14.7348 4.10536 14.4804 4.29289 14.2929C4.48043 14.1054 4.73478 14 5 14H12C12.2652 14 12.5196 14.1054 12.7071 14.2929C12.8946 14.4804 13 14.7348 13 15V19C13 19.2652 12.8946 19.5196 12.7071 19.7071C12.5196 19.8946 12.2652 20 12 20H5C4.73478 20 4.48043 19.8946 4.29289 19.7071C4.10536 19.5196 4 19.2652 4 19V15Z" stroke="currentColor" stroke-width="2" stroke-linecap="round" stroke-linejoin="round"></path></svg>
      {label && ` ${label}`}
    </span>;
};

export const DashboardPageNavIcon = ({label}) => {
  return <span>
      <svg stroke="currentColor" fill="none" stroke-width="2" viewBox="0 0 24 24" stroke-linecap="round" stroke-linejoin="round" height="1em" width="1em" xmlns="http://www.w3.org/2000/svg" style={{
    display: "inline",
    verticalAlign: "middle"
  }}><path d="M4 8h16"></path><path d="M4 4m0 2a2 2 0 0 1 2 -2h12a2 2 0 0 1 2 2v12a2 2 0 0 1 -2 2h-12a2 2 0 0 1 -2 -2z"></path><path d="M8 4v4"></path></svg>
      {label && ` ${label}`}
    </span>;
};

export const IdeFileIcon = ({color = "#000000"}) => {
  return <span>
      <svg stroke={color} fill="none" stroke-width="2" viewBox="0 0 24 24" stroke-linecap="round" stroke-linejoin="round" class="file-type-icon" height="1em" width="1em" xmlns="http://www.w3.org/2000/svg" style={{
    display: "inline",
    verticalAlign: "middle"
  }}><path d="M3 5a2 2 0 0 1 2 -2h14a2 2 0 0 1 2 2v14a2 2 0 0 1 -2 2h-14a2 2 0 0 1 -2 -2v-14z"></path><path d="M3 10h18"></path><path d="M10 3v18"></path></svg>
    </span>;
};

<Note>
  **Using a classic dashboard?** [Upgrade it](/visualize-present/dashboards/create#classic-dashboards) to use the features in this guide.
</Note>

Preview mode lets you see how your dashboard will behave for viewers without leaving the editor. When you enter preview mode, editing controls hide and viewer interactions like drilling, cross-filtering, and pagination become active.

## Requirements

Accessing preview mode requires **Editor**, **Manager**, or **Owner** permissions on the document.

## Entering preview mode

To enter preview mode while editing a dashboard:

<Steps>
  <Step noAnchor>
    Click the **Edit** button on the dashboard to enter draft mode.
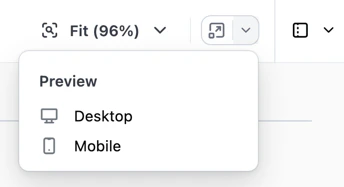
  </Step>

  <Step noAnchor>
    Click the <DashboardPreviewIcon /> icon in the toolbar:

    <img src="https://mintcdn.com/omni-e7402367/s5I10vNau_8RNFgz/visualize-present/images/preview-mode-selector.png?fit=max&auto=format&n=s5I10vNau_8RNFgz&q=85&s=22f5419ba604f3a75a39efdf4eb1bb6d" alt="" width="344" height="187" data-path="visualize-present/images/preview-mode-selector.png" />
  </Step>

  <Step noAnchor>
    Select an option:

    * **Desktop** - Shows how the dashboard will render on desktop screens
    * **Mobile** - Shows how the dashboard will render on small screens
  </Step>
</Steps>

## Exiting preview mode

To exit preview mode and return to editing, click the **Exit preview** button in the preview banner at the top of the page.

You'll be returned to the editor with your state intact — selections, unsaved edits, and other editor state are all preserved.

## Preview mode vs. View As user

Unlike preview mode, the [View As user](/visualize-present/dashboards/view-as) feature lets you test how specific users will experience the dashboard based on their [user attributes](/administration/users/attributes) and access permissions.

Use preview mode to test the viewer experience of your dashboard layout and interactions. Use View As user to test how the dashboard adapts to different users' permissions and attributes.

## Next steps

* Learn to [build dashboard layouts](/visualize-present/dashboards/containers-items) with containers and items like charts, text, filters, and controls.
* Customize [page navigation](/visualize-present/dashboards/page-navigation) to control how viewers move between pages.
* Test how your dashboard appears to specific users with [View As user](/visualize-present/dashboards/view-as).
