> ## Documentation Index
> Fetch the complete documentation index at: https://docs.omni.co/llms.txt
> Use this file to discover all available pages before exploring further.
# Building dashboard layouts with containers and items
> Organize charts, text, filters, and controls inside grid or stack containers for precise positioning.
export const DashboardPageNavIcon = ({label}) => {
return
{label && ` ${label}`}
;
};
export const DashboardStackContainerIcon = ({label}) => {
return
{label && ` ${label}`}
;
};
export const DashboardTextIcon = ({label}) => {
return
{label && ` ${label}`}
;
};
export const DashboardLayoutIcon = ({label}) => {
return
{label && ` ${label}`}
;
};
export const DashboardChartIcon = ({label}) => {
return
{label && ` ${label}`}
;
};
export const DashboardControlIcon = ({label}) => {
return
{label && ` ${label}`}
;
};
export const DashboardCatalogIcon = ({label}) => {
return
{label && ` ${label}`}
;
};
export const DashboardAddItemIcon = ({label}) => {
return
{label && ` ${label}`}
;
};
export const DashboardPlaceholderIcon = ({label}) => {
return
{label && ` ${label}`}
;
};
export const WorkbookIcon = ({label}) => {
return
{label && ` ${label}`}
;
};
**Using a classic dashboard?** [Upgrade it](/visualize-present/dashboards/create#classic-dashboards) to use the features in this guide.
Dashboards are built from two components:
* **Items** — The charts, text, filters, and controls you place on the dashboard
* **Containers** — The regions that hold and arrange items
Containers can be nested inside other containers, letting you group related items, control spacing, and build structured layouts that go beyond the flat grid of a classic dashboard.
## Requirements
Modifying dashboard layouts requires **Editor**, **Manager**, or **Owner** permissions on the document.
Working with containers
When you create a new dashboard or upgrade from a [classic dashboard](/visualize-present/dashboards/create#classic-dashboards), your existing items are placed into an initial container. From there, you can add more containers, configure how each arranges its items, and nest containers inside one another to shape your dashboard.
Selecting a layout type
When you add a container to your dashboard, you choose between two layout types:
| Type | Description | Best for |
| ----------------------------------------- | -------------------------------------------------------------------- | ------------------------------------------------------------- |
| **Grid** | Free-form positioning; items can be placed at any position | Precise control over each item's position |
| **Stack** | Arrange items in columns or rows; you control spacing and alignment. | Structured sections such as a row of filters, a sidebar, etc. |
To add a container, click **Add > Layout** and select a layout type.
**Stack layout settings**
In stack containers, you can control:
* **Direction** - `column` (vertical) or `row` (horizontal)
* **Gap** - Spacing between items
* **Padding** - Spacing inside the container edges
* **Wrap** - Controls whether items wrap to new lines when they exceed the container width (Yes = wrap, No = nowrap)
* **Align** - How items align perpendicular to the direction (start, center, end, stretch)
* **Justify** - How items are distributed along the direction (start, center, end, space between)
### Naming containers
Each container can have a name to help you identify it while editing. To rename a container, select it and edit the **Name** field in the properties panel on the right side of the screen.
### Nesting containers
Containers can be placed inside other containers to build nested layouts. For example, place a stack container (set to row direction) inside a grid container to create a horizontal row of filters within a larger free-form layout.
### Resizing items in stack containers
Resize handles are currently only available for items in **column** stacks. Row stacks do not support manual resizing yet.
Items within column stack containers can be resized by dragging resize handles, similar to resizing items in grid containers. This allows you to set specific dimensions for individual items while maintaining the automatic flow of the stack layout.
Select the item you want to resize. Resize handles will display around the selected item.
Drag a resize handle to adjust the item's dimensions.
Release to apply the new size.
Resized items are sized in pixel values with a minimum size of 12px. Changes are previewed live as you drag and committed when you release the mouse.
To remove custom sizing, right-click the item and select **Reset sizing**. This removes all explicit sizing properties (width, height, and min/max constraints) and returns the item to its default automatic size.
Locking container arrangements
You can lock a container to prevent its contents from being rearranged. Containers are unlocked by default until you explicitly lock them.
When a container is locked:
* Items inside the locked container cannot be dragged, reordered, resized, or have new items dropped into the container
* All child containers are also locked, preventing any rearrangement throughout the nested structure
* The locked container can still be moved and resized if its parent container is unlocked
#### Locking a container
Select the container you want to lock.
In the properties panel on the right, locate the icon.
Click the icon to lock the container.
When you select an item inside a locked container, you'll see a lock indicator in the properties panel along with a message explaining that items in locked containers cannot be rearranged.
#### Unlocking a container
To unlock a container and allow its contents to be rearranged again, select the locked container and then click the icon in the properties panel.
Adding and organizing items
Items can be added automatically — new queries from the workbook are placed on the first page, and page navigation appears when you create multiple pages — or manually from the dashboard's **Add** menu.
From there, you can move items between [containers](#containers), browse them in the **Catalog**, and edit their configuration without leaving the layout editor.
Dashboards currently support the following item types:
| Type | Description |
| -------------------------------------------- | ----------------------------------------------------------------------------------------------------------------------------------- |
| **Charts** | [Visualizations](/visualize-present/dashboards/charts) from your workbook queries |
| **Text** | Formatted text using [Markdown](/visualize-present/dashboards/text-markdown) |
| **Filters** | [Interactive filters](/visualize-present/dashboards/filters) that control chart data |
| **Controls** | [Field controls](/visualize-present/dashboards/controls) that dynamically switch chart fields |
| **Page navigation** | Inline page switcher for [multi-page dashboards](/visualize-present/dashboards/page-navigation) |
| **Placeholder** | Wireframe element showing [placeholder content](/visualize-present/dashboards/placeholders) for queries, filters, controls, or text |
| **Spacer** | Empty layout element for adding spacing between items |
| **Divider** | Separator line for creating visual divisions between items |
### Adding items to a dashboard
Click **Add** in the toolbar to insert any item, a [layout container](#layout-type), or a new page.
Page navigation is automatically added when you create a second [dashboard page](/visualize-present/dashboards/pages), but you can also add it manually from the **Layout** submenu to place additional navigation or customize its position.
As pages are top-level elements, they can only be added from the toolbar **Add** menu, not from the **Add child** button in the properties panel.
### Browsing items in the catalog
The catalog is a browsable library of all available items on your dashboard. Click the **Catalog** button in the toolbar to open it.
The catalog displays items in two groups:
* **Controls & filters** - All dashboard filters and controls, sorted alphabetically
* **Queries** - Charts and query visualizations
Use the search field at the top of the catalog to filter items by name. To place an item, click it in the catalog and then select the target container from the menu that appears.
The catalog is useful for finding items that haven't been placed yet or for quickly moving items into a specific container without selecting them on the canvas first.
New queries added to the workbook are automatically placed on the first page. If a query has been deleted, use the catalog to find and re-add it to the dashboard.
### Placing items in containers
There are several ways to place items into a container:
#### From the catalog
1. Click the **Catalog** button in the toolbar.
2. Find the item you want to place. Use search to filter by name.
3. Click the item.
4. Select the target container from the placement menu.
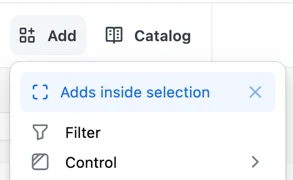
Quickly add an item into an existing container by selecting the container and then using the **Add** or **Catalog** menus. You'll see an **Adds inside selection** option in the dropdown menu:
To instead add the item to the page root, click the icon.
#### Using the properties panel
1. Select the item you want to place on the canvas.
2. In the properties panel on the right, click **Place** (for unplaced items) or **Move** (for items already in a container).
3. A menu will appear showing all available containers.
4. Click the target container to move the item into it.
#### Repositioning items
You can drag items to reposition them within a container or move them between containers. This works for all [container layout types](#layout-type).
| Within a... | Description |
| ------------------------------------------------------------- | ----------------------------------------------------------------------------------------------------------------------------------------------------------------------------------- |
| **Grid container** | Drag items to any position and resize by dragging their edges |
| **Stack container** | Drag items up or down (in column direction) or left and right (in row direction) to reorder them within the stack |
| **Between containers** | Drag items from one container to another, regardless of container layout type. This lets you quickly reorganize your dashboard layout without using the catalog or properties panel |
While dragging, Omni provides visual cues to help you place items:
* Containers that can accept the item show a **colored outline** when you hover over them
* Stack containers show a **drop indicator line** at the insertion point where the item will be placed
* The container you're dragging from shows an outline to indicate the active drag operation
#### Unplaced items
To re-add items to the dashboard, use the **Catalog**.
### Aligning filters and controls with tiles
When you place filters or controls directly on the page root alongside tile containers, Omni automatically applies a **Tile align** preset to ensure visual alignment. This preset adds padding to the filter or control that matches the outer spacing of tile containers, so they align cleanly as siblings on the grid.
#### Automatic preset behavior
The tile-align preset is only available for filters and controls. Charts and text items are not eligible for this preset.
The tile-align preset is managed automatically based on where you place the item:
* **Auto-applied** — When you drag a filter or control into the page root grid (outside of any container), the preset is automatically applied
* **Auto-cleared** — When you move a filter or control into a tile container, the preset is automatically removed to prevent double spacing
When the preset is applied, Omni automatically adjusts the item's grid height (+1 unit) to account for the additional padding.
#### Manually changing the preset
To manually control the preset:
1. Select the filter or control on the canvas.
2. In the properties panel on the right, locate the **Preset** dropdown.
3. Select **Tile align** to apply the preset, or **None** to remove it.
Duplicating containers and items
Duplication is not available for:
* Pages - Use the [duplicate page](/visualize-present/dashboards/pages#duplicate-page) action instead
* Filter and control items
Duplicate existing containers and items to quickly create copies with the same configuration and styling.
You can duplicate a container or item in three ways:
* **Context menu** - Right-click the container or item and select **Duplicate**
* **Properties panel** - Select the container or item, then click the menu icon in the properties panel header and select **Duplicate**
* **Keyboard shortcut** - Select the container or item and press `⌘` + `D` (Mac) or `Ctrl` + `D` (Windows)
Where the duplicate appears depends on the parent container type:
| Parent container | Placement |
| ----------------------------------------- | ----------------------------------------------------------------------------------------------------------------------- |
| **Stack** | The duplicate is inserted immediately after the original item |
| **Grid** | The duplicate is placed directly below the original with the same dimensions, pushing down any items that would collide |
## Accessing the properties panel
When the properties panel is closed, right-click on a dashboard item and select **Edit** from the context menu to open it.
You can also use keyboard shortcuts (`⌘` + `\` on Mac, `Ctrl` + `\` on Windows) to open the properties panel.
## Undoing and redoing layout changes
Only layout changes can be undone. This includes actions like adding, moving, or resizing containers and items, or adjusting container properties.
When editing a dashboard, you can undo and redo layout changes using the **Edit** menu, toolbar buttons, or keyboard shortcuts:
* **Edit menu** - Click **Edit** > **Undo** or **Edit** > **Redo**
* **Toolbar** - Click the (undo) or (redo) icons in the editing toolbar
* **Keyboard shortcuts** - Press `⌘Z` (Mac) or `Ctrl+Z` (Windows) to undo, `⇧⌘Z` (Mac) or `⇧Ctrl+Z` (Windows) to redo
### History clearing
Your undo/redo history is automatically cleared when you make non-layout changes to the dashboard, such as:
* Renaming the dashboard or items
* Editing filter configurations
* Updating query definitions
* Changing dashboard settings
After a non-layout change, you won't be able to undo past that point. This ensures that layout changes and content changes remain independent and prevents conflicts between different types of edits.
## Next steps
* Use [pages](/visualize-present/dashboards/pages) to create multi-page dashboards, where each page has its own layout, items, and filters.
* Customize [page navigation](/visualize-present/dashboards/page-navigation) to control how viewers move between pages, including custom tabs and dynamic labels.
* Configure [filters](/visualize-present/dashboards/filter-display-options) to display filters as button toggles, multi-select dropdowns, single-day pickers, and timeframe controls.
 To instead add the item to the page root, click the