> ## Documentation Index
> Fetch the complete documentation index at: https://docs.omni.co/llms.txt
> Use this file to discover all available pages before exploring further.

# Test result cards

> Build test result card visualizations using Markdown in Omni to display consistently sized charts across tests with varying ranges.

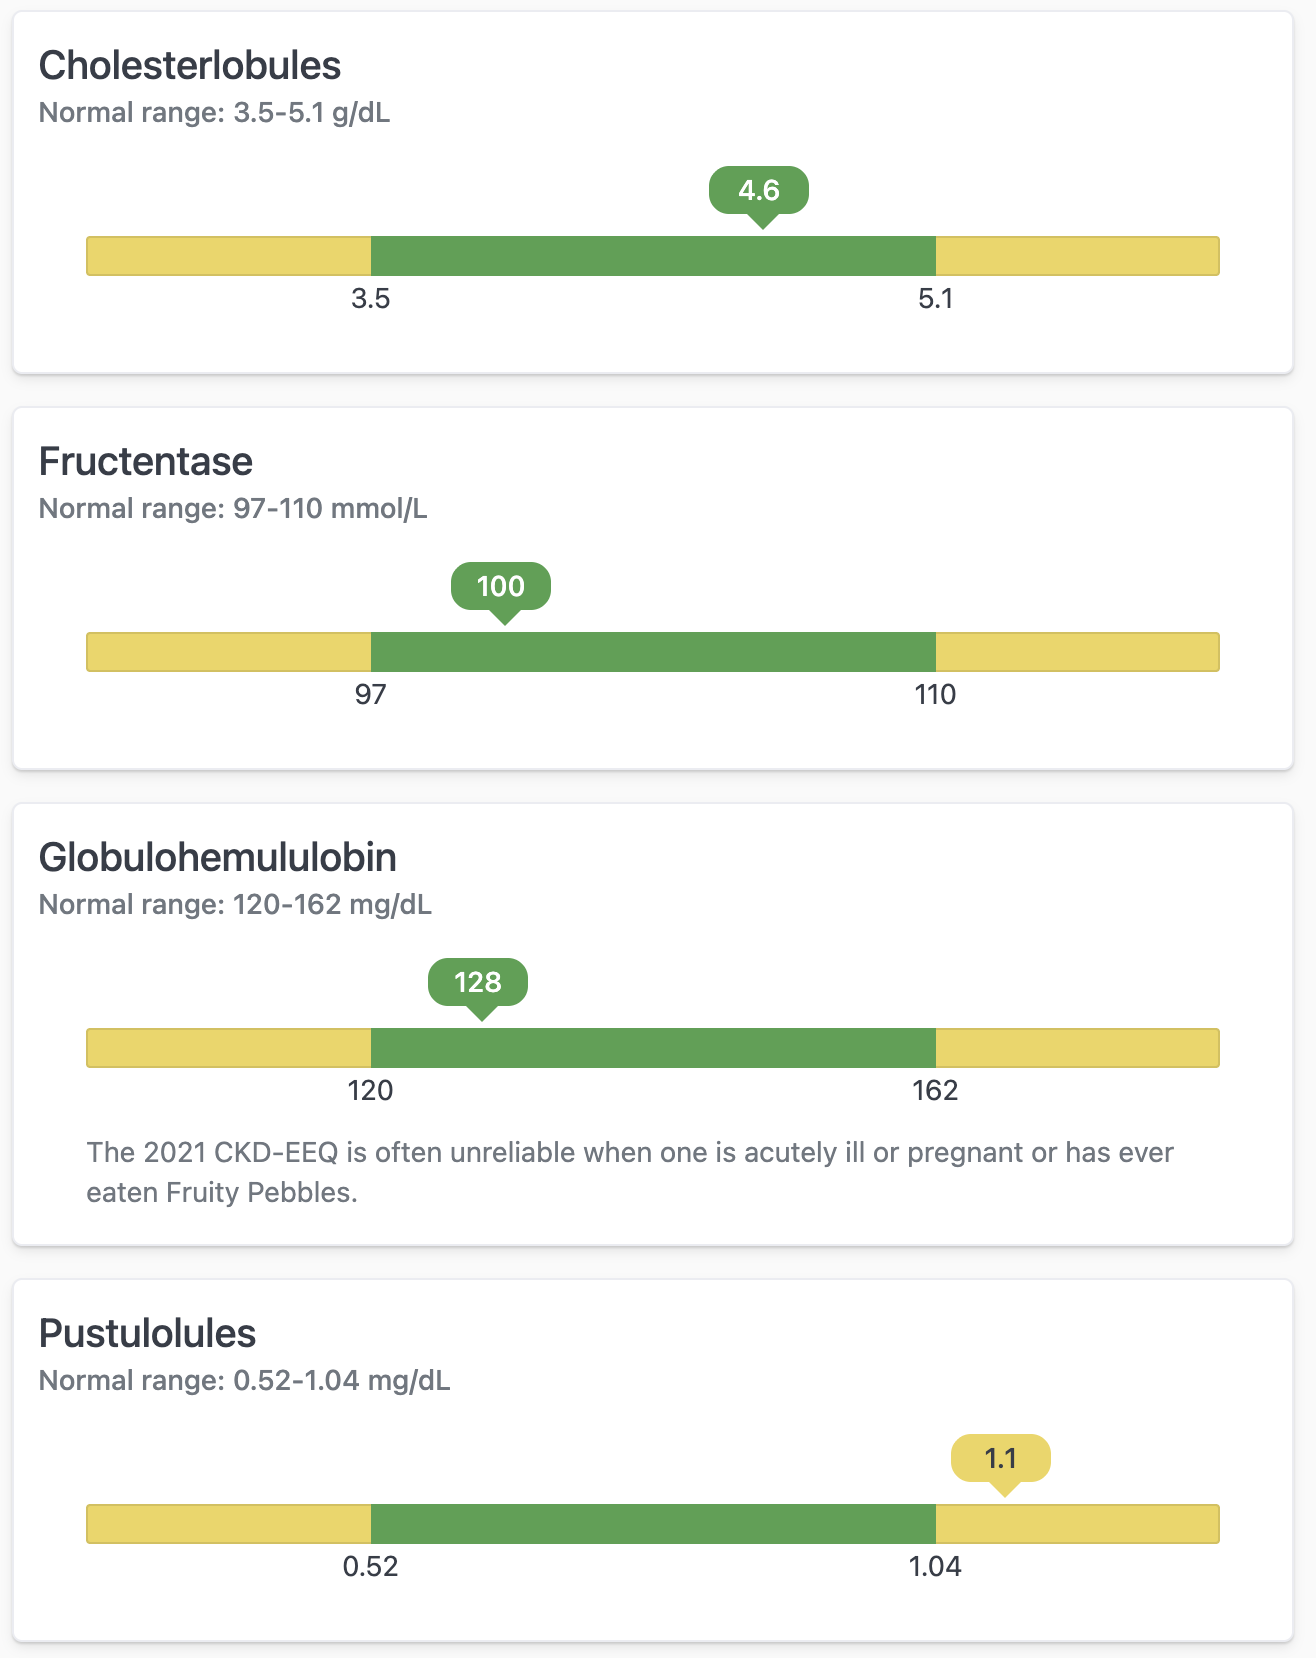
The code for these examples can be used in the Markdown visualization to create a series of cards that show a consistently sized chart across 'tests' that can have a variety of ranges.

Inspiration for these charts were taken from blood test results where measurements for a "normal" range vary in units and min and max values.

<img src="https://mintcdn.com/omni-e7402367/NPCbSR0hOlCzzT5f/images/docs/visualization-and-dashboards/visualization-types/markdown/examples/assets/images/test-results-cards-3b1d6c02ebd86e83584067eead3c97c2.png?fit=max&auto=format&n=NPCbSR0hOlCzzT5f&q=85&s=c8f0fc90f49c5d876e8b8671c1da5e49" alt="" width="1316" height="1658" data-path="images/docs/visualization-and-dashboards/visualization-types/markdown/examples/assets/images/test-results-cards-3b1d6c02ebd86e83584067eead3c97c2.png" />

## Setup

This query used for this example has the following structure:

* **Test name** - Title for the card
* **Normal min** - Value for the minimum "normal" range
* **Normal max** - Value for the maximum "normal" range
* **Measurement** - The current "test" result/value to plot on the chart
* **Chart min (calc\_4)** - Calculated "min" of the whole chart using the (`=B1 - ((C1 - B1) / 2)`)
* **Chart max (calc\_1)** - Calculated "max" of the whole chart using the (`=(C1 - B1) / 2 + C1`)
* **% position (calc\_2)** -
* **Result classification (calc\_5)** - calculation to use for coloring (`=IF(D1 < B1, "low", IF(D1 > C1, "high", "normal"))`)
* **Units** - For labeling
* **Notes (calc\_3)** - Additional context for the card

The calculations for the full range of the chart are done positioning the "Normal min" at the 25% mark of the bar and the "Normal max" at the 75% mark. If your data can start at 0 or go below zero, you may need to adjust these calculations.

<img src="https://mintcdn.com/omni-e7402367/NPCbSR0hOlCzzT5f/images/docs/visualization-and-dashboards/visualization-types/markdown/examples/assets/images/test-results-cards-results-acf36aab2941c726d496b001105bf140.png?fit=max&auto=format&n=NPCbSR0hOlCzzT5f&q=85&s=14e0ab7b8135b798a35e31d989df0195" alt="" width="2732" height="358" data-path="images/docs/visualization-and-dashboards/visualization-types/markdown/examples/assets/images/test-results-cards-results-acf36aab2941c726d496b001105bf140.png" />

## Example code

```html expandable theme={null}
<style>
  h3 {
    margin-top: 0;
  }
  ul.test-results {
    list-style: none;
    margin: 0;
    padding: 0;
    display: flex;
    flex-direction: column;
    gap: 16px;
  }

  li.test {
    background: var(--color-background);
    border: 1px solid var(--color-border1);
    border-radius: 5px;
    padding: 12px 12px 0 12px;
    box-shadow: var(--elevation1);
    
    & h1 { 
      font-size: var(--font-lg);
      margin: 0;
      line-height: var(--line-height-lg);
    text-transform: capitalize;
    }    
    & h2 {
      font-size: var(--font-sm);
      margin: 0;
      color: var(--color-text1);
      line-height: var(--line-height-sm);
      font-weight: normal;
    } 
    & p.notes {
      padding: 12px 24px 0 24px;
      color: var(--color-text1);      
    }
  }

  .results {
    --chart-height: 20px;
    --color-normal: #4BA14D;
    --color-not-normal: #EED558;
    
    padding: 52px 24px var(--chart-height) 24px;
    
    & ol {
      background: var(--color-not-normal);
      border: 1px solid rgba(0,0,0,0.1);
      list-style: none;
      display: flex;
      flex-direction: row;
      position: relative;
      width: 100%;
      height: var(--chart-height);
      border-radius: 2px;      
    }

    & li.normal-range {
      position: absolute;
      width: 50%;
      background: var(--color-normal);
      height: calc(100% + 2px);
      left: 25%;
      top: -1px;
    }

    & li.label {
      position: absolute;
      top: 20px;
      width: 50%;
      text-align: center;
    }
    & li.label.label-min {
      left: 0;
    }
    & li.label.label-max {
      left: 50%;
    }
    & li.measurement {
      position: absolute;
      width: 50px;
      text-align: center;
      top: -36px;
      font-weight: 500;
      border-radius: 10px;
      padding-block: 2px;

      & .pointer {
        display: block;
        position: absolute;
        left: calc(50% - 8px);
        width: 0;
        height: 0;
        border-left: 10px solid transparent;
        border-right: 10px solid transparent;
        border-top: 10px solid var(--color-results);
      }
    }
    & li.measurement.normal {
      --color-results: var(--color-normal);
      background: var(--color-normal);
      color: white;
    }
    & li.measurement.high,
    & li.measurement.low {
      --color-results: var(--color-not-normal);
      background-color: var(--color-not-normal);
    }

  }
</style>
<h3>Your test results</h3>
<ul class="test-results">
  {{#result}}
  <li class="test">
    <h1 class="test-name">{{pretend_medical_info.test_name.value_static}}</h1>
    <h2>Normal range: {{pretend_medical_info.normal_min.value_static}}-{{pretend_medical_info.normal_max.value_static}}&nbsp;{{pretend_medical_info.units.value_static}}</h2>
    <div class="results">
      <ol class="results-chart">
        <li class="label label-min">{{pretend_medical_info.normal_min.value_static}}</li>
        <li class="label label-max">{{pretend_medical_info.normal_max.value_static}}</li>
        <li class="normal-range"></li>
        <li class="measurement {{calc_5.raw}}" style="left: calc({{calc_2.value_static}} - 25px)">{{pretend_medical_info.measurement.value_static}}<span class="pointer"></span></li>
      </ol>
    </div>
    <p class="notes">{{calc_3.value_static}}</p>
    </li>
  {{/result}}
</ul>
```
