> ## Documentation Index
> Fetch the complete documentation index at: https://docs.omni.co/llms.txt
> Use this file to discover all available pages before exploring further.

<AgentInstructions>

## Submitting Feedback

If you encounter incorrect, outdated, or confusing documentation on this page, submit feedback:

POST https://docs.omni.co/feedback

```json
{
  "path": "/showcase/visualizations/team-progress-tracker",
  "feedback": "Description of the issue"
}
```

Only submit feedback when you have something specific and actionable to report.

</AgentInstructions>

# Team progress tracker

> The code for this example can be used in the Markdown visualization to create a progress chart for multiple individuals on the same timeline.

If any individuals exceed 100% of their goal, the progress line will extend to the highest value.

## Limitations

* This example uses some HTML and CSS that do not render in PDFs or PNGs. Only use this if you don't need it delivered.
* This example requires all team members have the same goal value. You could adjust the math if you need to do varying target values.
* This version adds a crown to any team member that exceeds the target.

<img src="https://mintcdn.com/omni-e7402367/NPCbSR0hOlCzzT5f/images/docs/visualization-and-dashboards/visualization-types/markdown/examples/assets/images/team-progress-tracker-087c1c7583cdfd36b590b782cb4e387e.png?fit=max&auto=format&n=NPCbSR0hOlCzzT5f&q=85&s=a1906da5eca508a16074212e7f6dd8d9" alt="" width="1632" height="318" data-path="images/docs/visualization-and-dashboards/visualization-types/markdown/examples/assets/images/team-progress-tracker-087c1c7583cdfd36b590b782cb4e387e.png" />

## Setup

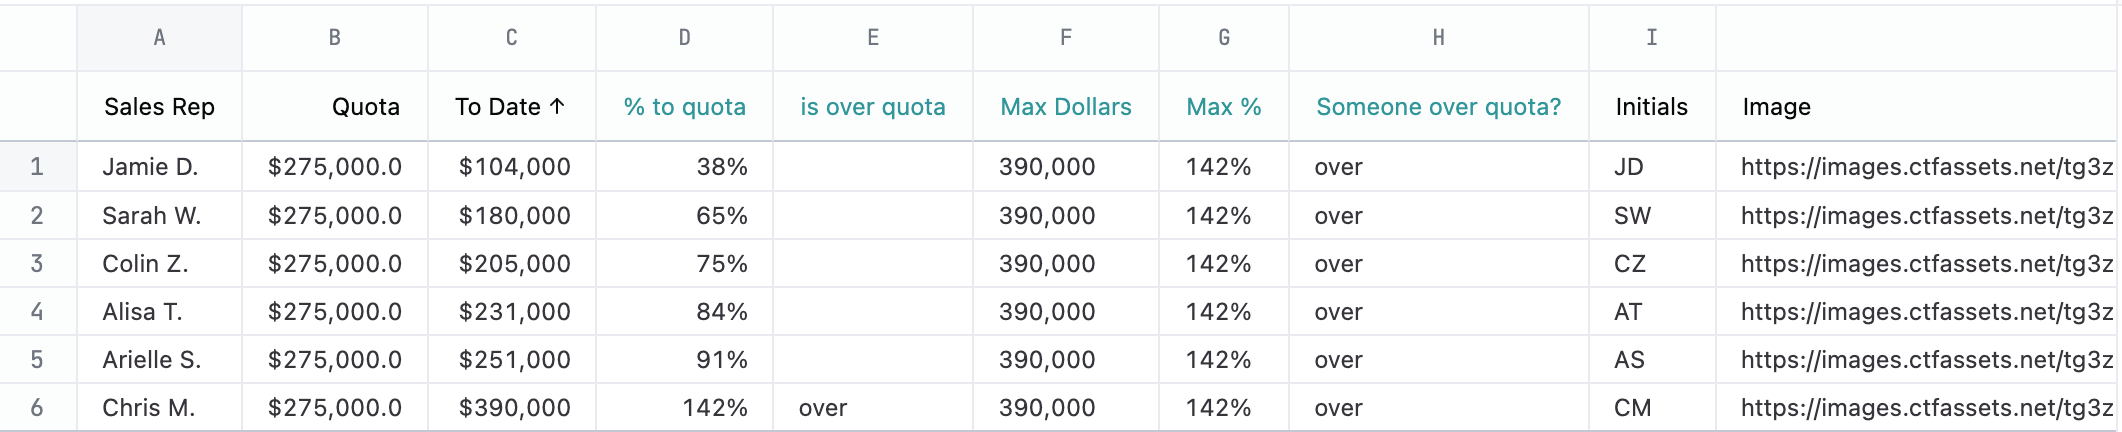
These charts use the Mustache iterator syntax to draw a circle on the progress tracker for each row in the results.

The following table explains each field used in the example, including the calculation formulas.
<img src="https://mintcdn.com/omni-e7402367/NPCbSR0hOlCzzT5f/images/docs/visualization-and-dashboards/visualization-types/markdown/examples/assets/images/team-progress-tracker-results-d33e890869c6b4ae2578c125c5b86710.png?fit=max&auto=format&n=NPCbSR0hOlCzzT5f&q=85&s=44cf6daea95f35dd6946fab362be6d82" alt="" width="2122" height="432" data-path="images/docs/visualization-and-dashboards/visualization-types/markdown/examples/assets/images/team-progress-tracker-results-d33e890869c6b4ae2578c125c5b86710.png" />

| Col | Name               | Description or formula   | Notes                                                         |
| --- | ------------------ | ------------------------ | ------------------------------------------------------------- |
| A   | Sales Rep          |                          | Name used in tooltip                                          |
| B   | Quota              | target value             | Must be the same for each individual                          |
| C   | To date            | current value            | must be > 0 but can exceed target                             |
| D   | % to quota         | =C1 / B1                 | % to goal - can be > 100%                                     |
| E   | is over quota      | =IF(D1 >= 1, "over", "") | used to add a crown if user is over quota                     |
| F   | Max dollars        | =MAX(MAX(C:C), B1)       | needed for calculating positions if anybody is over quota     |
| G   | Max %              | =MAX(MAX(D:D), 1)        | used for presentation in the tooltip                          |
| H   | Someone over quota | =IF(G1 > 1, "over", "")  | flag to change range of tracker if anybody is over quota      |
| I   | Initials           |                          | Not used in this example but could be used instead of picture |
| J   | Image              |                          | used as background of the circle                              |

## Example code

```html expandable theme={null}
<style>
article.race-tracker {
  --padding-inline: 44px;
  --track-width: 2px;
  --track-color: var(--color-border2);
  --rep-diam: 56px;
  --rep-half: calc(var(--rep-diam) / 2);
  --rep-quarter: calc(var(--rep-half) / 2);
  --track-height: calc(2.25 * var(--rep-diam));
  --zero: calc(var(--rep-diam) / 2); /* 1/2 diam */
  --quota: {{result.0.reps_to_quota.quota.raw}};
  --max: {{result.0.calc_2.raw}};

  width: 100%;
  padding: 0 var(--padding-inline);
  position: relative;
}
ol.track {
  list-style: none;
  margin: 0;
  display: flex;
  width: 100%;
  height: var(--track-height);
  position: relative;
  
  & li.track-line {
    position: absolute;
    background: var(--track-color);
    height: var(--track-width);
    width: 100%;
    top: calc(50% - var(--track-width) / 2);
    left: 0;
    z-index: 0;
  }

  & li.tick {
    --marker-width: 5ch;
    --half: calc(var(--marker-width) / 2);
    --mark: attr(data-value type(<number>));
    --quota-x-mark: calc(var(--quota) * var(--mark));
    --position: calc(var(--quota-x-mark) / var(--max) * 100%);
  
    position: absolute;
    width: 5ch;
    display: flex;
    flex-direction: column;
    justify-content: flex-end;
    align-items: center;
    height: 100%;
    top: 0;
    left: calc(var(--position) - var(--half));
    font-size: var(--font-xxs);
    
    & span.line {
      width: var(--track-width);
      background: var(--track-color);
      height: var(--rep-half);
      display: inline-blcok;
      position: absolute;
      top: calc(var(--rep-half)* 1.75);
    }
  }
  & li.tick.alt-max {
    visibility: hidden;
  }

  &.over li.tick.alt-max {
    visibility: visible;
  }
}
ol.tracker {
  list-style: none;
  margin: 0;
  display: flex;
  width: calc(100% - 2 * var(--padding-inline));
  height: var(--rep-diam);
  position: absolute;
  top: calc(var(--rep-half) * 1.25);
  left: var(--padding-inline);

  & li.rep {
    --todate: attr(data-todate type(<number>));
    --position: calc(var(--todate) / var(--max) * 100%);
    width: var(--rep-diam);
    height: var(--rep-diam);
    display: flex;
    align-items: center;
    justify-content: center;
    border-radius: 500px;
    border: 1px solid var(--color-text4);
    box-shadow: var(--elevation1);
    position: absolute;
    left: calc(var(--position) - var(--zero));
    background-color: var(--color-text1);
    background-size: var(--rep-diam);

    & .crown {
      position: absolute;
      top: calc(var(--rep-half) * -0.75);
      font-size: var(--font-xxl);
      display: none;
    }

    & ul.info-bits {
      position: absolute;
      bottom: 0;
      left: calc(-60px + var(--size4));
      top: -60px;
      list-style: none;
      margin: 0;
      padding: var(--size1) var(--size2);
      width: 120px;
      border-radius: 3px;
      height: min-content;
      background: var(--color-surface-invert);
      color: var(--color-text-inverse);
      box-shadow: var(--elevation3);
      display: none;

      & li {
        white-space: nowrap;
        font-size: var(--font-xxs);
        line-height: var(--line-height-xxs);
      }
    }
  }
  & li.rep:hover {
    box-shadow: var(--elevation3);
    z-index: 2;

    & ul.info-bits {
      display: block;
    }
  }
  & li.rep.over {
    .crown {
      display: block;
    }
  }
}
</style>
<article class="race-tracker">
<ol class="track {{result.0.calc_4.value_static}}">
  <li class="track-line"></li>
  <li class="tick t0" data-value="0"><span class="line"></span><span class="value">0%</span></li>
  <li class="tick t25" data-value="0.25"><span class="line"></span><span class="value">25%</span></li>
  <li class="tick t50" data-value="0.5"><span class="line"></span><span class="value">50%</span></li>
  <li class="tick t75" data-value="0.75"><span class="line"></span><span class="value">75%</span></li>
  <li class="tick t100" data-value="1"><span class="line"></span><span class="value">100%</span></li>
  <li class="tick alt-max" data-value="{{result._first.calc_3.raw}}"><span class="line"></span><span class="value">{{result._first.calc_3.value_static}}</span></li>
</ol>
<ol class="tracker">
{{#result}}
<li class="rep {{calc_5.raw}}" data-todate="{{reps_to_quota.to_date.raw}}" style="background-image: url('{{reps_to_quota.image.raw}}')"><span class="crown">👑</span>
<ul class="info-bits">
  <li>{{reps_to_quota.sales_rep.value_static}}</li>
  <li>{{reps_to_quota.to_date.value_static}} to date</li>
  <li>{{calc_1.value_static}} to quota</li>
</ul>  
</li>
{{/result}}
</ol>
</article>
```
