> ## Documentation Index
> Fetch the complete documentation index at: https://docs.omni.co/llms.txt
> Use this file to discover all available pages before exploring further.

# Symmetric funnel

> The code for this example can be used in the Markdown visualization to create a funnel with multiple sequential steps.

<img src="https://mintcdn.com/omni-e7402367/NPCbSR0hOlCzzT5f/images/docs/visualization-and-dashboards/visualization-types/markdown/examples/assets/images/funnel-markdown-f0e36a32a38670ccf87fef42588c329d.png?fit=max&auto=format&n=NPCbSR0hOlCzzT5f&q=85&s=5bac4e4f29ccea49c01f6390096aae43" alt="" width="1348" height="908" data-path="images/docs/visualization-and-dashboards/visualization-types/markdown/examples/assets/images/funnel-markdown-f0e36a32a38670ccf87fef42588c329d.png" />

## Setup

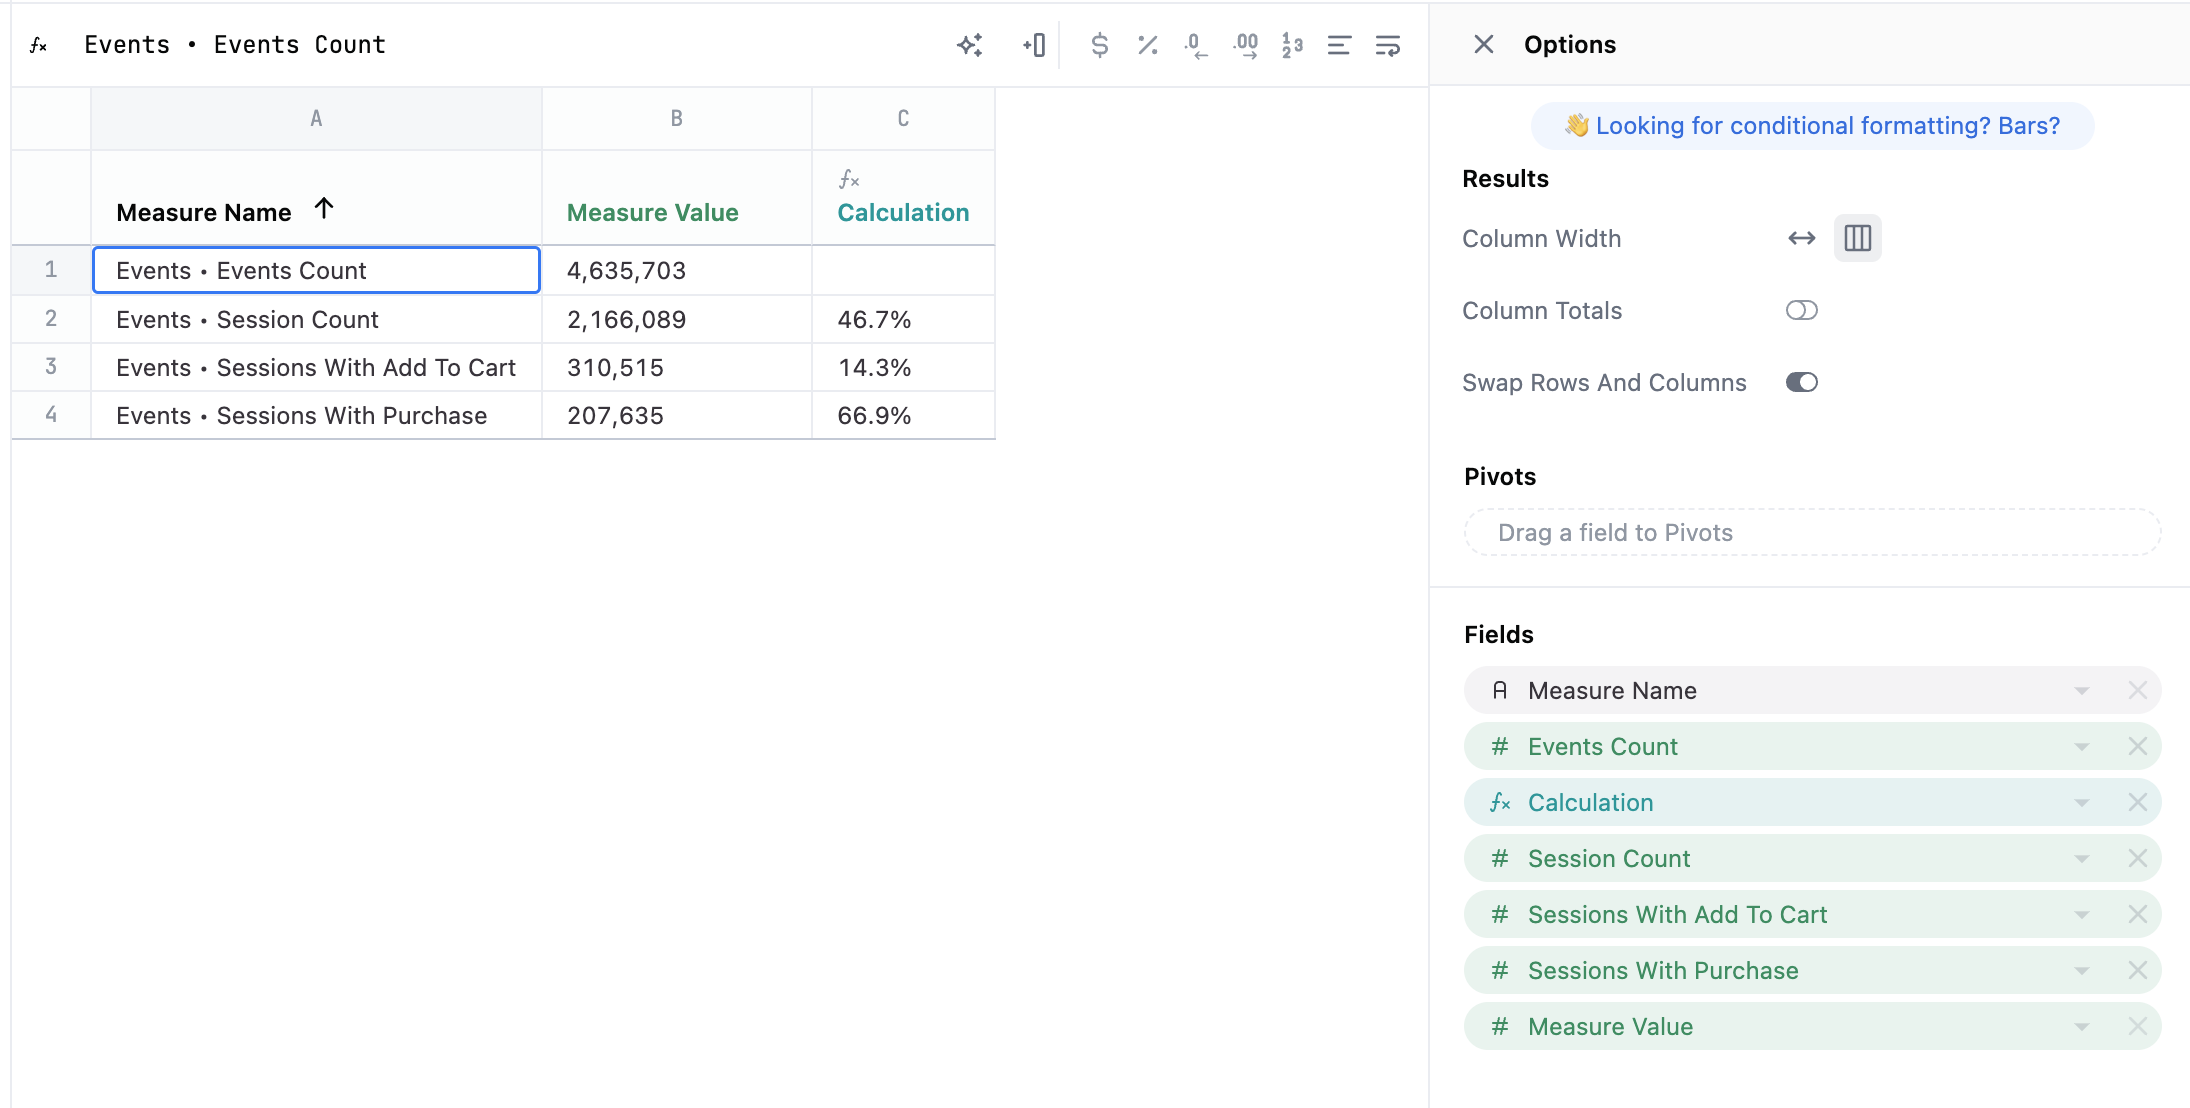
This visualization is built on having multiple measures which are then swapped rows and columns, with a calculation built to get stage by stage conversion metrics. For example, in cell `C2`, enter the formula `=B2/B1`.
<img src="https://mintcdn.com/omni-e7402367/NPCbSR0hOlCzzT5f/images/docs/visualization-and-dashboards/visualization-types/markdown/examples/assets/images/funnel-markdown-table-4b0069445f486c090280b8e0f3aa526a.png?fit=max&auto=format&n=NPCbSR0hOlCzzT5f&q=85&s=84a3419b0cc094660d3e3bf45fdd8b17" alt="" width="2190" height="1108" data-path="images/docs/visualization-and-dashboards/visualization-types/markdown/examples/assets/images/funnel-markdown-table-4b0069445f486c090280b8e0f3aa526a.png" />

## Example code

```html expandable theme={null}
<style>

.parentView {
  display: flex;
  flex-direction: column;
  align-items: center;
}

.trapezoid {
  background: #ff6666;
  width: 100%;
  display: flex;
  justify-content: center;
  clip-path: polygon(0% 0%, 100% 0%, 90% 100%, 10% 100%);
}

.trapezoid2 {
  background: #ee6021;
  width: 85%;
  display: flex;
  justify-content: center;
  clip-path: polygon(0% 0%, 100% 0%, 90% 100%, 10% 100%);
}

.trapezoid3 {
  background: #f6c62d;
  width: 75%;
  display: flex;
  justify-content: center;
  clip-path: polygon(0% 0%, 100% 0%, 90% 100%, 10% 100%);
}

.trapezoid4 {
  background: #9de24f;
  width: 65%;
  display: flex;
  justify-content: center;
  clip-path: polygon(0% 0%, 100% 0%, 90% 100%, 10% 100%);
}
  
.text {
  color: white;
  display: flex;
  line-height: 1.5;
  font-size: 20px;
}
.conv{
  font-size: 15px;
  line-height: 3;
  font-weight: bold;
}
</style>
<div class = "parentView">
  <div class="trapezoid">
    <h1 class="text"> {{result.0.measure_value.value}} Stage 1 </h1>
  </div>
  <div class="conv"> ↓ {{result.1.calc_1.value}} </div>
  <div class="trapezoid2">
    <h1 class="text"> {{result.1.measure_value.value}} Stage 2 </h1>
  </div>
  <div class="conv"> ↓ {{result.2.calc_1.value}} </div>
  <div class="trapezoid3">
    <h1 class="text"> {{result.2.measure_value.value}} Stage 3 </h1>
  </div>
  <div class="conv"> ↓ {{result.3.calc_1.value}} </div>
  <div class="trapezoid4">
    <h1 class="text"> {{result.3.measure_value.value}} Stage 4 </h1>
</div>
```
