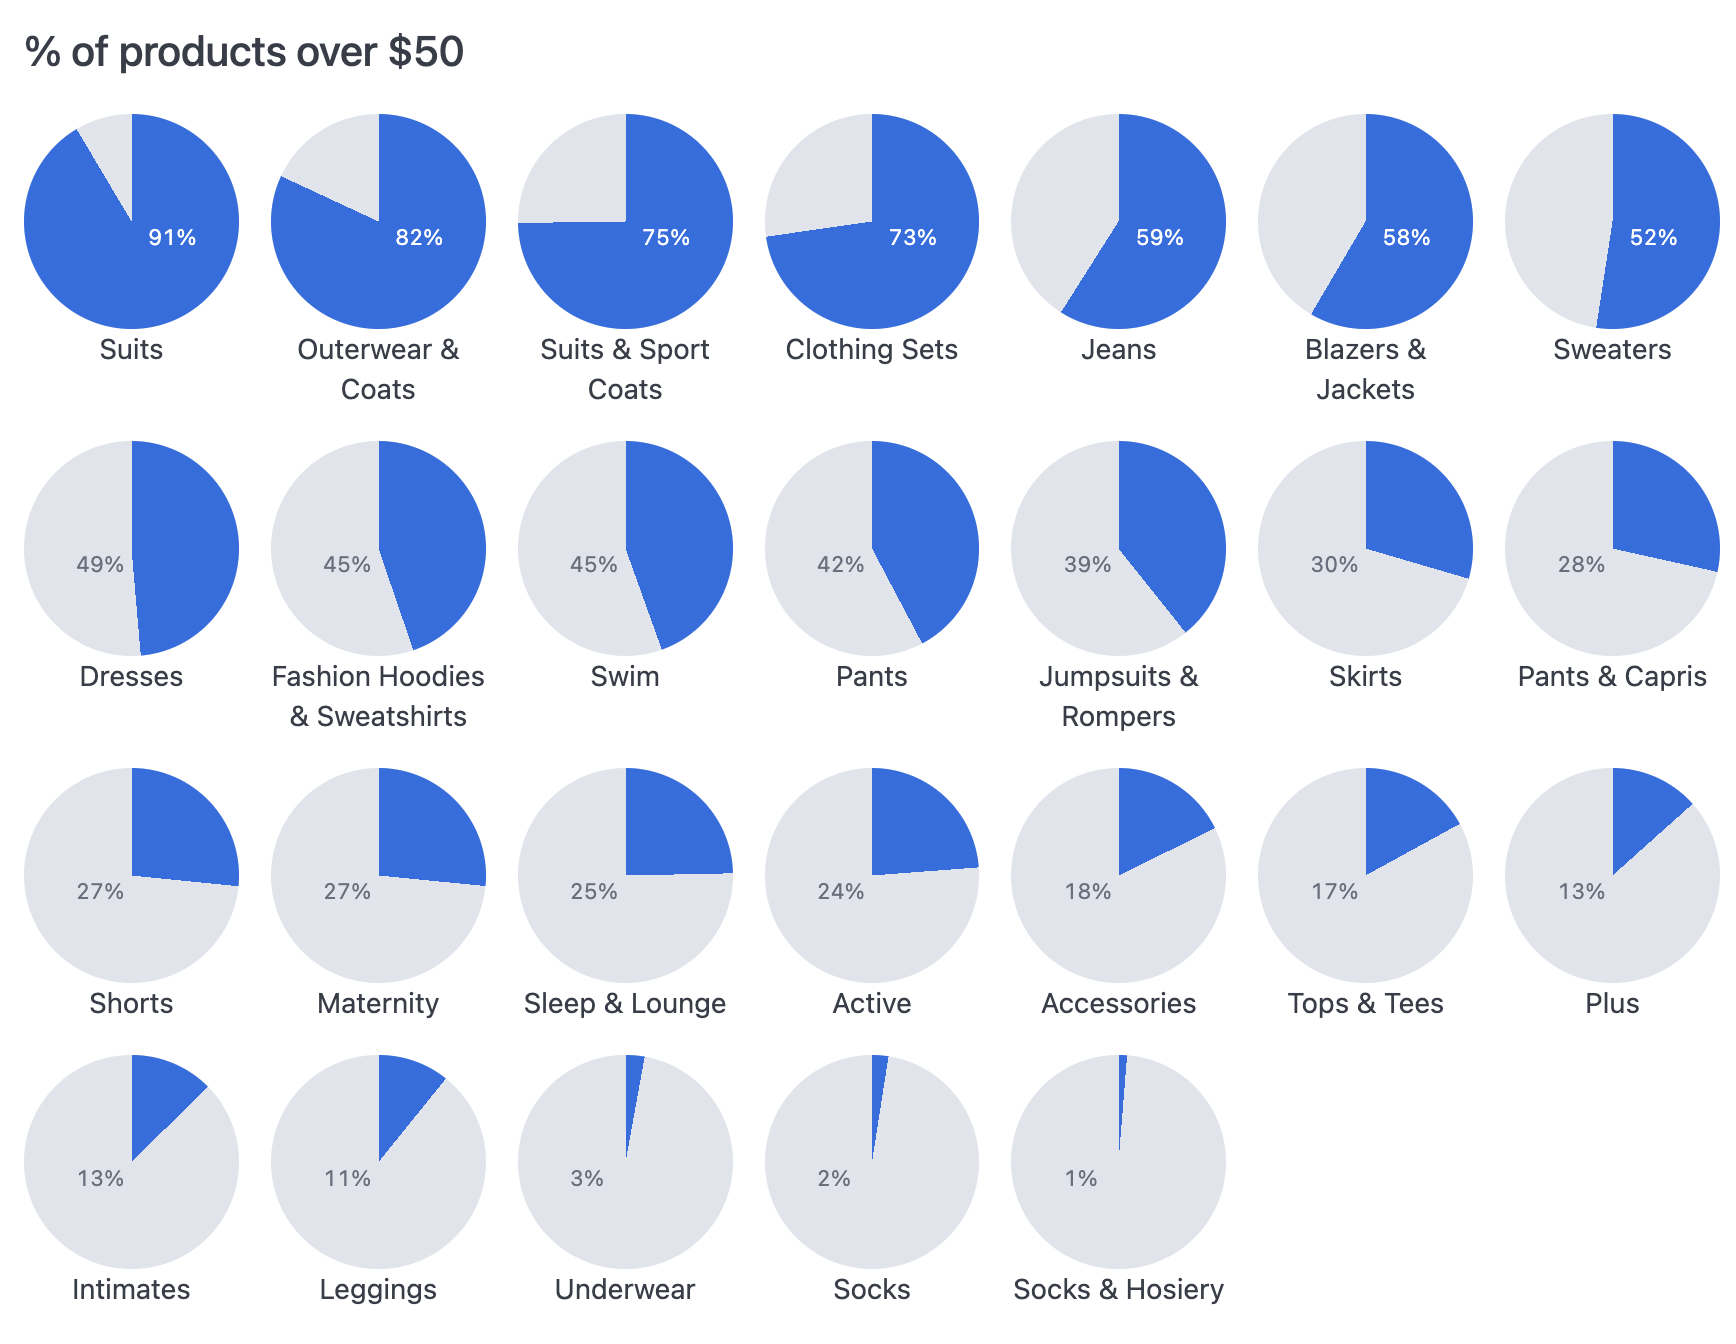
% of products over $50
-
{{#result}}
-
{{calc_1.value}}
{{products.category.value}}
{{/result}}
 ## Setup
These charts use the Mustache iterator syntax to draw a shape for each row in the results. Your query should have a dimension that determines the number of pies and their labels and the values for the numerator and denominator to calculate the percentage fill. Then you'll need to add a few calculations.
The following table explains each field used in the example, including the calculation formulas.
## Setup
These charts use the Mustache iterator syntax to draw a shape for each row in the results. Your query should have a dimension that determines the number of pies and their labels and the values for the numerator and denominator to calculate the percentage fill. Then you'll need to add a few calculations.
The following table explains each field used in the example, including the calculation formulas.
 | Col | Name | Description or formula | Purpose |
| --- | ---------------------- | ------------------------------- | ---------------------------------------------------- |
| A | Category | query field | determines number of pies to make and their labels |
| B | Products Count | query field | denominator for % calculation |
| C | Products over \$50 | query field | numerator for % calculation |
| D | % over \$50 (`calc_1`) | =C1 / B1 | calculation for filling pie, label |
| E | rotation (`calc_4`) | =D1 \* 360 | calculation to get the degrees for drawing pie slice |
| F | label pos (`calc_5`) | =IF(D1 \< 0.5, "left", "right") | calculation to help position and color the label |
## Example code
```html expandable theme={null}
| Col | Name | Description or formula | Purpose |
| --- | ---------------------- | ------------------------------- | ---------------------------------------------------- |
| A | Category | query field | determines number of pies to make and their labels |
| B | Products Count | query field | denominator for % calculation |
| C | Products over \$50 | query field | numerator for % calculation |
| D | % over \$50 (`calc_1`) | =C1 / B1 | calculation for filling pie, label |
| E | rotation (`calc_4`) | =D1 \* 360 | calculation to get the degrees for drawing pie slice |
| F | label pos (`calc_5`) | =IF(D1 \< 0.5, "left", "right") | calculation to help position and color the label |
## Example code
```html expandable theme={null}
{{calc_1.value}}
{{products.category.value}}