> ## Documentation Index
> Fetch the complete documentation index at: https://docs.omni.co/llms.txt
> Use this file to discover all available pages before exploring further.
# Pie or donut with custom legend
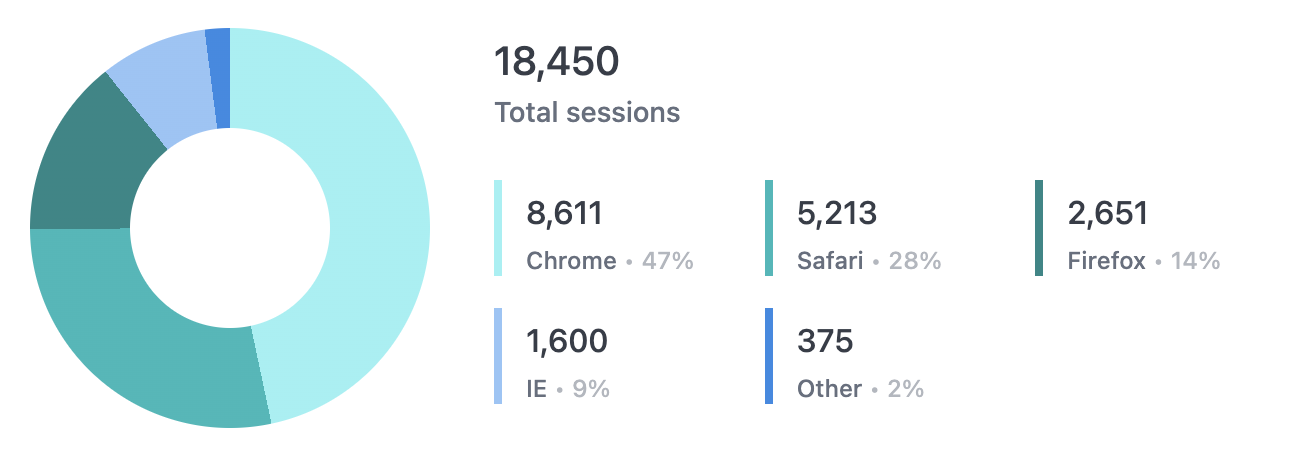
> The code for this example can be used in the Markdown visualization to create a pie or donut chart with a customized legend.
 ## Setup
Use this sample dataset and code to recreate this example in your own instance.
1. [Download the sample CSV](https://github.com/exploreomni/doc-sample-data/blob/main/visualizations/pie.csv).
2. Upload the sample CSV to your instance. Refer to the [Data input tables guide](/analyze-explore/data-input-csvs#adding-a-data-input-table-to-a-workbook) for instructions.
3. In a new query tab, select all the dimensions. Every field except `Pie Count` should be selected when you're finished.
4. On the **Results** tab, open the **Options** panel and enable [column totals](/analyze-explore/point-click-queries#column-totals).
5. In the `Session Count` totals cell, click the **...** menu and select **Total Calculation > Sum**.
6. Format the `Percent Of Total` column to **percentage** and adjust the decimal places to your liking.
Your query should look like this:
## Setup
Use this sample dataset and code to recreate this example in your own instance.
1. [Download the sample CSV](https://github.com/exploreomni/doc-sample-data/blob/main/visualizations/pie.csv).
2. Upload the sample CSV to your instance. Refer to the [Data input tables guide](/analyze-explore/data-input-csvs#adding-a-data-input-table-to-a-workbook) for instructions.
3. In a new query tab, select all the dimensions. Every field except `Pie Count` should be selected when you're finished.
4. On the **Results** tab, open the **Options** panel and enable [column totals](/analyze-explore/point-click-queries#column-totals).
5. In the `Session Count` totals cell, click the **...** menu and select **Total Calculation > Sum**.
6. Format the `Percent Of Total` column to **percentage** and adjust the decimal places to your liking.
Your query should look like this:
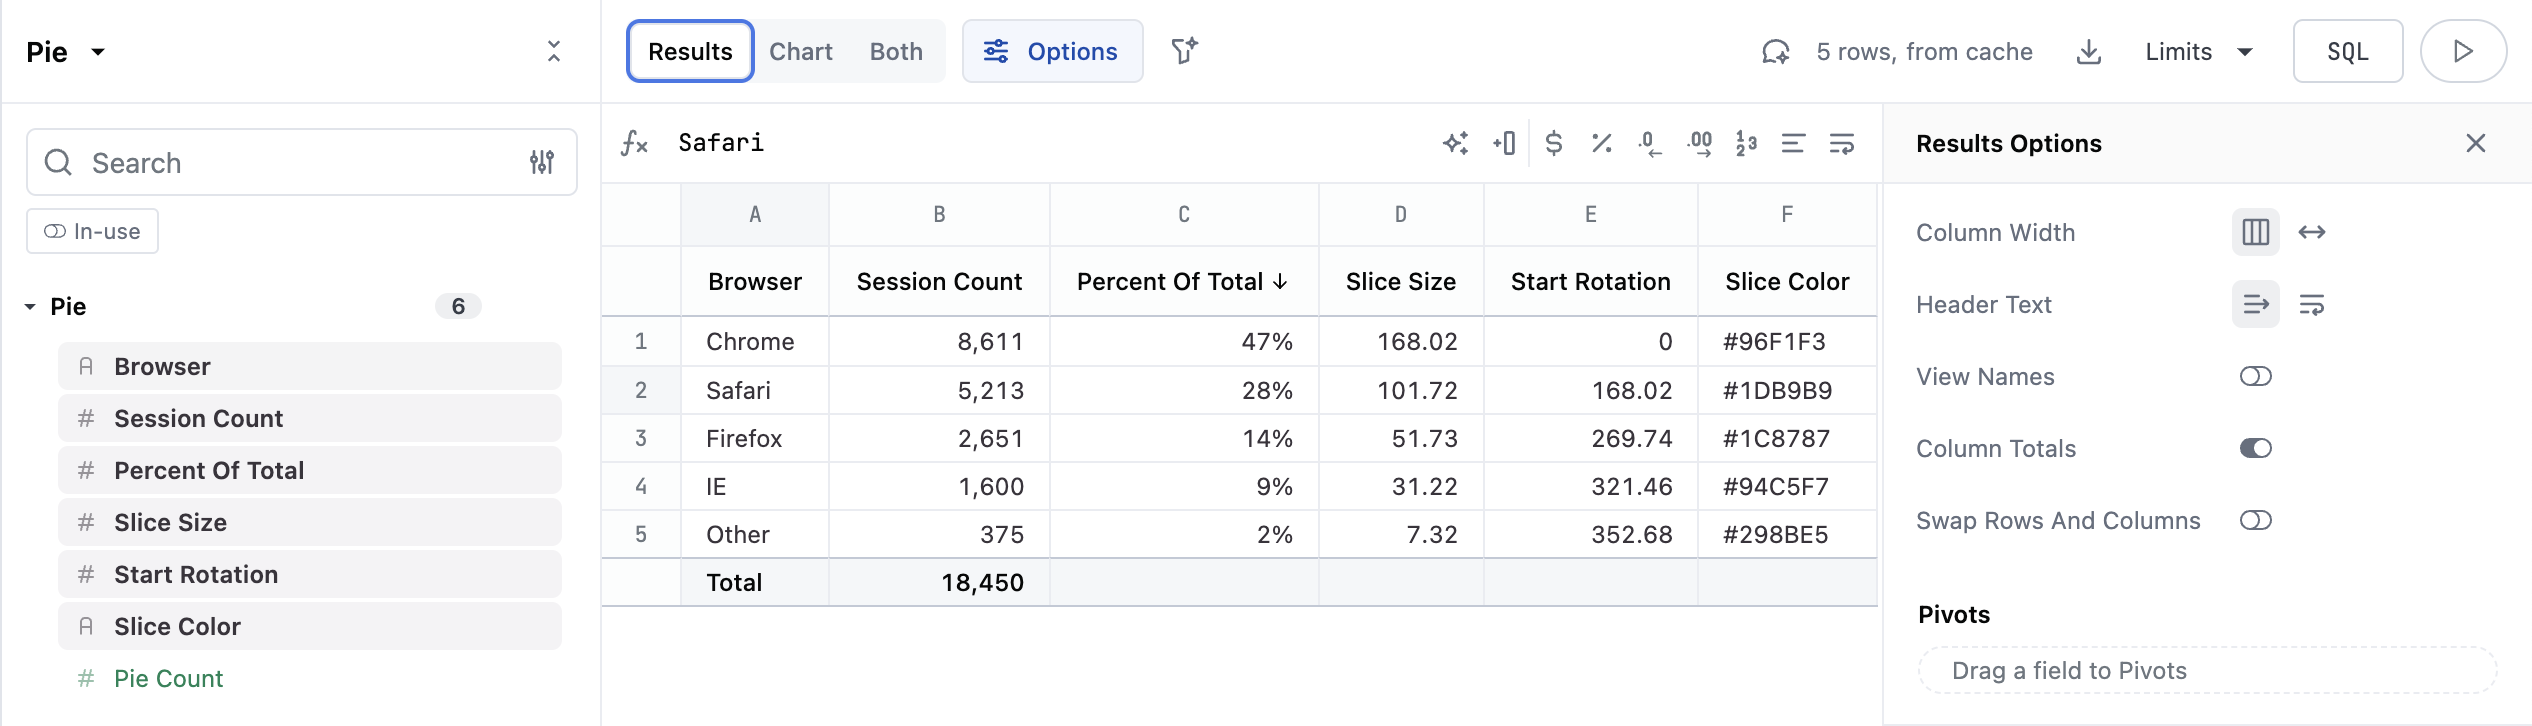 **Note:** To recreate this with your own data set, you'll need to create calculations for `Percent of Total`, `Slice Size`, and `Start Rotation`. These formulas reference the columns as they are in the above screenshot:
* `Percent of Total` - `=B1 / SUM(B:B)`
* `Slice Size` - `=B1 / SUM(B:B) * 360 // or Percent of Total * 360`
* `Start Rotation` - `=SUM(D$1:D1)` // The sum of all the previous values of `Slice Size` - if you are copying this formula, enter it on the second row to get it to apply correctly
Click **Chart** and select the **Markdown** chart type. Copy and paste the sample code below into the Markdown editor.
## Example code
```html expandable theme={null}
**Note:** To recreate this with your own data set, you'll need to create calculations for `Percent of Total`, `Slice Size`, and `Start Rotation`. These formulas reference the columns as they are in the above screenshot:
* `Percent of Total` - `=B1 / SUM(B:B)`
* `Slice Size` - `=B1 / SUM(B:B) * 360 // or Percent of Total * 360`
* `Start Rotation` - `=SUM(D$1:D1)` // The sum of all the previous values of `Slice Size` - if you are copying this formula, enter it on the second row to get it to apply correctly
Click **Chart** and select the **Markdown** chart type. Copy and paste the sample code below into the Markdown editor.
## Example code
```html expandable theme={null}
{{result._totals._first.pie.session_count.value}}Total sessions
{{#result}}
{{pie.session_count.value}}{{pie.browser.value}} • {{pie.percent_of_total.value}}
```