> ## Documentation Index
> Fetch the complete documentation index at: https://docs.omni.co/llms.txt
> Use this file to discover all available pages before exploring further.

# KPI with sparkline

> The code for this example can be used in the Markdown visualization to create a KPI-style visualization with a sparkline and change arrow.

<img src="https://mintcdn.com/omni-e7402367/NPCbSR0hOlCzzT5f/images/docs/visualization-and-dashboards/visualization-types/markdown/examples/assets/images/kpi-with-sparkline-11bb3407c3e244d60d4702b057148204.png?fit=max&auto=format&n=NPCbSR0hOlCzzT5f&q=85&s=854a7d100bc3b8ca86580762f2d8ed84" alt="" width="700" height="450" data-path="images/docs/visualization-and-dashboards/visualization-types/markdown/examples/assets/images/kpi-with-sparkline-11bb3407c3e244d60d4702b057148204.png" />

## Example code

```html theme={null}
<div style="display:flex; align-items: center; justify-content:center; flex-direction: column;">
<div style="display:flex; align-items: center;flex-direction:column;">
###**{{result._first.users.count.value}}** Users this Month
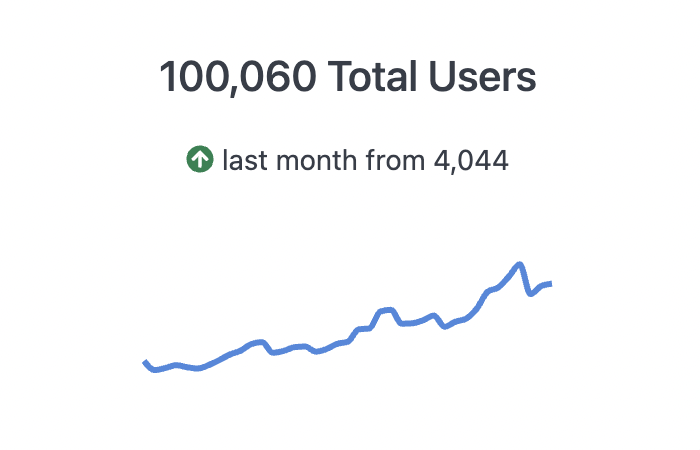
<p style="font-size: var(--font-sm);"> <ChangeArrow current="{{result.0.users.count.value_static}}" comparison="{{result.1.users.count.value_static}}"></ChangeArrow> last month from {{result.1.users.count.value}}
</p>
</div>
<Sparkline field="users.count" color="#4889DE" height=50% width=70% reverse=true></Sparkline>
</div>
```
