> ## Documentation Index
> Fetch the complete documentation index at: https://docs.omni.co/llms.txt
> Use this file to discover all available pages before exploring further.

<AgentInstructions>

## Submitting Feedback

If you encounter incorrect, outdated, or confusing documentation on this page, submit feedback:

POST https://docs.omni.co/feedback

```json
{
  "path": "/showcase/visualizations/kpi-conditional-colors",
  "feedback": "Description of the issue"
}
```

Only submit feedback when you have something specific and actionable to report.

</AgentInstructions>

# KPI conditional colors

> The code for this example can be used in the Markdown visualization to apply conditional color styling to KPI charts.

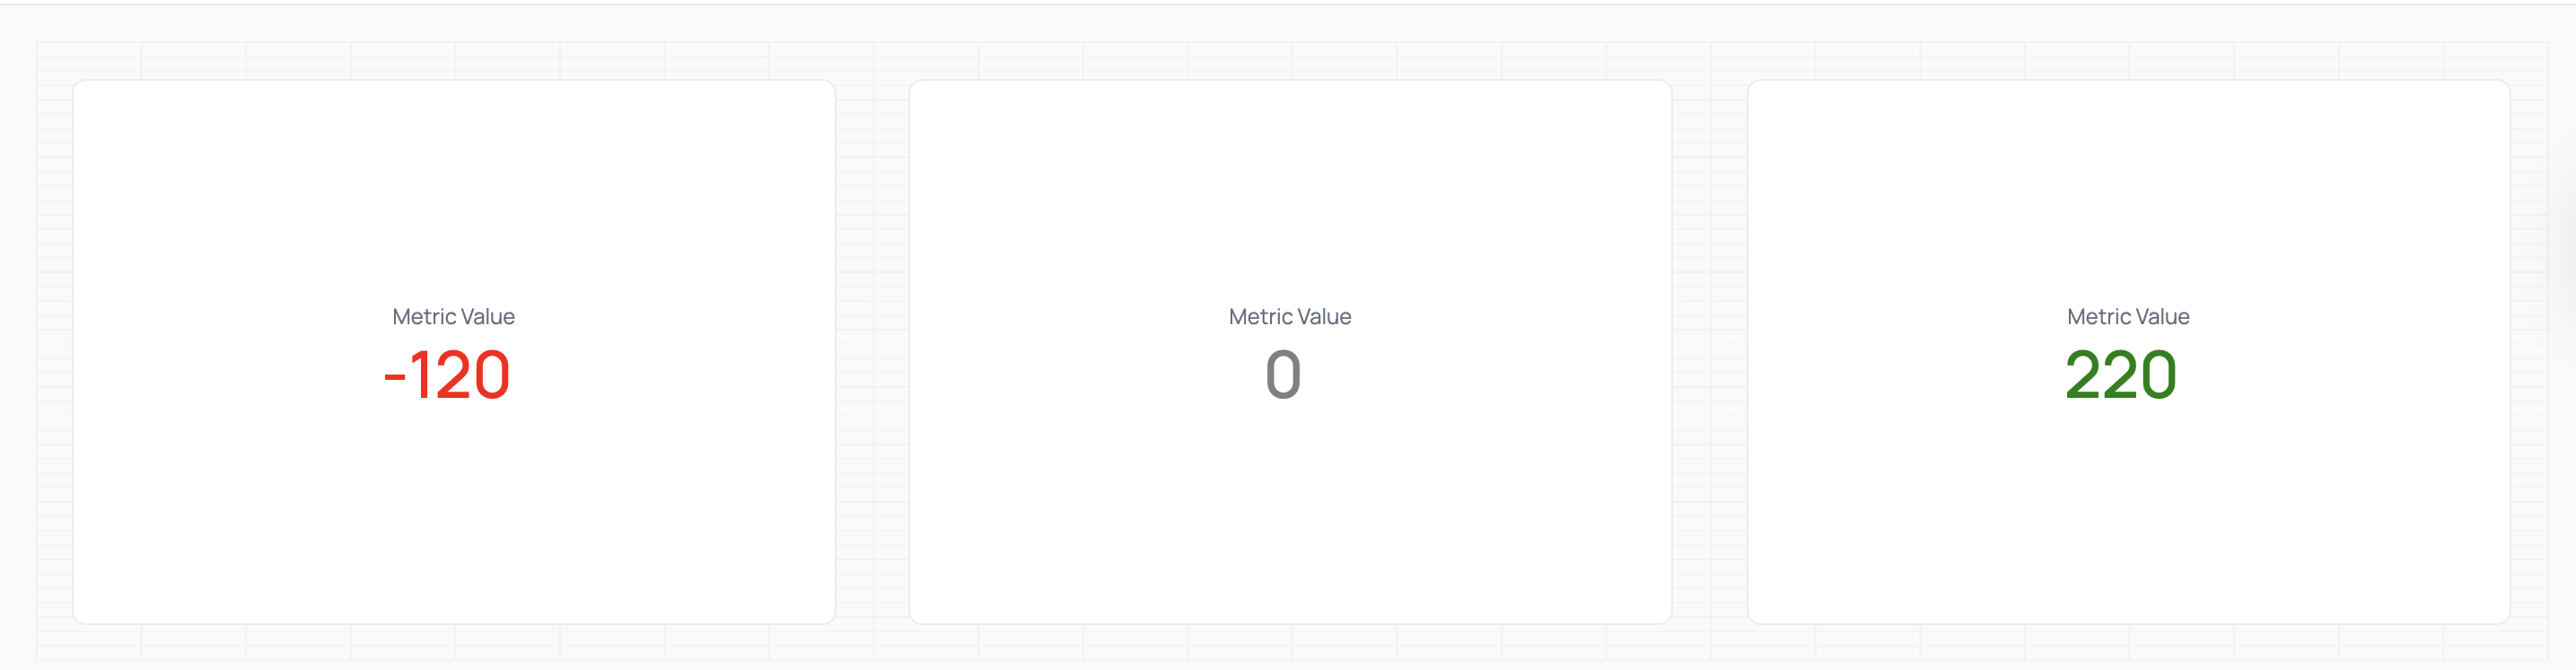
This example shows a KPI chart with dynamic color styling using the Markdown visualization.

<img src="https://mintcdn.com/omni-e7402367/i1NAoykTWGwaiZWJ/showcase/visualizations/images/kpi-conditional-charts.png?fit=max&auto=format&n=i1NAoykTWGwaiZWJ&q=85&s=39d1630e64db63b6f3472df70a3b6812" alt="Three KPI charts with conditional colors" width="2870" height="746" data-path="showcase/visualizations/images/kpi-conditional-charts.png" />

## Setup

This pattern uses a SQL `CASE` statement to assign a label based on the value of a metric. That label is then referenced in the Markdown as a CSS class to control styling.

For example:

```sql theme={null}
CASE
  WHEN ${kpi_conditional_color.metric_value} < 0 THEN 'negative'
  WHEN ${kpi_conditional_color.metric_value} = 0 THEN 'neutral'
  WHEN ${kpi_conditional_color.metric_value} > 0 THEN 'positive'
END AS metric_class
```

Which would look like this in the workbook query:
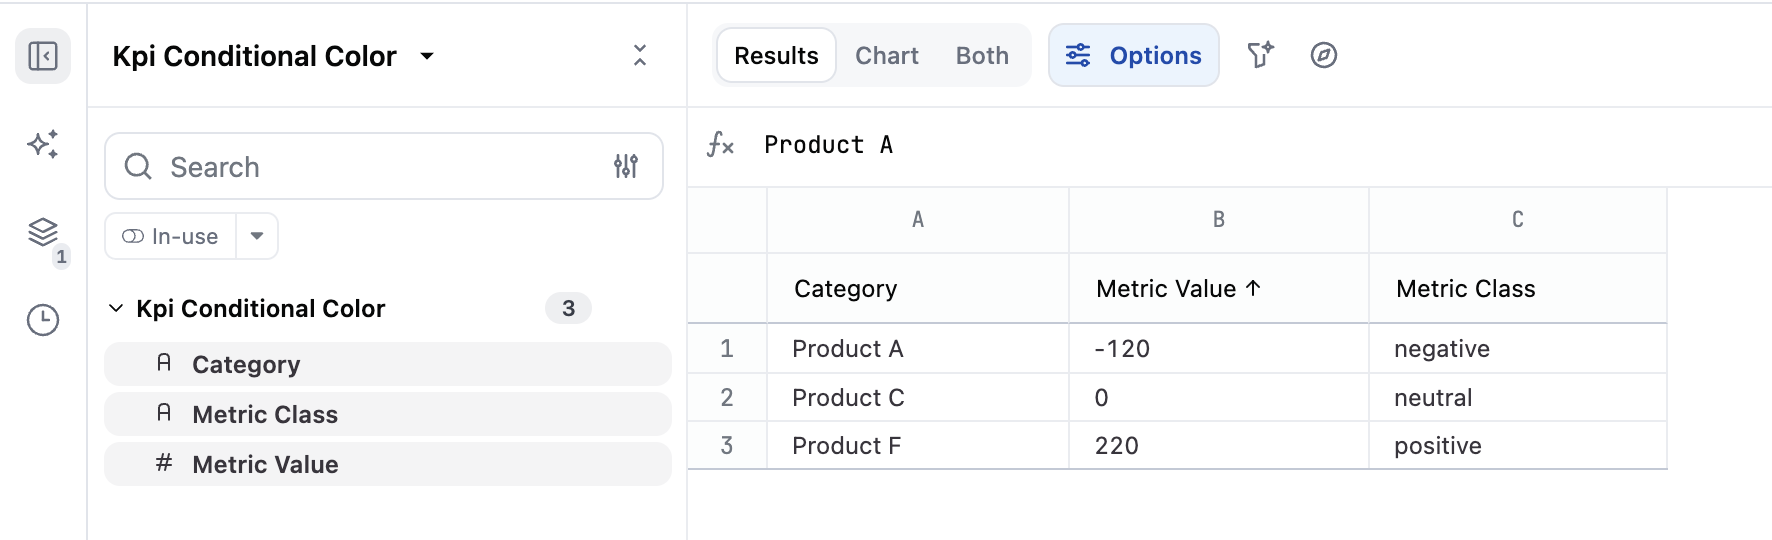
<img src="https://mintcdn.com/omni-e7402367/i1NAoykTWGwaiZWJ/showcase/visualizations/images/kpi-conditional-charts-query.png?fit=max&auto=format&n=i1NAoykTWGwaiZWJ&q=85&s=b07a8f5aae396cd9173b3ea45bc153c2" alt="Conditional values in workbook query results" width="1772" height="540" data-path="showcase/visualizations/images/kpi-conditional-charts-query.png" />

## Example code

```html theme={null}
<style>
.kpi-visualization.negative {
  color: red;
}

.kpi-visualization.positive {
  color: green;
}

.kpi-visualization.neutral {
  color: gray;
}
</style>

<div class="kpi-visualization kpi-vertical-center {{result._first.kpi_conditional_color.metric_class.raw}}">
  <div class="kpi-markdown-wrapper kpi-align-center">
    <single-value label="Metric Value">
      <span>{{result._first.kpi_conditional_color.metric_value.value}}</span>
    </single-value>
  </div>
</div>
```
