> ## Documentation Index
> Fetch the complete documentation index at: https://docs.omni.co/llms.txt
> Use this file to discover all available pages before exploring further.

<AgentInstructions>

## Submitting Feedback

If you encounter incorrect, outdated, or confusing documentation on this page, submit feedback:

POST https://docs.omni.co/feedback

```json
{
  "path": "/showcase/visualizations/honeycomb-categorical",
  "feedback": "Description of the issue"
}
```

Only submit feedback when you have something specific and actionable to report.

</AgentInstructions>

# Honeycomb categorical chart

> The code for this example can be used in the Markdown visualization to create a hexagonal grid with a label and value in each cell.

Cells are colored by a categorical value, in this case by the gender majority per age. This chart uses the Mustache iterator syntax to draw a shape for each row in the results.

<img src="https://mintcdn.com/omni-e7402367/NPCbSR0hOlCzzT5f/images/docs/visualization-and-dashboards/visualization-types/markdown/examples/assets/images/honeycomb-categorical-4173833e0ef0d615a07a54dca5807dbc.png?fit=max&auto=format&n=NPCbSR0hOlCzzT5f&q=85&s=c9d7288d0fcf579500c31826a558d047" alt="" width="1740" height="1166" data-path="images/docs/visualization-and-dashboards/visualization-types/markdown/examples/assets/images/honeycomb-categorical-4173833e0ef0d615a07a54dca5807dbc.png" />

## Setup

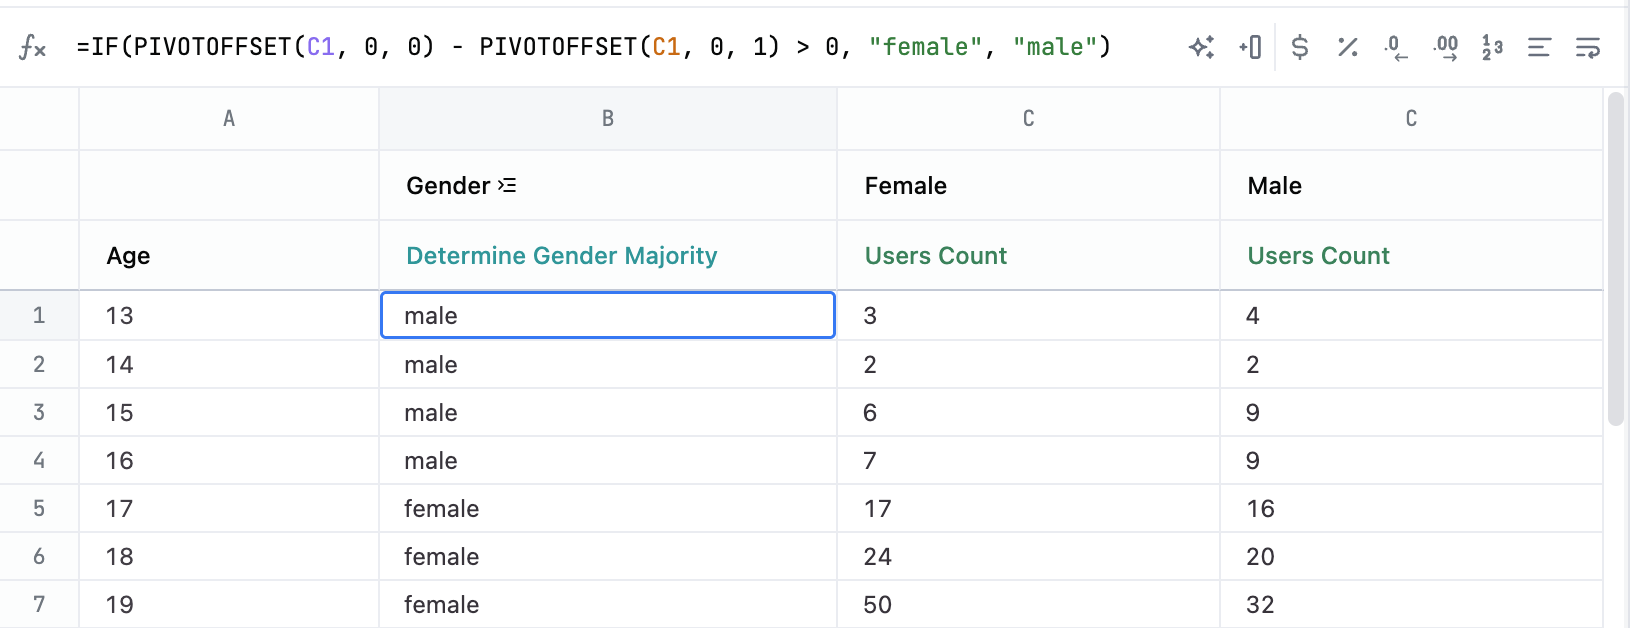
Your query should have a dimension that determines the number of hexagons, their labels and some way to determine color. The following table explains each field used in the example, including the calculation formulas.
<img src="https://mintcdn.com/omni-e7402367/NPCbSR0hOlCzzT5f/images/docs/visualization-and-dashboards/visualization-types/markdown/examples/assets/images/honeycomb-categorical-results-c52d59d4c6dc78feb34d14c2064fd244.png?fit=max&auto=format&n=NPCbSR0hOlCzzT5f&q=85&s=3ea1309ee5c72292f800a9c68f753671" alt="" width="1630" height="628" data-path="images/docs/visualization-and-dashboards/visualization-types/markdown/examples/assets/images/honeycomb-categorical-results-c52d59d4c6dc78feb34d14c2064fd244.png" />

| Col   | Name                                 | Description or formula                                                   | Purpose                                                |
| ----- | ------------------------------------ | ------------------------------------------------------------------------ | ------------------------------------------------------ |
| A     | Age                                  | query field                                                              | determines number of hexagons to make and their labels |
| B     | Determine Gender Majority (`calc_1`) | =IF(PIVOTOFFSET(C1, 0, 0) - PIVOTOFFSET(C1, 0, 1) > 0, "female", "male") | more male or female calculation                        |
| C     | Users Count                          | query field                                                              | values to count                                        |
| Pivot | Gender                               | query field                                                              | breakdown                                              |

## Example code

```html expandable theme={null}
<style>
h3 {
  margin-block: 0;
}

h4 {
  margin-top: 0;
  color: var(--color-text1);
  font-size: var(--font-sm);
}

.honeycomb2 {
  --hc-width: 60px;
  --hc-height: calc(1.1547 * var(--hc-width)); /* 1.1547 ~= 2/sqrt(3) */
  --hc-gap: 8px;
  /* calculate width based on # of cells you want per row
     will also need to adjust the css below for offsets */
  width: calc(12.5 * var(--hc-width) + 12 * var(--hc-gap));
  margin: 0;
  padding: 0;
  list-style: none;
  display: flex;
  flex-wrap: wrap;
  flex-direction: row;
  gap: 0 var(--hc-gap);

  & li {
    width: var(--hc-width);
    height: var(--hc-height);
    margin: 0;
    padding: 0;
    display: flex;
    background-color: var(--color-border1);
    clip-path: polygon(50% 0%, 100% 25%, 100% 75%, 50% 100%, 0% 75%, 0% 25%);
    display: grid;
    grid-template-rows: 1fr 1fr;
    margin-top: calc(var(--hc-height) / -6);

    & .hex-label {
      text-align: center;
      font-size: 12px;
      width: 100%;
    }

    & .hex-value {
      display: flex;
      flex-direction: column;
      justify-content: flex-end;
      align-items: center;
      font-size: 16px;
      font-weight: bold;
    }
  }

  & li.female {
    background-color: var(--color-critical4);
  }

  & li.male {
    background-color: var(--color-info4);
  }

  /* # of cells */
  & li:nth-of-type(12n + 1) {
    margin-left: calc(var(--hc-width) / 2 + var(--hc-gap) / 2);
  }

  & li:first-of-type,
  & li:nth-of-type(24n + 1) {
    margin-left: 0;
  }

  & li:nth-of-type(-n + 12) {
    margin-top: 0;
  }
}
</style>

<h3>Are there more male or female shoppers?</h3>
<h4>Broken down by age of shopper</h4>

<ul class="honeycomb2">
  {{#result}}
  <li class="{{calc_1.value}}">
    <span class="hex-value">{{users.age.value}}</span>
    <span class="hex-label">{{calc_1.value}}</span>
  </li>
  {{/result}}
</ul>
```
