> ## Documentation Index
> Fetch the complete documentation index at: https://docs.omni.co/llms.txt
> Use this file to discover all available pages before exploring further.

# Dumbbell plot

> The code for this example can be used in the Markdown visualization to create a table of dumbbell charts.

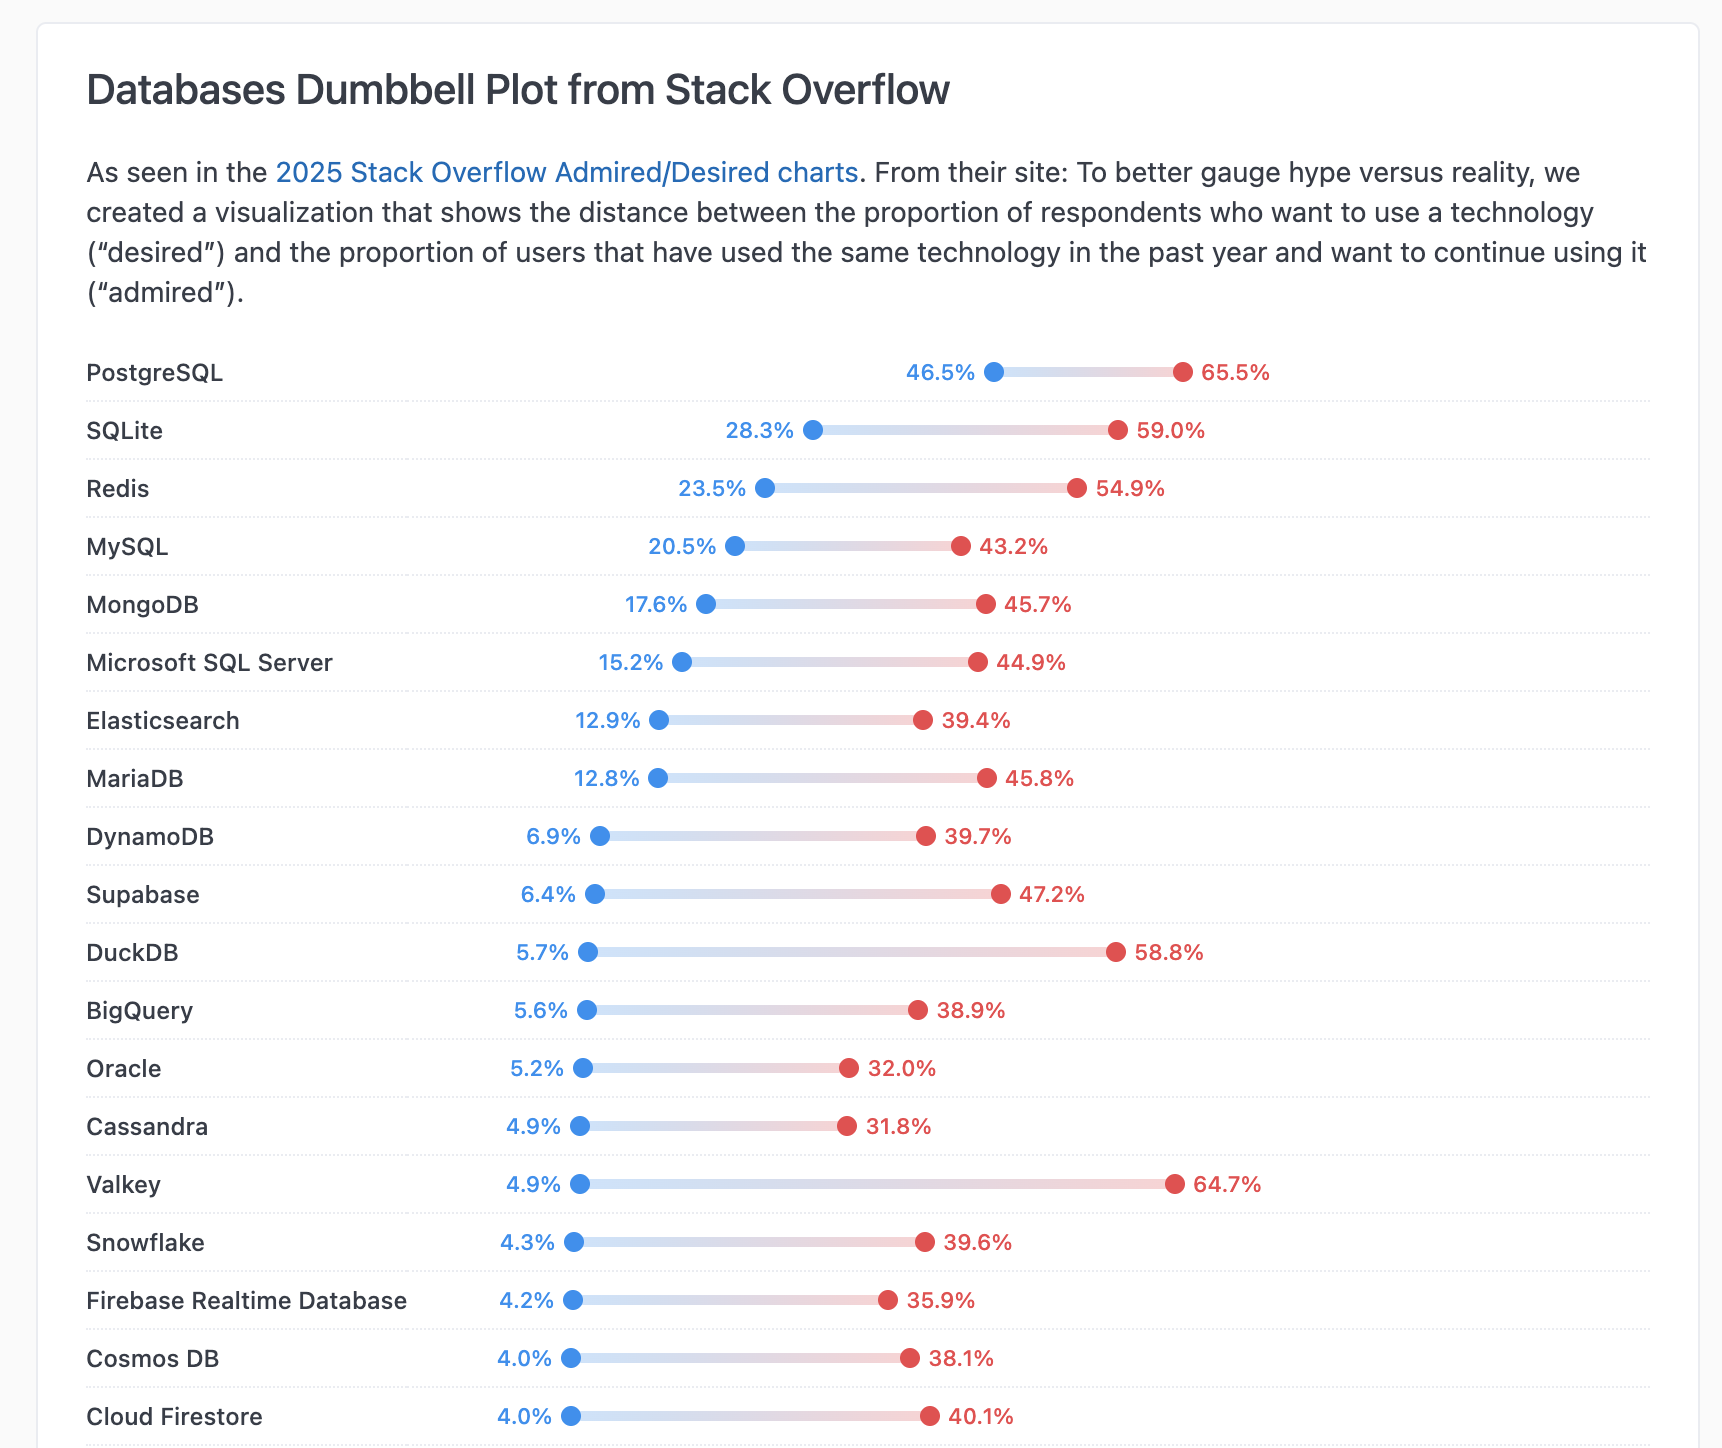
Sometimes called barbell plots or connected dot plots, these charts are good for comparing related data points across a category. This example was inspired by charts in the results of the [2025 Stack Overflow Survey](https://survey.stackoverflow.co/2025/technology#admired-and-desired).

<img src="https://mintcdn.com/omni-e7402367/aZ84MHc8H0bDix_i/images/docs/visualization-and-dashboards/visualization-types/markdown/examples/assets/images/dumbbell-plot-0190bd16d1cd5a35e8099a8e0b8bb9bc.png?fit=max&auto=format&n=aZ84MHc8H0bDix_i&q=85&s=16b509ae9499ff02480c2d872a3911be" alt="" width="1722" height="1448" data-path="images/docs/visualization-and-dashboards/visualization-types/markdown/examples/assets/images/dumbbell-plot-0190bd16d1cd5a35e8099a8e0b8bb9bc.png" />

## Setup

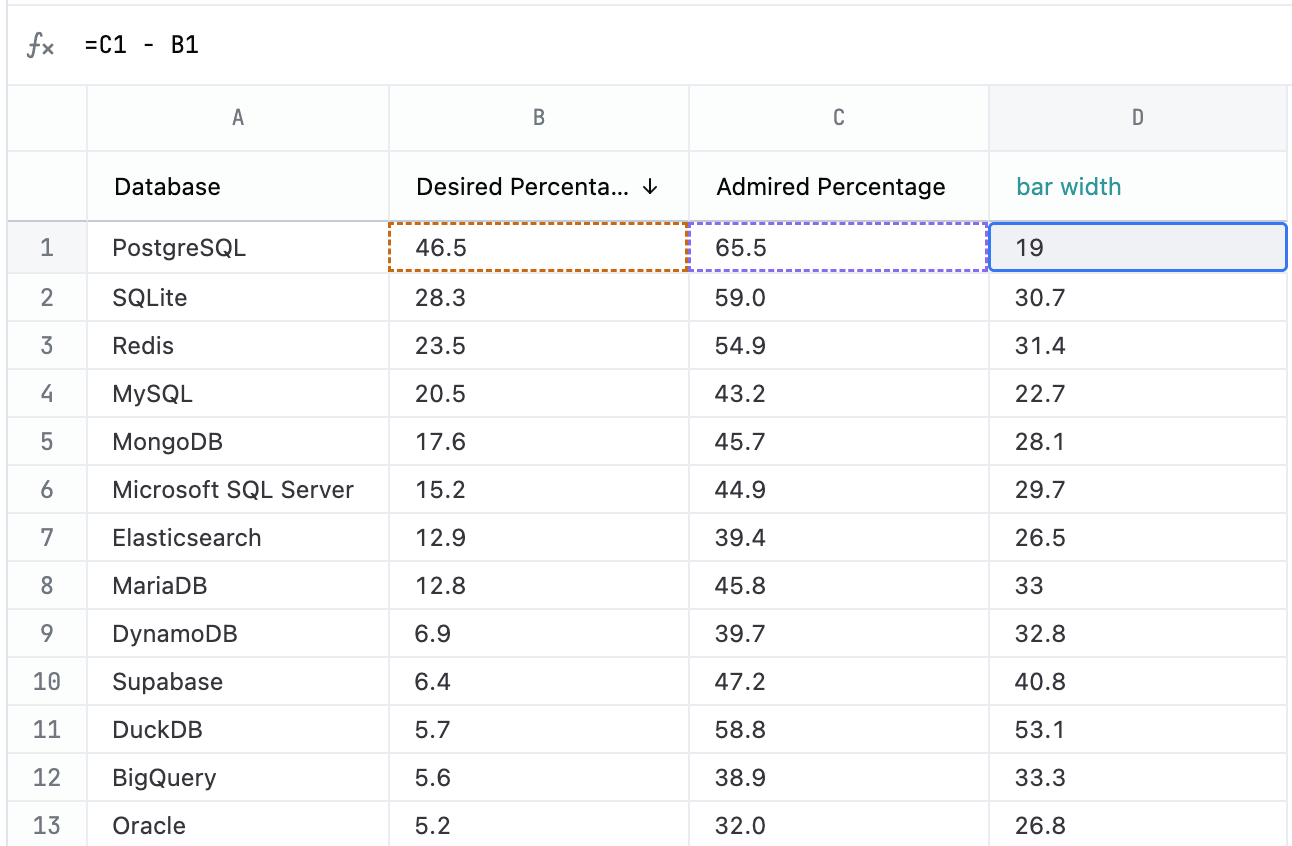
These charts use the Mustache iterator syntax to draw a chart for each row in the results. Your query should have a column with the category label for each dumbbell that you want to display along with the start and end values for each category. Additionally, you'll need a calculation to get the length of the bar.

**Note:** This example only covers a positive change between start and end values. You'll need to make some adjustments if the change you are measuring can also be negative.

The following table explains each field used in the example, including the calculation formulas.
<img src="https://mintcdn.com/omni-e7402367/aZ84MHc8H0bDix_i/images/docs/visualization-and-dashboards/visualization-types/markdown/examples/assets/images/dumbbell-plot-results-561f892f3eef64fa02ffe8ce950174a3.png?fit=max&auto=format&n=aZ84MHc8H0bDix_i&q=85&s=53da603c9b07d4804beacd93ef5793ff" alt="" width="1292" height="846" data-path="images/docs/visualization-and-dashboards/visualization-types/markdown/examples/assets/images/dumbbell-plot-results-561f892f3eef64fa02ffe8ce950174a3.png" />

| Col | Name               | Description or formula | Purpose                        |
| --- | ------------------ | ---------------------- | ------------------------------ |
| A   | Database           | query field            | Label of the category          |
| B   | Desired Percentage | query field            | start (left) value of dumbbell |
| C   | Admired Percentage | query field            | end (right) value of dumbbell  |
| D   | bar width          | =C1 - B1               | Length of the bar              |

## Example code

```html expandable theme={null}
<style>
h3 {
  margin-top: 0;
}

.dumbbell-plot-table {
  --start-color: #0891F2;
  --end-color: #F1434B;
  --dot-radius: 5px;
  --dot-diameter: calc(var(--dot-radius) * 2);
  --label-width: 7ch;
  --line-opacity: 0.25;
  --border-style: 1px dotted color-mix(in srgb, var(--color-border1), transparent 0%);

  list-style: none;
  margin: 0;
  padding: 0;
  display: grid;
  grid-template-columns: min-content 1fr;
  width: 100%;
}

.dumbbell-plot-table h4 {
  white-space: nowrap;
  margin: 0;
  font-size: var(--font-xs);
  border-bottom: var(--border-style);
}

.dumbbell-plot-table section.dumbbell-plot-wrapper {
  padding-inline: var(--label-width);
  border-bottom: var(--border-style);
}

ul.dumbbell-plot {
  position: relative;
  margin: 0;
  padding: 0;
  list-style: none;
  width: 100%;
  height: 100%;
  display: flex;
  flex-direction: row;
  gap: 0;
  align-items: center;

  & li.dot-label {
    position: absolute;
    width: var(--label-width);
    display: flex;
    flex-direction: row;
    align-items: center;
    gap: 4px;
    font-size: var(--font-xxs);
    font-weight: 500;
  }

  & li.dot-start {
    justify-content: flex-end;
    color: var(--start-color);

    & span.dot {
      background-color: var(--start-color);
    }
  }

  & li.dot-end {
    justify-content: flex-start;
    color: var(--end-color);

    & span.dot {
      background-color: var(--end-color);
    }
  }

  & li .dot {
    display: inline-block;
    width: var(--dot-diameter);
    height: var(--dot-diameter);
    border-radius: 50%;
    flex: 0 0 var(--dot-diameter);
  }

  & li.dot-span {
    position: absolute;
    background: magenta;
    display: flex;
    flex-direction: column;
    justify-content: space-around;
    opacity: var(--line-opacity);

    & span.line {
      display: block;
      height: var(--dot-radius);
      background-image: linear-gradient(to right, var(--start-color), var(--end-color));
      width: 100%;
    }
  }
}

ul.dumbbell-plot-legend {
  list-style: none;
  margin: 0;
  padding: 12px 0;
  display: flex;
  flex-direction: row;
  gap: 16px;
  font-size: var(--font-xs);
  font-weight: 500;
  grid-column: 1 / 2;

  & li {
    display: flex;
    flex-direction: row;
    gap: 6px;
    align-items: center;
  }

  & .dumbbell-plot-legend-dot {
    width: 10px;
    height: 10px;
    background-color: pink;
    display: block;
    border-radius: 50%;
  }

  & .dumbbell-plot-legend-dot.start {
    background-color: var(--start-color);
  }

  & .dumbbell-plot-legend-dot.end {
    background-color: var(--end-color);
  }
}
</style>

<h3>Databases Dumbbell Plot from Stack Overflow</h3>
<p>As seen in the <a href="https://survey.stackoverflow.co/2025/technology#admired-and-desired">2025 Stack Overflow Admired/Desired charts</a>. From their site: To better gauge hype versus reality, we created a visualization that shows the distance between the proportion of respondents who want to use a technology ("desired") and the proportion of users that have used the same technology in the past year and want to continue using it ("admired").</p>

<article class="dumbbell-plot-table">
  {{#result}}
  <h4>{{stackoverflow_databases.database.value}}</h4>
  <section class="dumbbell-plot-wrapper">
    <ul class="dumbbell-plot">
      <li class="dot-span" style="left:{{stackoverflow_databases.desired_percentage.value_static}}%; width: {{calc_1.value_static}}%;"><span class="line"></span></li>
      <li class="dot-label dot-start" style="left: calc({{stackoverflow_databases.desired_percentage.value_static}}% - var(--label-width) + var(--dot-radius))"><span class="label">{{stackoverflow_databases.desired_percentage.value}}%</span><span class="dot"></span></li>
      <li class="dot-label dot-end" style="left:calc({{stackoverflow_databases.admired_percentage.value_static}}% - var(--dot-radius));"><span class="dot"></span><span clas="label">{{stackoverflow_databases.admired_percentage.value}}%</span></li>
    </ul>
  </section>
  {{/result}}
  <ul class="dumbbell-plot-legend">
    <li><span class="dumbbell-plot-legend-dot start"></span>Desired</li>
    <li><span class="dumbbell-plot-legend-dot end"></span>Admired</li>
  </ul>
</article>
```