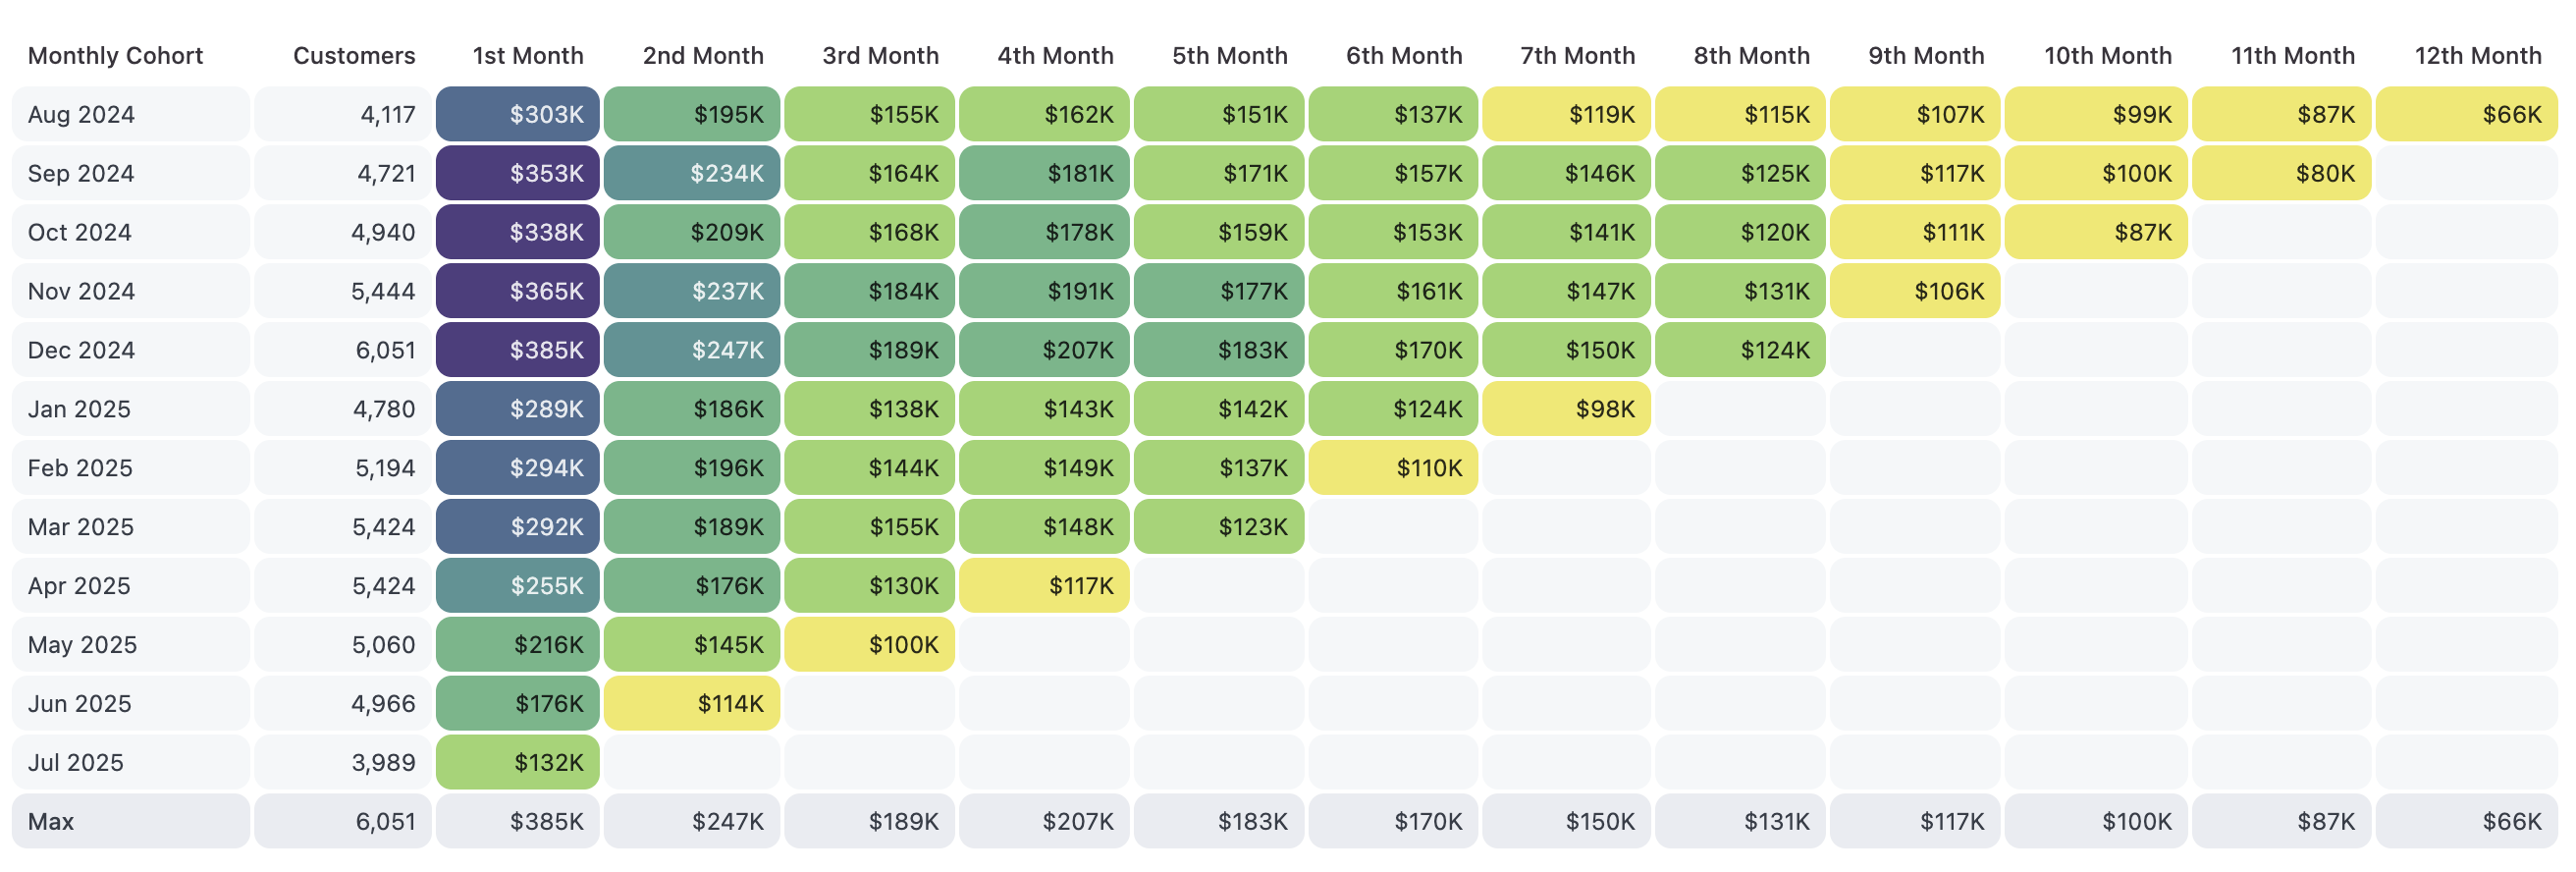
 ## Setup
To build this chart you will need to structure your query with the cohorts as the rows and the time passed as the pivot. A calculation is used to pull the cohort size out of the pivot. Additional calculations are necessary to figure out how to color each cell. We'll also need the [column totals](/analyze-explore/point-click-queries#column-totals) enabled.
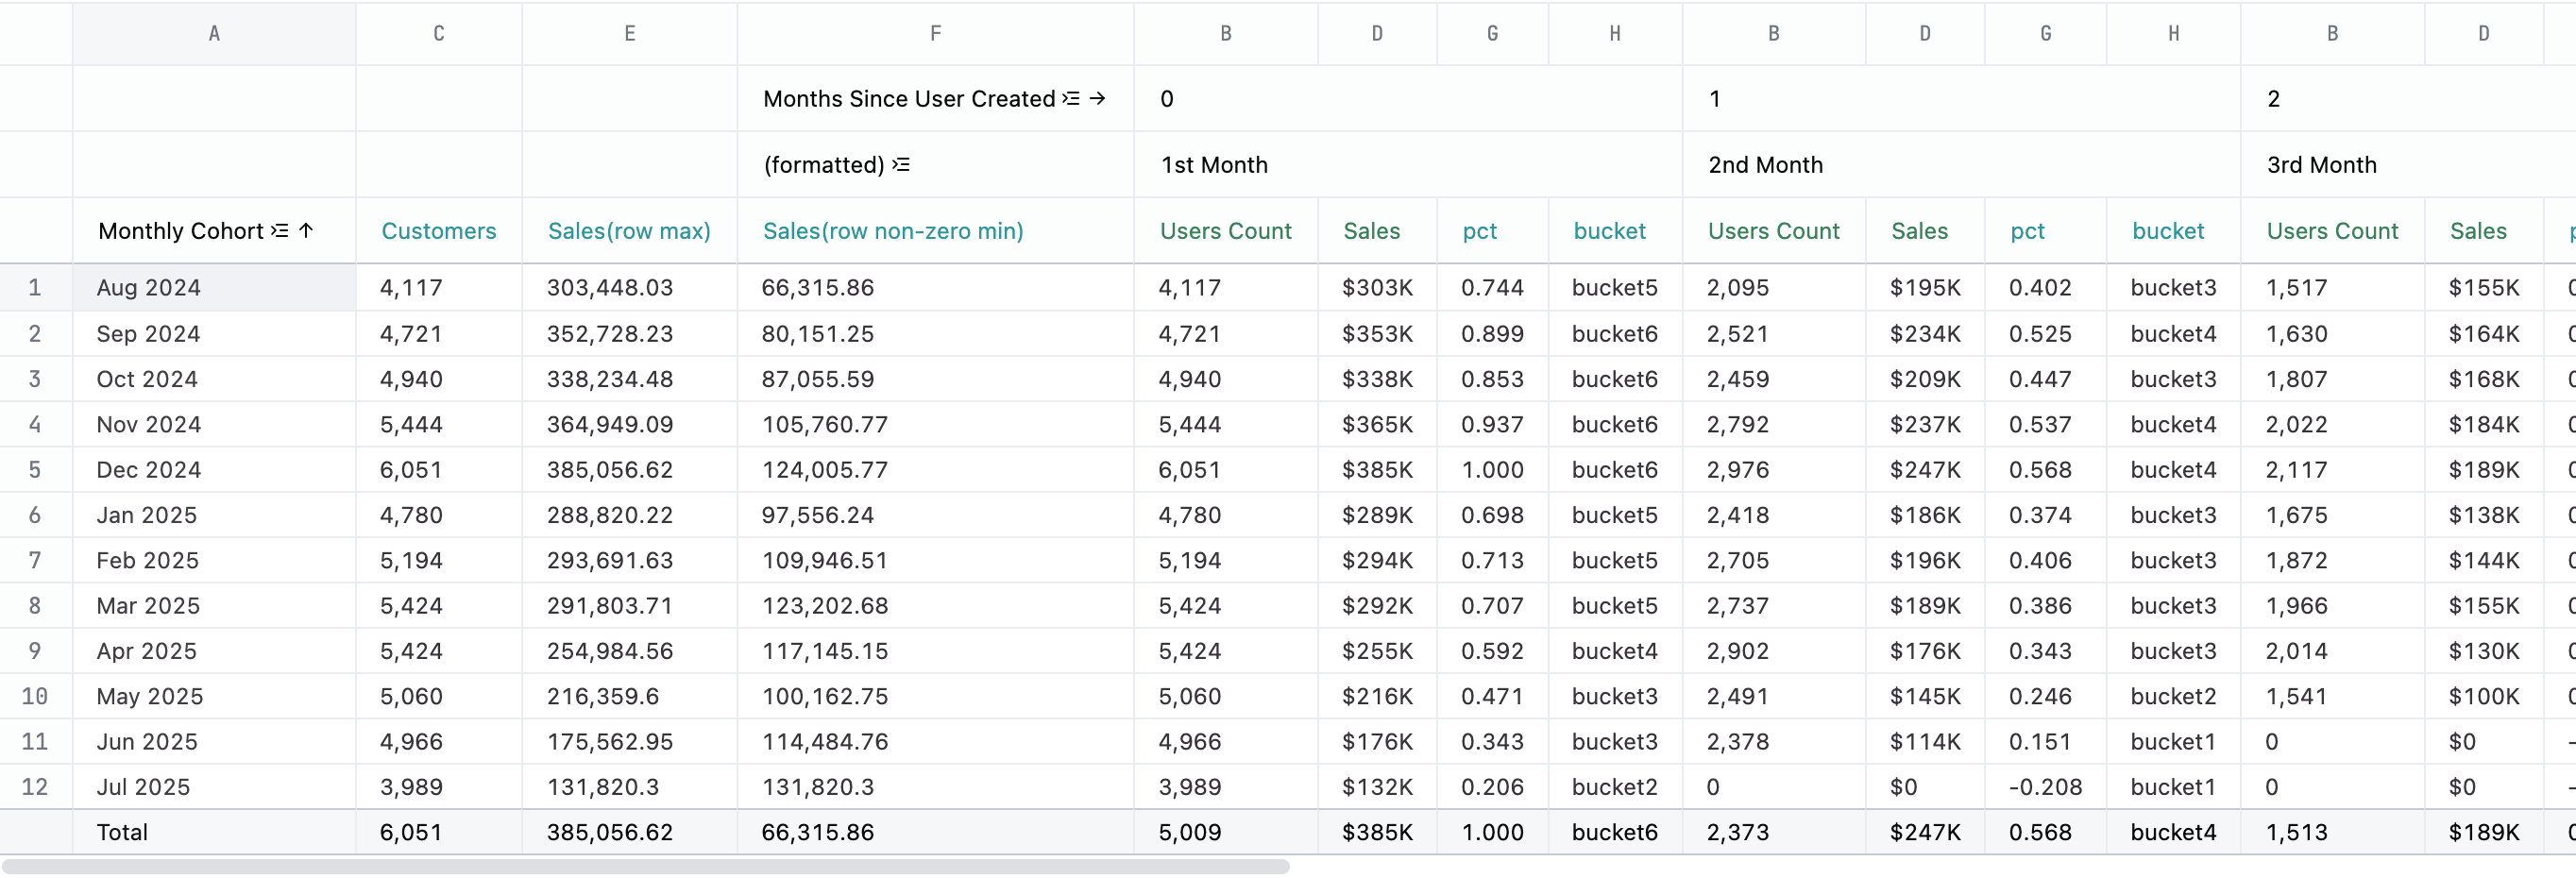
The following table explains each field used in the example, including the calculation formulas.
| Col | Name | Description or formula | Purpose |
| --- | ------------------------ | --------------------------------------------------------------------------------------------------------------------------------------------------------- | --------------------------------------------------------------------------------------------------------------------------------------------------- |
| A | Monthly cohort | query field | A row for each cohort, sorted with the oldest at the top |
| B | Users Count | query field | Count of users in the cohort (inside pivot) |
| C | Customers | =PIVOTOFFSET(B1, 0, 0) | First column of users count is the size of the cohort |
| D | Sales | query field | Total sales for the cohort (inside pivot) |
| E | Sales (row max) | =MAX(PIVOTROW(D1)) | Maximum sales value for the row - set total calculation to `maximum` |
| F | Sales (row non-zero min) | =IFERROR(MINIFS(PIVOTROW(D1), PIVOTROW(D1), ">0"), 0) | Minimum non-zero value for the row. If row is all zeros, will set to 0. Set total calculation to `minimum` |
| G | pct | =(D1 - F\_TOTAL) / (E\_TOTAL - F\_TOTAL) | how close to the max value is the current cell - will be a value between 0 and 1 where 0 is the overall min sales value, 1 is the overall max value |
| H | bucket | =IF(G1 \<= 0.167, "bucket1", IF(G1 \<= 0.333, "bucket2", IF(G1 \<= 0.5, "bucket3", IF(G1 \<= 0.667, "bucket4", IF(G1 \<= 0.833, "bucket5", "bucket6"))))) | string to identify bin for coloring |
Don't forget to [enable the column totals and adjust the total calculation](/analyze-explore/point-click-queries#column-totals) as follows:
* column D - Sales - to be `maximum`
* column E - Sales (row max) - to be `maximum`
* column F - Sales (row non-zero min) - to be `minimum`
## Setup
To build this chart you will need to structure your query with the cohorts as the rows and the time passed as the pivot. A calculation is used to pull the cohort size out of the pivot. Additional calculations are necessary to figure out how to color each cell. We'll also need the [column totals](/analyze-explore/point-click-queries#column-totals) enabled.
The following table explains each field used in the example, including the calculation formulas.
| Col | Name | Description or formula | Purpose |
| --- | ------------------------ | --------------------------------------------------------------------------------------------------------------------------------------------------------- | --------------------------------------------------------------------------------------------------------------------------------------------------- |
| A | Monthly cohort | query field | A row for each cohort, sorted with the oldest at the top |
| B | Users Count | query field | Count of users in the cohort (inside pivot) |
| C | Customers | =PIVOTOFFSET(B1, 0, 0) | First column of users count is the size of the cohort |
| D | Sales | query field | Total sales for the cohort (inside pivot) |
| E | Sales (row max) | =MAX(PIVOTROW(D1)) | Maximum sales value for the row - set total calculation to `maximum` |
| F | Sales (row non-zero min) | =IFERROR(MINIFS(PIVOTROW(D1), PIVOTROW(D1), ">0"), 0) | Minimum non-zero value for the row. If row is all zeros, will set to 0. Set total calculation to `minimum` |
| G | pct | =(D1 - F\_TOTAL) / (E\_TOTAL - F\_TOTAL) | how close to the max value is the current cell - will be a value between 0 and 1 where 0 is the overall min sales value, 1 is the overall max value |
| H | bucket | =IF(G1 \<= 0.167, "bucket1", IF(G1 \<= 0.333, "bucket2", IF(G1 \<= 0.5, "bucket3", IF(G1 \<= 0.667, "bucket4", IF(G1 \<= 0.833, "bucket5", "bucket6"))))) | string to identify bin for coloring |
Don't forget to [enable the column totals and adjust the total calculation](/analyze-explore/point-click-queries#column-totals) as follows:
* column D - Sales - to be `maximum`
* column E - Sales (row max) - to be `maximum`
* column F - Sales (row non-zero min) - to be `minimum`
 ## Example code
```html expandable theme={null}
## Example code
```html expandable theme={null}
| Monthly Cohort | Customers | 1st Month | 2nd Month | 3rd Month | 4th Month | 5th Month | 6th Month | 7th Month | 8th Month | 9th Month | 10th Month | 11th Month | 12th Month |
|---|---|---|---|---|---|---|---|---|---|---|---|---|---|
| {{ecomm__users.created_at[month].value}} | {{calc_1.value_static}} | {{0.1st Month.ecomm__order_items.sale_price_sum.value}} | {{1.2nd Month.ecomm__order_items.sale_price_sum.value}} | {{2.3rd Month.ecomm__order_items.sale_price_sum.value}} | {{3.4th Month.ecomm__order_items.sale_price_sum.value}} | {{4.5th Month.ecomm__order_items.sale_price_sum.value}} | {{5.6th Month.ecomm__order_items.sale_price_sum.value}} | {{6.7th Month.ecomm__order_items.sale_price_sum.value}} | {{7.8th Month.ecomm__order_items.sale_price_sum.value}} | {{8.9th Month.ecomm__order_items.sale_price_sum.value}} | {{9.10th Month.ecomm__order_items.sale_price_sum.value}} | {{10.11th Month.ecomm__order_items.sale_price_sum.value}} | {{11.12th Month.ecomm__order_items.sale_price_sum.value}} |
| Max | {{result._totals.0.calc_1.value_static}} | {{result._totals.0.0.1st Month.ecomm__order_items.sale_price_sum.value_static}} | {{result._totals.0.1.2nd Month.ecomm__order_items.sale_price_sum.value_static}} | {{result._totals.0.2.3rd Month.ecomm__order_items.sale_price_sum.value_static}} | {{result._totals.0.3.4th Month.ecomm__order_items.sale_price_sum.value_static}} | {{result._totals.0.4.5th Month.ecomm__order_items.sale_price_sum.value_static}} | {{result._totals.0.5.6th Month.ecomm__order_items.sale_price_sum.value_static}} | {{result._totals.0.6.7th Month.ecomm__order_items.sale_price_sum.value_static}} | {{result._totals.0.7.8th Month.ecomm__order_items.sale_price_sum.value_static}} | {{result._totals.0.8.9th Month.ecomm__order_items.sale_price_sum.value_static}} | {{result._totals.0.9.10th Month.ecomm__order_items.sale_price_sum.value_static}} | {{result._totals.0.10.11th Month.ecomm__order_items.sale_price_sum.value_static}} | {{result._totals.0.11.12th Month.ecomm__order_items.sale_price_sum.value_static}} |