Query performance
Omni uses multi-layer caching and aggregate awareness to optimize query performance and reduce data warehouse load, enabling fast access to data at any level of detail. In this guide, you'll learn techniques like intelligent query routing and pre-aggregation to ensure consistently high performance.
Caching
Omni caches data at several layers to improve performance and reduce load on the underlying data warehouse.
Query cache
Omni caches the results of individual queries to share between users observing the exact same data sets. Query results are cached for 6 hours by default, and shared between users with relevant permissions to the data set. The default can be configured using caching model parameters at a model or topic level, outlined here.
This means if one user queries a workbook or dashboard and shares the link with another user, the second user's results will frequently come from the query cache. This cache will only trigger for exact match of the query (all fields, pivots, filters, sorts).
The query cache can be cleared on an ad hoc basis:
- From the workbook: Tab > Run w/o Cache
- From the dashboard: View > Refresh Data
Requeryable cache
In addition to the exact match cache, Omni will cache data for requery, offering acceleration to similar follow up queries, filtering, or sorting during a given session.
This cache is volume based and will hold the last 30 query results from a session. When data is returned without hitting the query limit, Omni will requery the data set when appropriate, offering much quicker query response times as the data is queried in the browser.
Let's take a look at some examples of the requeryable cache:
- Re-sorting a data set - Orders last 30 days, by day, sorted by day descending --> Invert to sort ascending
- Filtering a result set - Orders last 30 days, by day --> Orders last 7 days, by day
- Regrouping a data set - Orders by city (note query limit must not be hit) --> Order by state
- Pivoting - Orders by date, status --> Orders by date, pivoted by status
Here's a quick example where we aggregate users over a random selection of states in memory. We also quickly show the comparison to dropping back down to the database:
Utilizing the requeryable cache
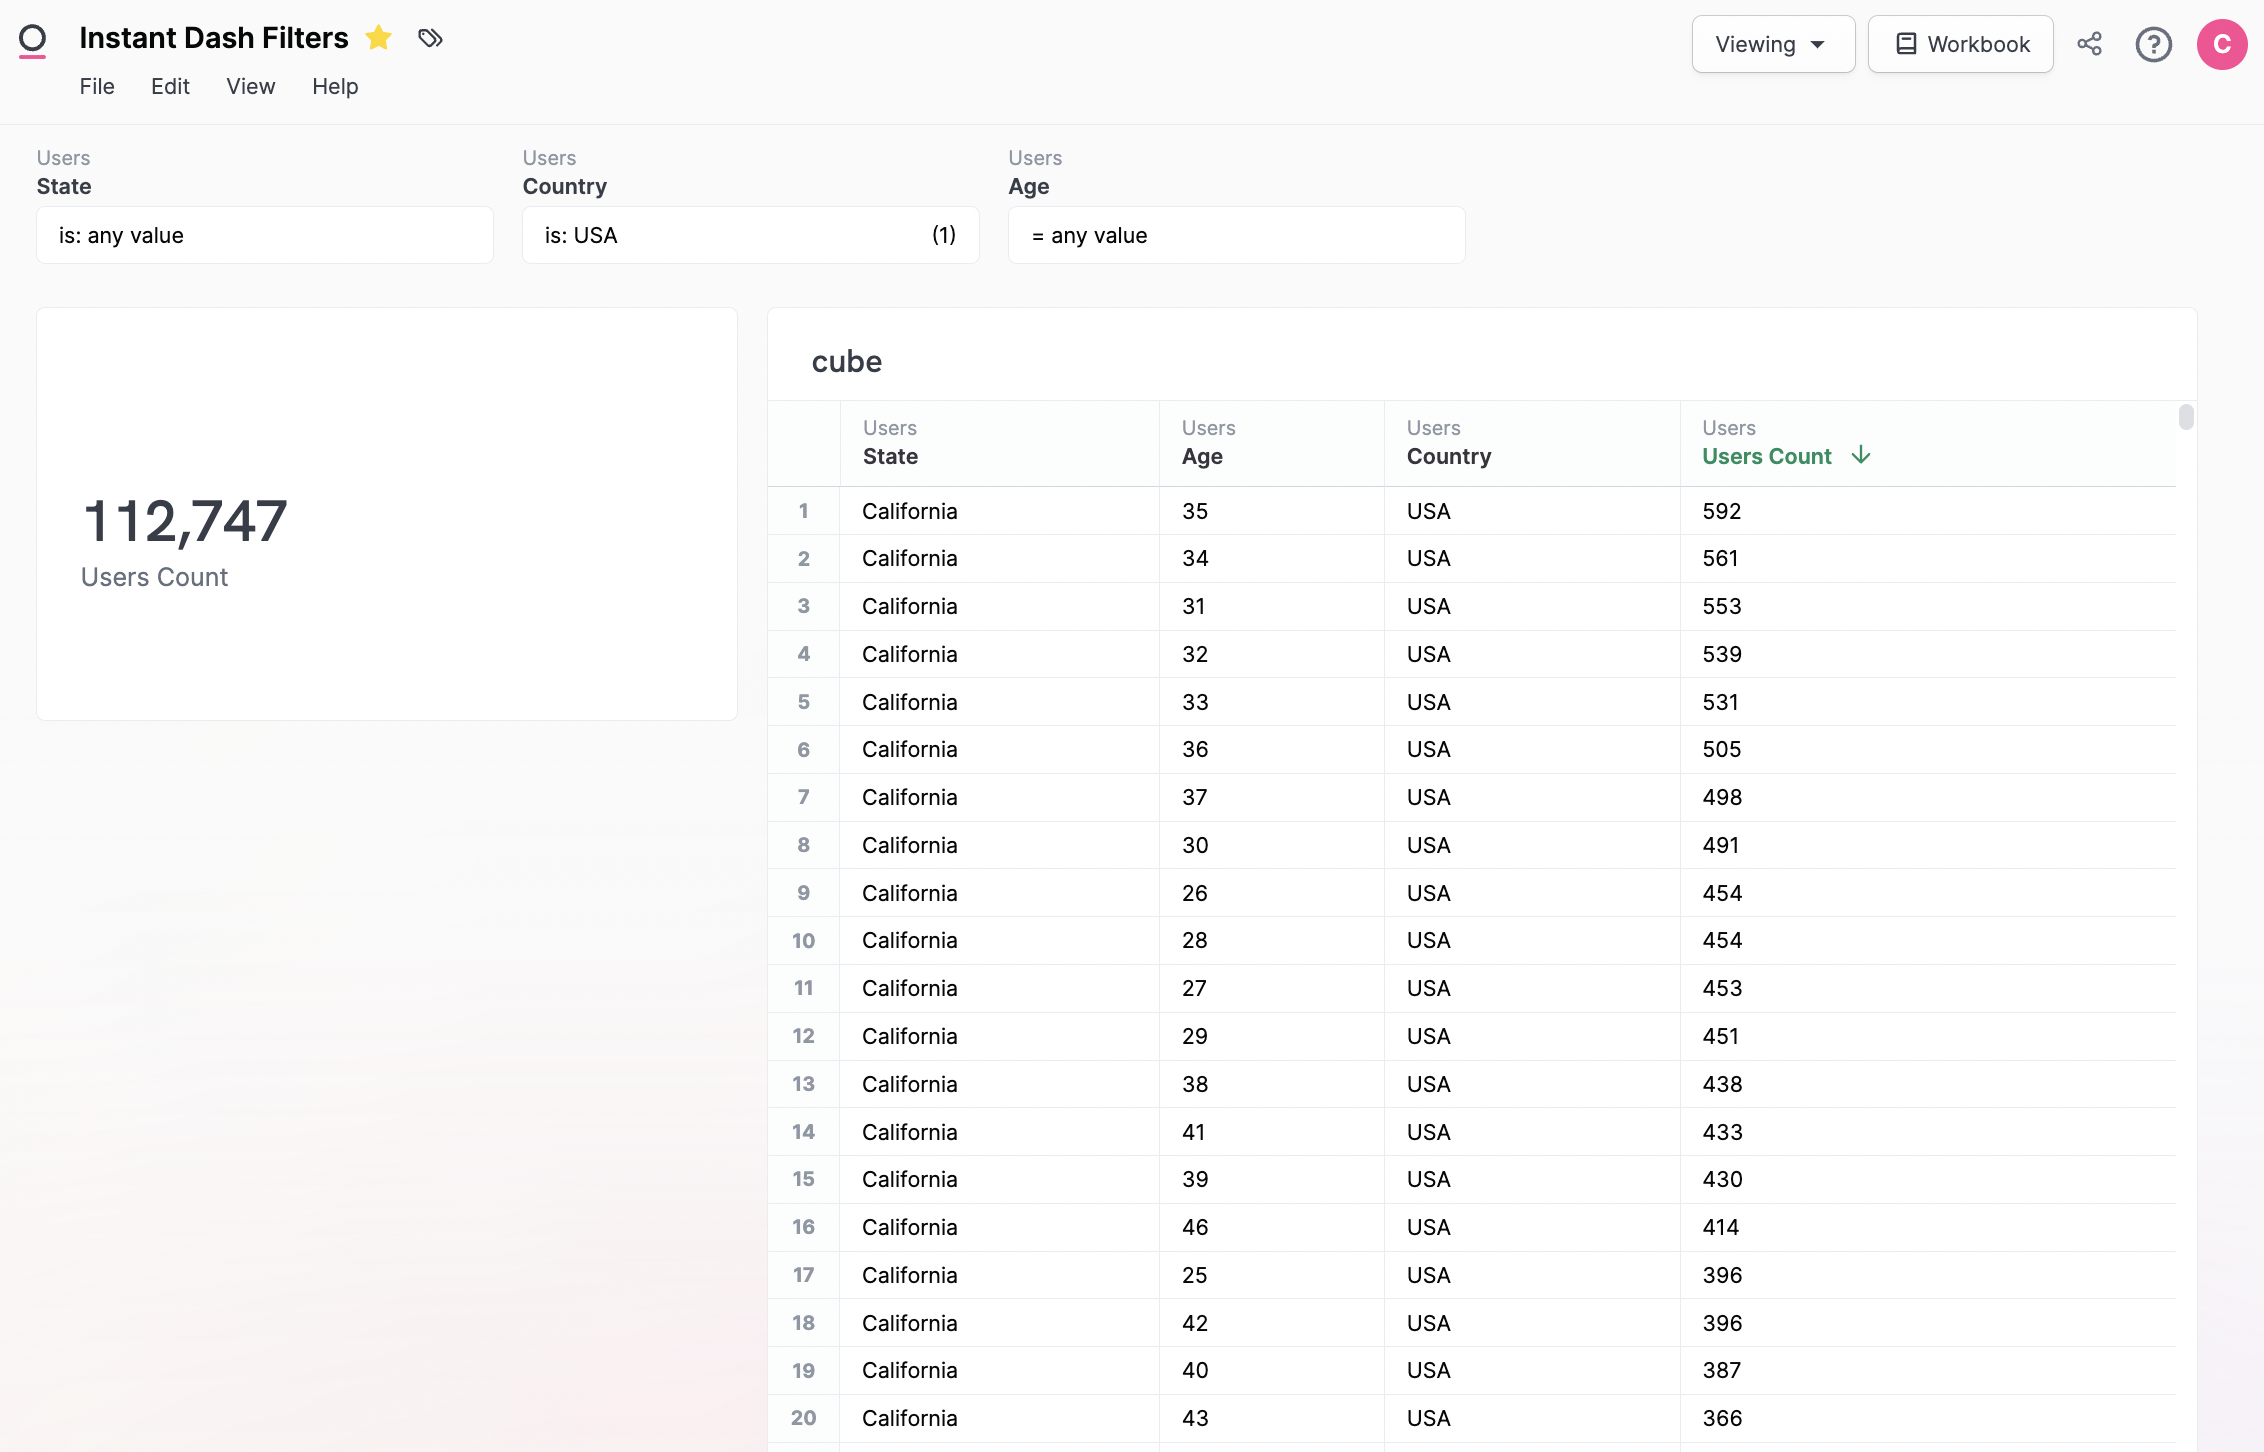
Huge unlocks in performance are available when being thoughtful about caching. Whole dashboards can be brought in memory for instant slice and dice, rather than each filter permutation hitting the database. Over time this will be automated for dashboards, but to build requeryable dashboard caching, the filters can be appended to dashboard tiles to build cubes.
A simple example:
- This dashboard has one single-value tile counting total orders in the filtered set
- The table on the right shows the requeryable data set needed to cache each filter permuation
- The underlying value:
orders.count - The filters:
users.age,users.state,users.country
- The underlying value:
This means when the table to the right is loaded, we have every permutation of the filters, and all requery will be in-memory in the browser. This technique can be refined for entire dashboards to create psuedo-instant query response times.
Cache timing
Currently the exact-match cache has a 6 hour expiry window by default. As mentioned above, this is configurable using cache policy model parameters outlined here. The browser requeryable cache will stay as long as the window is active, so may persist longer than expected. The browser requeryable cache will be configurable in the future.
Cache warming (preemptively caching data)
It's often a good idea to proactively warm the cache - if the first run can take a good bit and the dashboard will have heavy usage, it can be cached before the first user experiences the slower dashboard load. This can also sidestep having a stale cache entry (say someone loaded a dashboard yesterday and the cache was set to 24 hours to reduce cost).
We can take advantage of the fact that the scheduler will always skip the cache and run queries fresh. This means if we schedule a dashboard, we are also building a fresh cache entry that future users can rely upon.
A quick instructive example:
- 9pm: User runs a dashboard with data fresh as of 9pm. The model is caching data for 24 hours, and thus this dashboard cache will populate results tomorrow morning for any users that load the same dashboard.
- 6am: New data has come in overnight.
- 7:30am: Dashboard is scheduled to run. This busts the cache and replaces the cache with data fresh as of 7:30am.
- 8am: User loads the dashboard from the web browser, now with cached data as of 7:30am when the scheduler was run (rather than data from 9pm the day before if the scheduler was not run).
Disabling caching
Caching can be turned off by setting the cache window to zero via a cache_policy. Example below:
cache_policies:
  dont_cache_at_all:
    max_cache_age: 0 seconds
Aggregate awareness
Aggregate awareness enables you to optimize query performance by intelligently routing queries to pre-aggregated tables in your data warehouse. This allows end users to access data at different levels of granularity without needing to manually specify which table to query. Omni automatically determines the most efficient table to use based on the query's structure.
Key concepts
Aggregate awareness
Omni understands the level of aggregation required by a query and dynamically selects the appropriate table (granular or aggregated) in the model to retrieve the data.
Bring your own aggregates
You, the user, create the aggregated tables using your preferred transformation tool. This provides flexibility and control over the aggregation process. Omni then leverages these tables for optimized query performance.
Setup
Once you've identified the query you'd like to optimize, follow these steps to implement aggregate awareness:
-
Build an aggregate or rollup table within Omni or some other transformation layer such as dbt.
If you do this outside of Omni and don't see your table, refresh the schema to have Omni build it.
-
From the model IDE, add a
materialized_queryparameter to the optimized view to enable Omni to match the aggregate table to the underlying views.Note: The
fieldsparameter your materialized query definition should be in the same order as thedimensionsin the optimized table (see example below).
To demonstrate, let's say you have a table with the following definition and you want to optimize the performance of the daily aggregations:
-- order_items
dimensions:
  order_items.created_at: {}
  sale_price: {}
  user_id: {}
measure:
  count:
    aggregate_type: count
  sale_price_sum:
    aggregate_type: sum
    sql: ${sale_price}
  user_id_count_distinct:
    aggregate_type: count_distinct
    sql: ${user_id}
In your transformation layer, you have defined the following materialized table, which has pre-aggregated the metrics daily:
-- pre-aggregated table "daily_sales"
dimensions:
    date: {}
    total_sale_price: {}
    order_items_count: {}
    user_distinct_count: {}
The last step is to add the materialized_query parameter so that Omni knows when to reference the the preaggregated table.
materialized_query: # note that the order of fields below matches the order of the dimensions
  fields:
      [
      order_items.created_at,
      order_items.sale_price_sum,
      order_items.count,
      order_items.user_id_count_distinct
      ]
  base_view: order_items
Verifying aggregate awareness Now, at query runtime, Omni will dynamically swap in the aggregated table for the underlying table if it contains all the necessary fields to execute the query. Because the aggregated table is smaller than the underlying table, queries running against it will be faster and more efficient.
You can verify that aggregate awareness is working by inspecting the generated SQL using Omni's SQL inspector. The SQL inspector will show whether Omni is querying the aggregate table or the granular table.
-- Query rewritten to use materialized view "daily_sales".
-- The original unoptimized SQL is commented-out below
-- SELECT DATE_TRUNC('DAY', "created_at") AS "order_items.created_at[date]__raw",
--     COALESCE(SUM("sale_price"), 0) AS "order_items.sale_price_sum",
--     TO_CHAR(DATE_TRUNC('DAY', "created_at"), 'YYYY-MM-DD') AS "order_items.created_at[date]"
-- FROM "order_items"
-- GROUP BY 1
-- ORDER BY 1 NULLS FIRST
-- LIMIT 999

SELECT
    DATE_TRUNC('DAY', "date") AS "order_items.created_at[date]__raw",
    COALESCE(SUM(CAST("total_sale_price" AS DOUBLE PRECISION)), 0) AS "order_items.sale_price_sum",
    TO_CHAR(DATE_TRUNC('DAY', "date"), 'YYYY-MM-DD') AS "order_items.created_at[date]"
FROM (
  SELECT
      date,
      total_sale_price,
      order_items_count,
      users_distinct_count
  FROM "daily_orders"
    ) AS "t"
GROUP BY 1
ORDER BY 1 NULLS FIRST
LIMIT 999
Troubleshooting
If you expect Omni to use the aggregated table but it's not, consider the following:
- Missing fields: Ensure that all the fields being queried are present in the aggregated table and correctly mapped in the
materialized_queryparameter. - Incompatible queries: Certain queries, such as
count_distinctover a different level of aggregation than the aggregate table, may not be compatible with aggregate awareness. - Cache: If the query results are being retrieved from the cache, Omni may not need to rewrite the SQL.
- Try clearing the cache to test if aggregate awareness is working as expected.
- You can also test by setting the
cache_policyto0so that it never uses cache.