> ## Documentation Index
> Fetch the complete documentation index at: https://docs.omni.co/llms.txt
> Use this file to discover all available pages before exploring further.

# Combine GeoJSON files with AI to build custom region maps

> Merge separate GeoJSON boundary files with an AI coding tool to build region maps that span geographies Omni doesn't support out of the box.

export const SideBySide = ({src, alt, media, title, children, reverse = false, height = 220, divider = false}) => {
  const classNames = ["side-by-side"];
  if (reverse) classNames.push("side-by-side-reverse");
  if (divider) classNames.push("side-by-side-divider");
  return <div className={classNames.join(" ")} style={{
    "--side-by-side-height": `${height}px`
  }}>
      <div className="side-by-side-media">
        {media || <img src={src} alt={alt} />}
      </div>
      <div className="side-by-side-body">
        {title && <p className="side-by-side-title">{title}</p>}
        {children}
      </div>
    </div>;
};

export const categoryIcons = {
  'administration': 'lock',
  'api': 'terminal',
  'connections': 'database',
  'dashboards': 'table-columns',
  'embed': 'code',
  'errors': 'exclamation',
  'migration': 'angles-right',
  'modeling': 'wrench',
  'patterns': 'plus',
  'schedules & alerts': 'envelope',
  'visualizations': 'chart-column',
  'workbooks': 'book'
};

export const GuideSidebar = ({category, relatedLinks, updatedDate}) => {
  const [progress, setProgress] = React.useState(0);
  React.useEffect(() => {
    const sidebar = document.querySelector('.guide-sidebar');
    if (!sidebar) return;
    let container = sidebar.parentElement;
    while (container && !container.querySelector('.guide-header')) {
      container = container.parentElement;
    }
    if (container && !container.classList.contains('guide-page-layout')) {
      container.classList.add('guide-page-layout');
    }
  }, []);
  React.useEffect(() => {
    const handleScroll = () => {
      const scrollTop = window.scrollY;
      const docHeight = document.documentElement.scrollHeight - window.innerHeight;
      const scrollPercent = docHeight > 0 ? scrollTop / docHeight * 100 : 0;
      setProgress(Math.min(100, Math.max(0, scrollPercent)));
    };
    window.addEventListener('scroll', handleScroll, {
      passive: true
    });
    handleScroll();
    return () => window.removeEventListener('scroll', handleScroll);
  }, []);
  const icon = category ? categoryIcons[category.toLowerCase()] || 'book' : 'book';
  return <aside className="guide-sidebar">
      <div className="guide-sidebar-content">
        <a href="/guides" className="guide-sidebar-back">
          <Icon icon="arrow-left" iconType="solid" size={14} />
          <span>All guides</span>
        </a>

        <div className="guide-sidebar-section">
          <div className="guide-sidebar-label">Progress</div>
          <div className="guide-sidebar-progress">
            <div className="guide-mascot">
              <svg viewBox="0 0 688 690" width="48" height="48">
                <defs>
                  <clipPath id="progressClip">
                    <rect x="0" y={0} width="688" height={progress * 6.9} />
                  </clipPath>
                </defs>

                {}
                <path d="M343.67 1.5C542.684 1.5 685.84 149.351 685.84 344.84C685.84 540.328 542.685 688.18 343.67 688.18C144.655 688.18 1.5 540.318 1.5 344.84C1.50007 149.361 144.655 1.50005 343.67 1.5Z" fill="#FCFCF7" stroke="#FF5FA2" strokeWidth="3" />

                {}
                <path d="M343.67 0C143.81 0 0 148.55 0 344.84C0 541.13 143.81 689.68 343.67 689.68C543.53 689.68 687.34 541.14 687.34 344.84C687.34 148.54 543.53 0 343.67 0Z" fill="#FF5FA2" clipPath="url(#progressClip)" />

                {}
                <path d="M337.89 319.29C337.89 336.75 322.49 350.14 302.81 349.83C286.18 349.57 273.89 337.29 274.37 321.45C274.88 304.82 290.91 290.88 309.98 290.44C325.69 290.09 337.88 302.69 337.88 319.29H337.89Z" fill="#4D122C" />
                <path d="M566.17 319.29C566.17 336.75 550.77 350.14 531.09 349.83C514.46 349.57 502.17 337.29 502.65 321.45C503.16 304.82 519.19 290.88 538.26 290.44C553.97 290.09 566.16 302.69 566.16 319.29H566.17Z" fill="#4D122C" />
                <path d="M367.74 342.07C360.22 346.32 359.4 354.9 370.62 366.4C381.85 377.9 399.76 389.56 420.81 389.18C441.88 389.1 460.67 377.72 472.47 363.53C473.83 361.93 478.84 356.88 478.51 351.07C478.32 348.35 476.17 341.19 467.83 341.38C463.46 341.44 461.21 343.68 456.69 347.36C445.2 356.14 432.7 361.21 420.56 361.27C408.43 361.43 395.68 356.17 385.39 347.22C380.32 342.81 375.25 337.82 367.74 342.07Z" fill="#4D122C" />
              </svg>
            </div>
            <span className="guide-sidebar-progress-text">{Math.round(progress)}%</span>
          </div>
        </div>

        {category && <div className="guide-sidebar-section">
            <div className="guide-sidebar-label">Category</div>
            <div className="guide-sidebar-category">
              <Icon icon={icon} iconType="solid" size={14} />
              <span>{category}</span>
            </div>
          </div>}

        {updatedDate && <div className="guide-sidebar-section">
            <div className="guide-sidebar-label">Last updated</div>
            <div className="guide-sidebar-date">{updatedDate}</div>
          </div>}

        {relatedLinks && relatedLinks.length > 0 && <div className="guide-sidebar-section">
            <div className="guide-sidebar-label">Related</div>
            <ul className="guide-sidebar-links">
              {relatedLinks.map((link, index) => <li key={index}>
                  <a href={link.href}>{link.title}</a>
                </li>)}
            </ul>
          </div>}
      </div>
    </aside>;
};

export const GuideTitle = ({title}) => {
  return <div className="guide-header">
      <h1 className="guide-title">{title}</h1>
    </div>;
};

<GuideSidebar
  categoryIcons={categoryIcons}
  category="visualizations"
  updatedDate="September 2026"
  relatedLinks={[
{ title: "Maps", href: "/visualize-present/visualizations/types/map" },
{ title: "Color by / Stacking", href: "/visualize-present/visualizations/configuration/color" },
{ title: "Generating visualizations with AI", href: "/ai/visualizations" },
{ title: "Custom visualizations", href: "/visualize-present/visualizations/types/custom" }
]}
/>

<GuideTitle title="Combine GeoJSON files with AI to build custom region maps" />

Omni's [region maps](/visualize-present/visualizations/types/map) ship with built-in boundaries for countries and US states. However, the possibilities for regions you may want to visualize are multitudinous - zip codes in South America, voting districts in Australia and New Zealand, or a map showing both Canadian provinces and US states, which this guide will use as an example.

When you want to display [a custom set of regions](/visualize-present/visualizations/types/map#custom-regions), you can source them from your own GeoJSON. If you can find pre-existing GeoJSON files for the geographies you need, an AI coding tool can do the tedious part: merging separate boundary files into one, with a shared property to join against your specific dataset.

## When to use this pattern

Use this pattern when the regions in your dataset don't fit any single built-in map type. Examples:

* A dataset with both US and Canadian locations, where you want one map instead of two.
* A custom sales territory map built from several source boundary files, such as states grouped into regions.
* Any geography a third-party GeoJSON source defines that Omni doesn't offer natively.

## Requirements

To follow the steps in this guide, you'll need:

* **Restricted Querier or higher permissions**, to configure a region map's visualization settings.
* **An AI coding tool**, such as Claude Code, to merge the GeoJSON files.
* **A place to host the combined file** with CORS-enabled raw access, such as a public GitHub repository.
* **A dataset field with matching values**, like a 2-letter region code, to join your data against the merged boundaries.

## Steps

<Steps>
  <Step titleSize="h2" title="Gather boundary files">
    Find a GeoJSON source for each geography you want to combine. For example, a Canadian provinces GeoJSON file and a US states GeoJSON file. Download both into the same local directory.
  </Step>

  <Step titleSize="h2" title="Merge the files with AI">
    Prompt your AI coding tool to combine the files into a single `FeatureCollection` and add a shared property you can join against your dataset. For example:

    ```text title="Prompt used to merge CA provinces and US states" theme={null}
    Combine the two geojson files in this directory into one that has definitions of both Canadian provinces and US states. Include a short_name property that has the 2-letter abbreviation for each state & province.
    ```

    The property name has to match a field in your dataset. In this example, `short_name` pairs with a column of 2-letter state and province codes. Ask the AI tool to verify the merged file is valid GeoJSON before moving on.
  </Step>

  <Step titleSize="h2" title="Host the combined file" id="host-file">
    Omni loads custom region data from a URL, so the merged file needs to be hosted somewhere with CORS-enabled raw access, such as a public GitHub repository.

    Commit the file and use its raw file URL. For example:

    ```text theme={null}
    https://raw.githubusercontent.com/<org>/<repo>/main/<file>.geojson
    ```
  </Step>

  <Step titleSize="h2" title="Configure the custom region map in Omni">
    <SideBySide src="/guides/visualizations/images/geojson-chart-settings.png" alt="Chart options for a custom region map" height="400" reverse>
      In your Omni workbook, select the **map visualization type**. Then configuring the map's settings as follows:

      * **Map** - Set to **Region map**
      * **Region** - Set to **Custom**
      * **Source type** - Set to **GeoJSON**
      * **Source URL** - Paste the raw file URL from the [previous step](#host-file)
      * **Region property** - Set to the property name you added (for example, `short_name`)

      Once configured, the map colors each region by your measure, just like a built-in region map.
    </SideBySide>
  </Step>
</Steps>

## Completed example

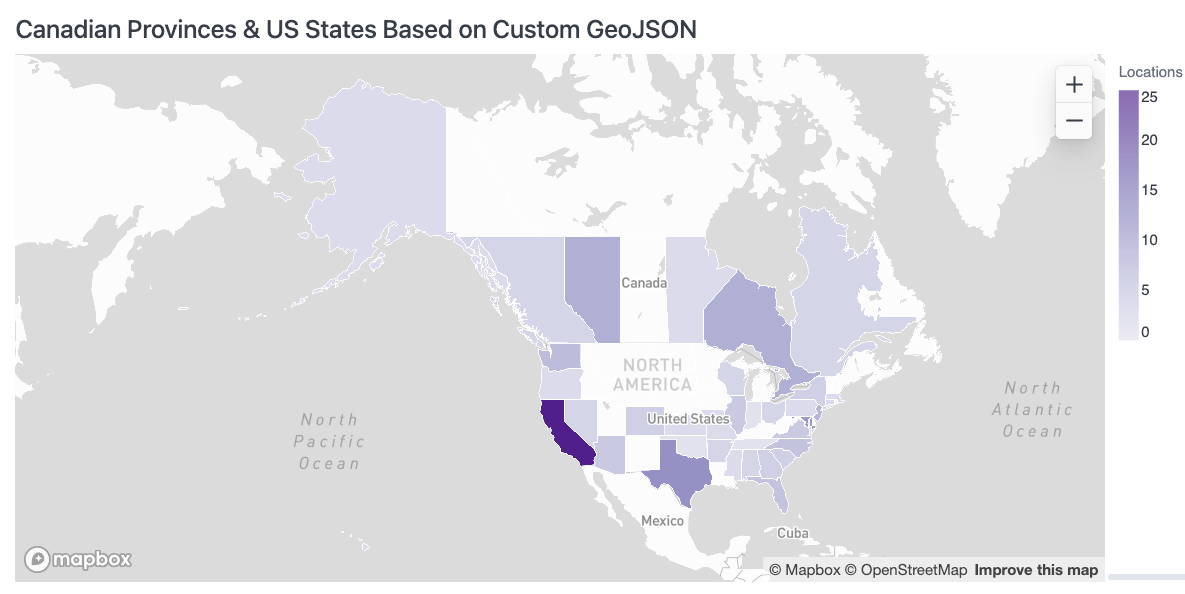
[exploreomni/geo-data](https://github.com/exploreomni/geo-data) is a public example of this pattern: a GeoJSON file combining Canadian provinces and US states, each with a `short_name` property holding its 2-letter code.

<Frame caption="A region map built from the combined GeoJSON, colored by location count across US states and Canadian provinces.">
  <img src="https://mintcdn.com/omni-e7402367/3nWVP2kqXd7nh8zK/guides/visualizations/images/combine-geojson-region-map-example.png?fit=max&auto=format&n=3nWVP2kqXd7nh8zK&q=85&s=66861336102170e1fb87a2dc56594b27" alt="Region map of Canadian provinces and US states shaded by location count, using a custom combined GeoJSON source" width="1185" height="594" data-path="guides/visualizations/images/combine-geojson-region-map-example.png" />
</Frame>

## Next steps

* [Maps](/visualize-present/visualizations/types/map) - supported map types and region options.
* [Color by / Stacking](/visualize-present/visualizations/configuration/color) - Pin gradient color scale values for consistent intensity coloring.
* [Custom visualizations](/visualize-present/visualizations/types/custom) - Go further with Vega-Lite for map layouts a region map can't support.
* [Apps](/visualize-present/apps) - Go even further with custom data experiences backed by live, governed data.