
> ## Documentation Index
> Fetch the complete documentation index at: https://docs.omni.co/llms.txt
> Use this file to discover all available pages before exploring further.

# Using AI to build a cohort analysis with month offset

> Use the Omni Agent to create a cohort analysis that tracks user behavior over time using monthly offsets.

export const categoryIcons = {
  'administration': 'lock',
  'api': 'terminal',
  'connections': 'database',
  'dashboards': 'table-columns',
  'embed': 'code',
  'errors': 'exclamation',
  'modeling': 'wrench',
  'patterns': 'plus',
  'schedules & alerts': 'envelope',
  'visualizations': 'chart-column',
  'workbooks': 'book'
};

export const GuideSidebar = ({category, relatedLinks, updatedDate}) => {
  const [progress, setProgress] = React.useState(0);
  React.useEffect(() => {
    const sidebar = document.querySelector('.guide-sidebar');
    if (!sidebar) return;
    let container = sidebar.parentElement;
    while (container && !container.querySelector('.guide-header')) {
      container = container.parentElement;
    }
    if (container && !container.classList.contains('guide-page-layout')) {
      container.classList.add('guide-page-layout');
    }
  }, []);
  React.useEffect(() => {
    const handleScroll = () => {
      const scrollTop = window.scrollY;
      const docHeight = document.documentElement.scrollHeight - window.innerHeight;
      const scrollPercent = docHeight > 0 ? scrollTop / docHeight * 100 : 0;
      setProgress(Math.min(100, Math.max(0, scrollPercent)));
    };
    window.addEventListener('scroll', handleScroll, {
      passive: true
    });
    handleScroll();
    return () => window.removeEventListener('scroll', handleScroll);
  }, []);
  const icon = category ? categoryIcons[category.toLowerCase()] || 'book' : 'book';
  return <aside className="guide-sidebar">
      <div className="guide-sidebar-content">
        <a href="/guides" className="guide-sidebar-back">
          <Icon icon="arrow-left" iconType="solid" size={14} />
          <span>All guides</span>
        </a>

        <div className="guide-sidebar-section">
          <div className="guide-sidebar-label">Progress</div>
          <div className="guide-sidebar-progress">
            <div className="guide-mascot">
              <svg viewBox="0 0 450 450" width="48" height="48">
                <defs>
                  <clipPath id="progressClip">
                    <rect x="0" y={450 - progress * 4.5} width="450" height={progress * 4.5} />
                  </clipPath>
                  <linearGradient id="blobbyGradient" x1="55.9753" y1="0" x2="492.197" y2="169.724" gradientUnits="userSpaceOnUse">
                    <stop stopColor="#BCA2F3" />
                    <stop offset="0.572917" stopColor="#FF7AA2" />
                    <stop offset="1" stopColor="#F3D4A2" />
                  </linearGradient>
                </defs>

                {}
                <circle cx="223.901" cy="223.901" r="213.901" transform="matrix(-0.999988 -0.0049013 0.00491945 -0.999988 447.797 449.992)" fill="#FAFAFA" stroke="#480B38" strokeWidth="20" />

                {}
                <circle cx="223.901" cy="223.901" r="213.901" transform="matrix(-0.999988 -0.0049013 0.00491945 -0.999988 447.797 449.992)" fill="url(#blobbyGradient)" stroke="#480B38" strokeWidth="20" clipPath="url(#progressClip)" />

                {}
                <path d="M310.41 195.084C310.41 200.052 301.362 212.472 284.328 212.472C266.585 212.472 258.246 201.294 258.246 195.912" stroke="#480B38" strokeWidth="17.3883" strokeMiterlimit="1.33344" strokeLinecap="round" />
                <circle cx="21.168" cy="21.168" r="21.168" transform="matrix(-1 0 0 1 388.658 169.001)" fill="#480B38" />
                <circle cx="21.168" cy="21.168" r="21.168" transform="matrix(-1 0 0 1 223.467 169.001)" fill="#480B38" />
              </svg>
            </div>
            <span className="guide-sidebar-progress-text">{Math.round(progress)}%</span>
          </div>
        </div>

        {category && <div className="guide-sidebar-section">
            <div className="guide-sidebar-label">Category</div>
            <div className="guide-sidebar-category">
              <Icon icon={icon} iconType="solid" size={14} />
              <span>{category}</span>
            </div>
          </div>}

        {updatedDate && <div className="guide-sidebar-section">
            <div className="guide-sidebar-label">Last updated</div>
            <div className="guide-sidebar-date">{updatedDate}</div>
          </div>}

        {relatedLinks && relatedLinks.length > 0 && <div className="guide-sidebar-section">
            <div className="guide-sidebar-label">Related</div>
            <ul className="guide-sidebar-links">
              {relatedLinks.map((link, index) => <li key={index}>
                  <a href={link.href}>{link.title}</a>
                </li>)}
            </ul>
          </div>}
      </div>
    </aside>;
};

export const GuideTitle = ({title}) => {
  return <div className="guide-header">
      <h1 className="guide-title">{title}</h1>
    </div>;
};

<GuideSidebar
  categoryIcons={categoryIcons}
  category="patterns"
  updatedDate="March 2026"
  relatedLinks={[
{ title: "Cohort analysis using a thin spine", href: "/guides/patterns/spine-cohort-analysis" },
{ title: "AI formulas", href: "/analyze-explore/calculations#ai-generated" },
{ title: "Table visualizations", href: "/visualize-present/visualizations/types/table" }
]}
/>

<GuideTitle title="Using AI to build a cohort analysis with month offset" />

## Requirements

To follow the steps in this guide, you'll need:

* **Permissions in Omni** that allow you to use the [Omni Agent](/ai/queries).
* **A dataset that includes at least two date fields** — a fixed user attribute date (e.g., account creation date) and an activity or event date. These should be accessible from a single Omni topic.

<Steps>
  <Step titleSize="h3" title="Define cohort and activity dates">
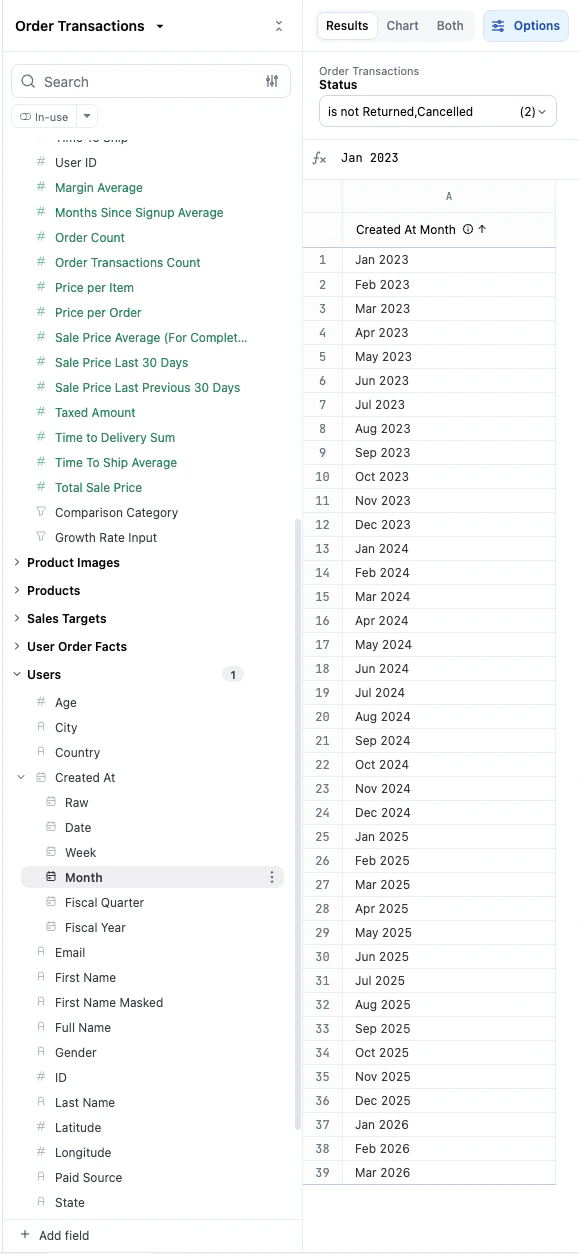
    To start, you need to establish the fixed date for your users and the activity date you are measuring.

    1. Select the user creation date (for example, `Created At`). This serves as your fixed dimension for the X-axis.
    2. Select the date field representing user activity or transactions:

           <img src="https://mintcdn.com/omni-e7402367/2tmOZiXnRfN_b8s6/guides/patterns/images/month-offset-cohort-date.png?fit=max&auto=format&n=2tmOZiXnRfN_b8s6&q=85&s=eb694d01bcf51e44666846b598049d55" alt="Cohort Date" width="579" height="1254" data-path="guides/patterns/images/month-offset-cohort-date.png" />
  </Step>

  <Step title="Calculate the month offset with AI">
    Instead of writing complex SQL, use the Omni Agent to calculate the time difference between your two dates.

    1. Click **AI calcs** (<Icon icon="sparkles" iconType="solid" /> icon) in the workbook toolbar.
    2. In the Omni Agent prompt, enter: `"Calculate the difference in months between column a and b."`

           <img src="https://mintcdn.com/omni-e7402367/2tmOZiXnRfN_b8s6/guides/patterns/images/month-offset-cohort-ai-field.png?fit=max&auto=format&n=2tmOZiXnRfN_b8s6&q=85&s=d01591fc567b1aba7ef1c1e2a495a41f" alt="Create AI Field" width="1728" height="236" data-path="guides/patterns/images/month-offset-cohort-ai-field.png" />
    3. After the calculation generates, hover over the column and click the <Icon icon="ellipsis-vertical" iconType="solid" /> icon.
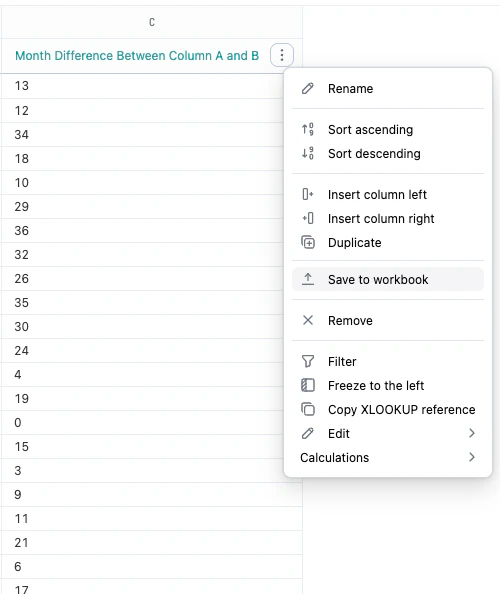
    4. Click **Save to workbook** to make the field available for your analysis.

           <img src="https://mintcdn.com/omni-e7402367/2tmOZiXnRfN_b8s6/guides/patterns/images/month-offset-cohort-ai-promote-workbook.png?fit=max&auto=format&n=2tmOZiXnRfN_b8s6&q=85&s=e42cc030a6e73632bfa203ab2e8c95d3" alt="Promote to Workbook" width="500" height="594" data-path="guides/patterns/images/month-offset-cohort-ai-promote-workbook.png" />
    5. Rename the new field to something clear, such as `Months since Created`, by clicking the <Icon icon="ellipsis-vertical" iconType="solid" /> icon next to the field name in the field picker and opening the Edit Field view.
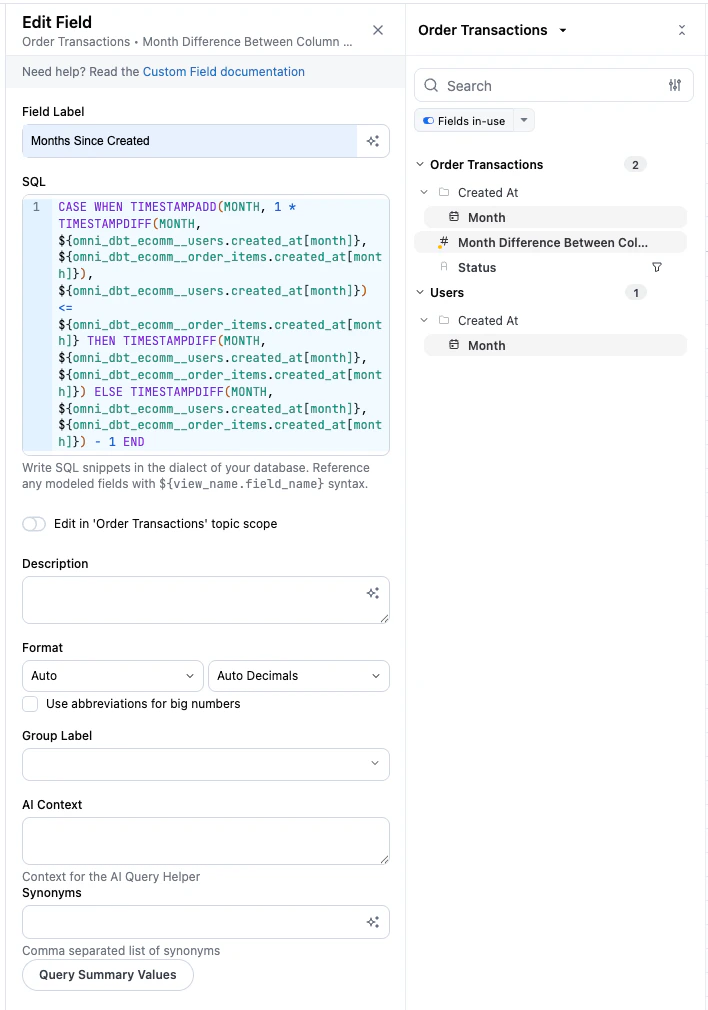
    <Tip>
      This can also be done via double clicking on the header of the new column.
    </Tip>

    <img src="https://mintcdn.com/omni-e7402367/2tmOZiXnRfN_b8s6/guides/patterns/images/month-offset-cohort-rename-field.png?fit=max&auto=format&n=2tmOZiXnRfN_b8s6&q=85&s=9f3e5c95d83c952fc61f4c36a279f7e6" alt="Rename Field" width="708" height="1010" data-path="guides/patterns/images/month-offset-cohort-rename-field.png" />
  </Step>

  <Step title="Structure the cohort view">
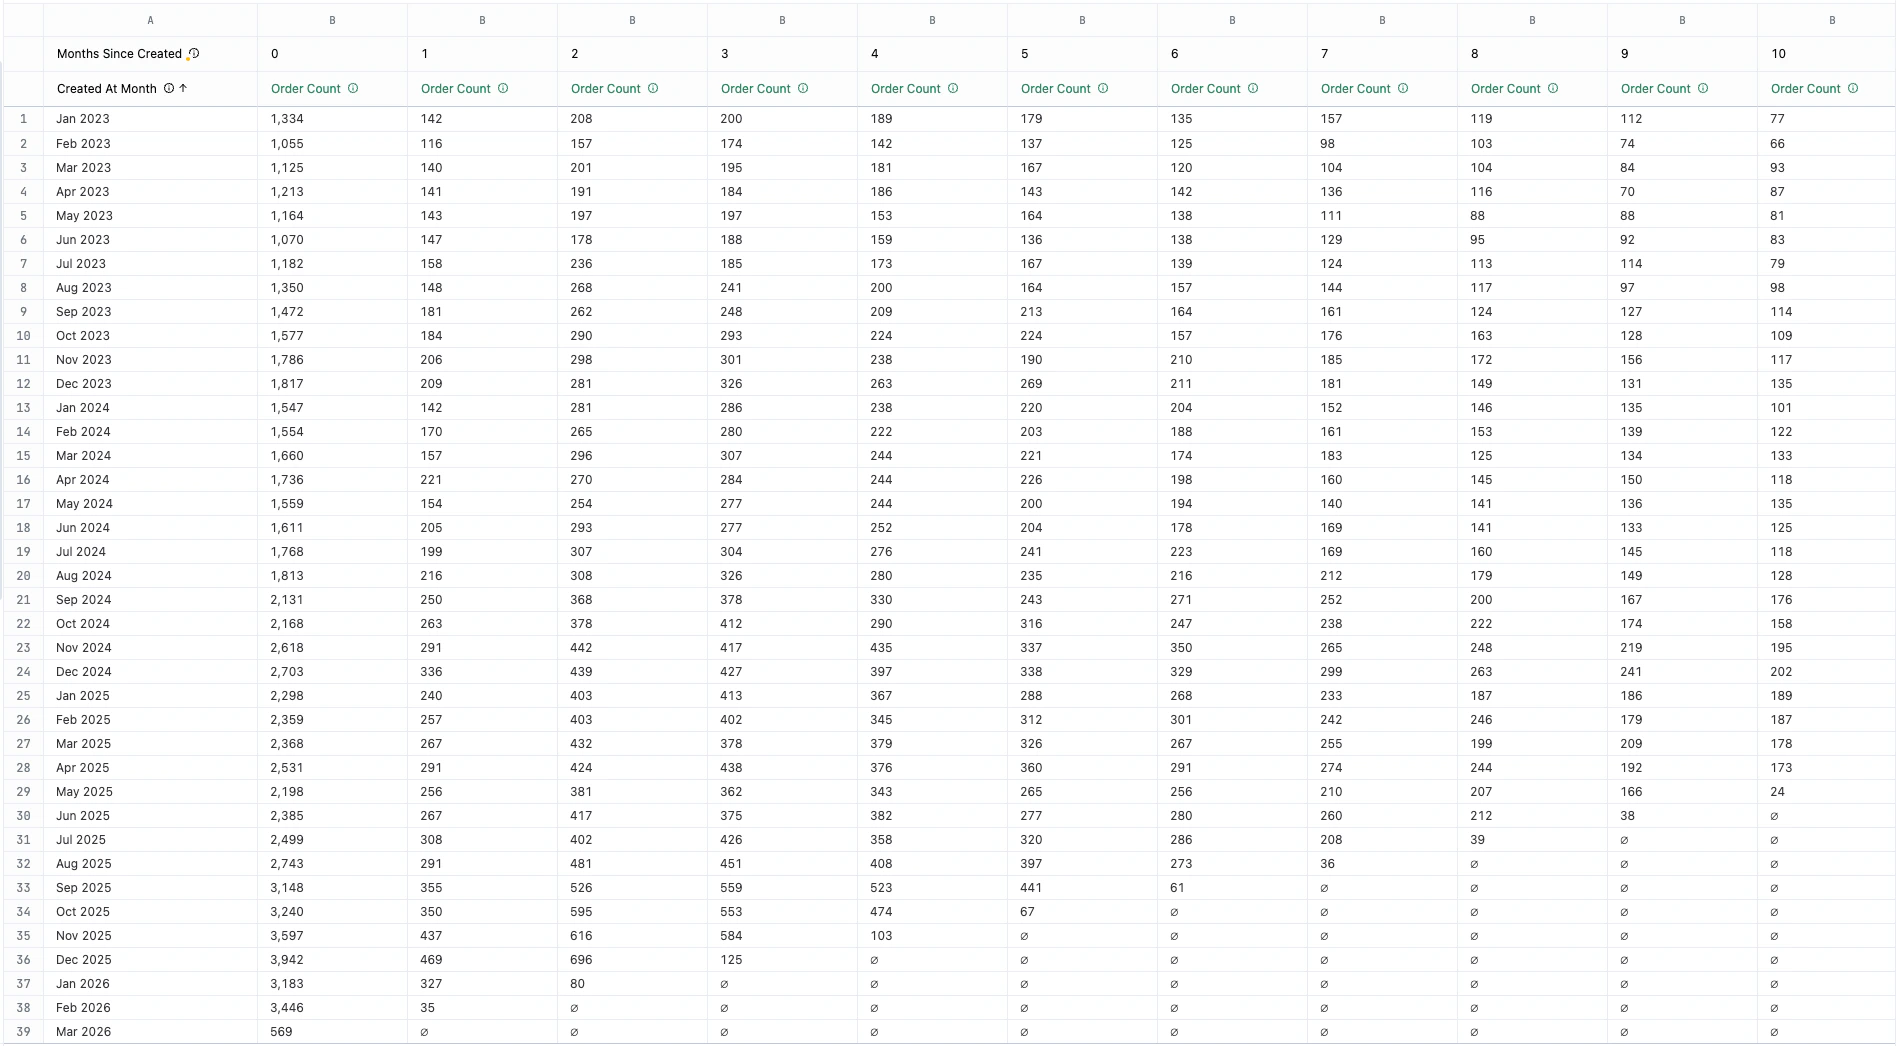
    Once your offset is calculated, you can arrange your data to see the "cohort triangle" pattern.

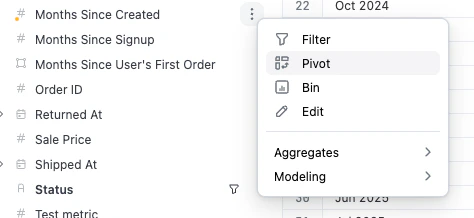
    1. Create a pivot on the new `Months since Created` field.

           <img src="https://mintcdn.com/omni-e7402367/2tmOZiXnRfN_b8s6/guides/patterns/images/month-offset-cohort-pivot.png?fit=max&auto=format&n=2tmOZiXnRfN_b8s6&q=85&s=d10c2d496569d7b9843ba0ecedf533f3" alt="Pivot" width="474" height="218" data-path="guides/patterns/images/month-offset-cohort-pivot.png" />
    2. Select a measure to track, such as a **Count** of users or **Count Distinct** of specific behaviors.
    3. The results will automatically format into a cohort-style visualization:
           <img src="https://mintcdn.com/omni-e7402367/2tmOZiXnRfN_b8s6/guides/patterns/images/month-offset-cohort-results.png?fit=max&auto=format&n=2tmOZiXnRfN_b8s6&q=85&s=e918b3be061223ea0c05b2da92f4e08f" alt="Results" width="1896" height="1046" data-path="guides/patterns/images/month-offset-cohort-results.png" />
  </Step>

  <Step title="Add conditional formatting">
    Enhance your table to visually highlight performance trends across different cohorts.

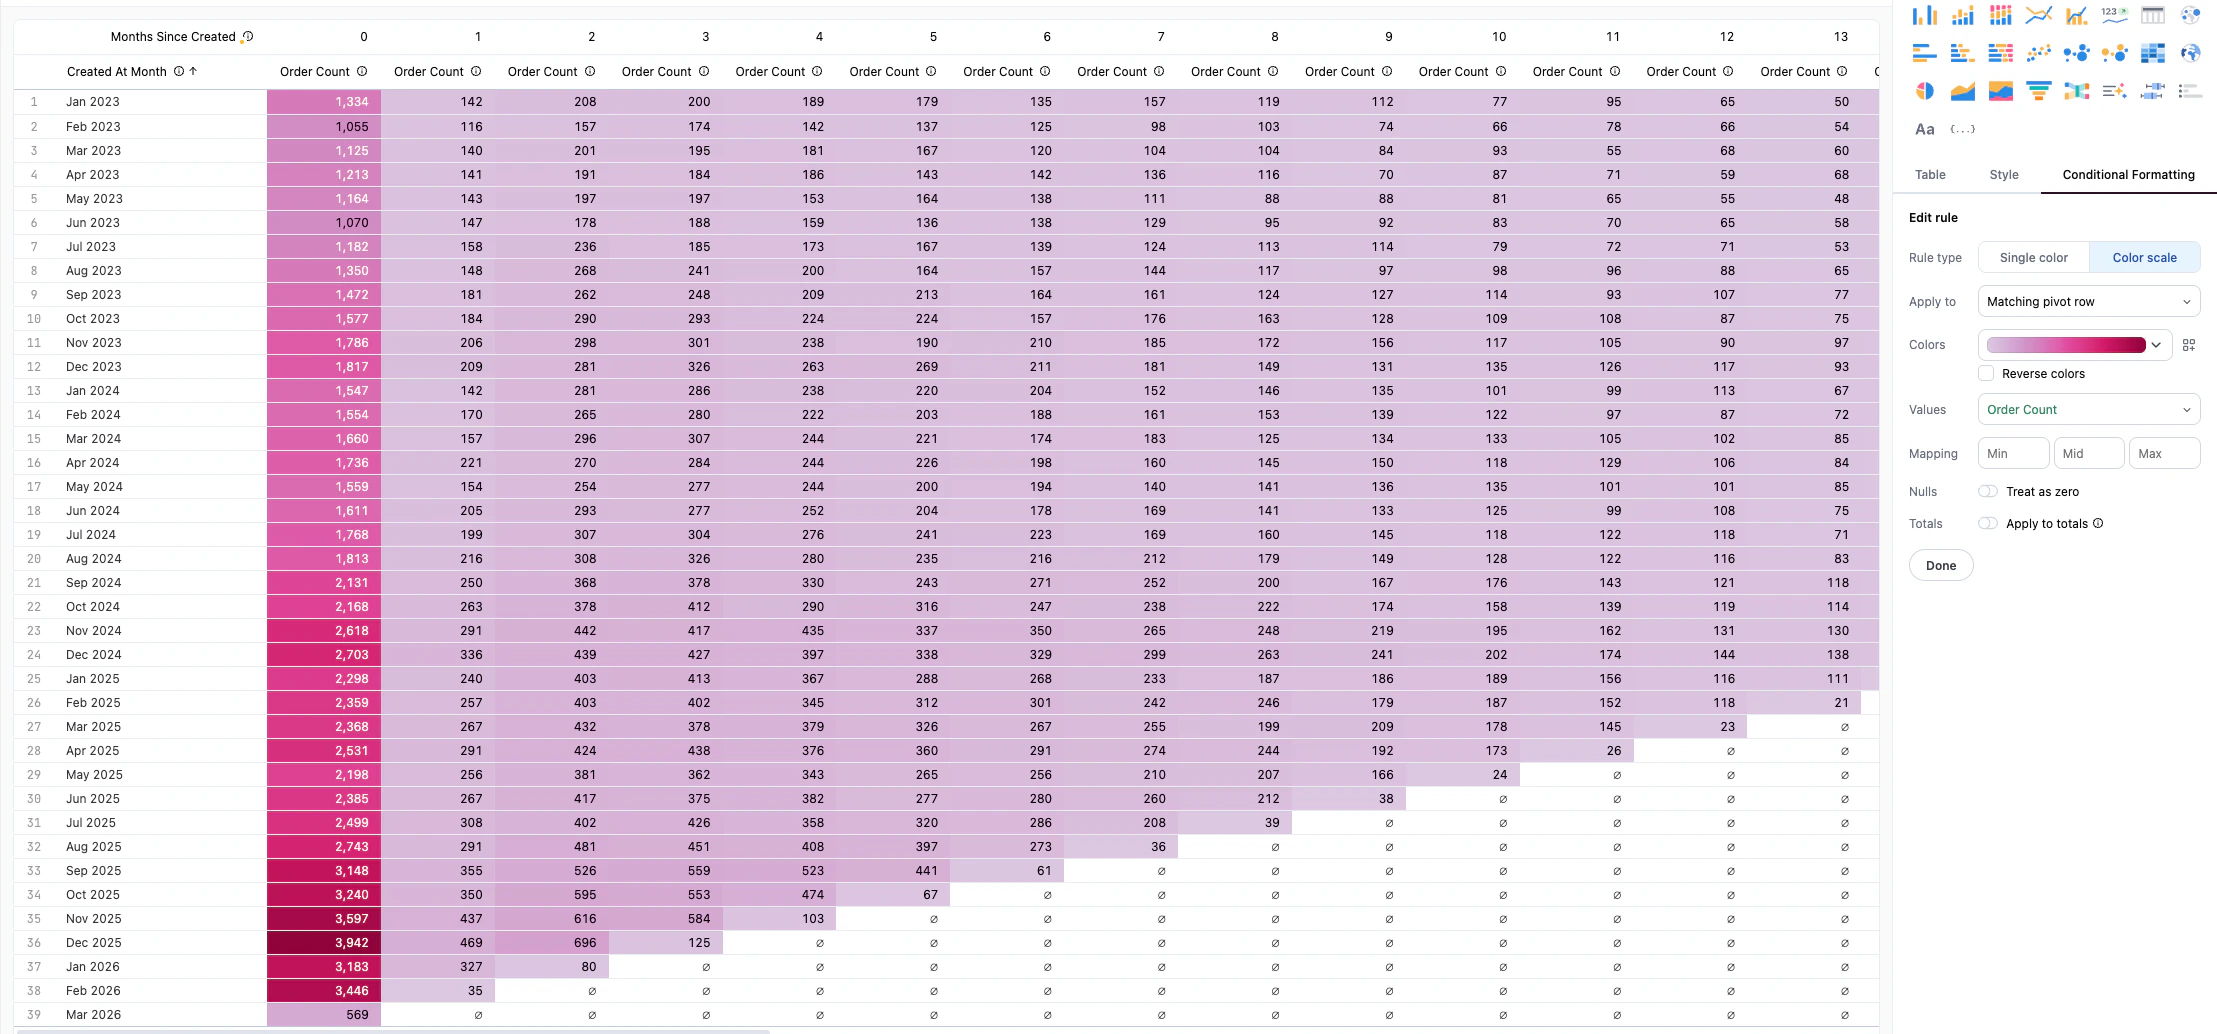
    1. Navigate to the **Visualizations** tab and click the **Table** visualization.
    2. Click the **Conditional Formatting** tab in the **Chart Options** panel.
    3. Choose **Color Scale**.
    4. Select your primary measure to apply the color scale:

           <img src="https://mintcdn.com/omni-e7402367/2tmOZiXnRfN_b8s6/guides/patterns/images/month-offset-cohort-visualization.png?fit=max&auto=format&n=2tmOZiXnRfN_b8s6&q=85&s=74f5c3ce2f0c5bb0d33e3ecbd1aaf359" alt="Visualization" width="2217" height="1034" data-path="guides/patterns/images/month-offset-cohort-visualization.png" />

    <Tip>
      Use a sequential color scale (e.g., light to dark blue) to make it easier to see where retention or activity drops off in later months.
    </Tip>
  </Step>
</Steps>

## Video walkthrough

<iframe className="w-full aspect-video rounded-xl" src="https://www.loom.com/embed/d2ce571d750d4f5cafc4fa58550ea19c" title="Building a Cohort Analysis with Month Offset using AI" frameBorder="0" allow="accelerometer; autoplay; clipboard-write; encrypted-media; gyroscope; picture-in-picture" allowFullScreen />

## Next steps

Now that you've built your AI-driven cohort, you can:

* Explore more advanced [AI formulas](/analyze-explore/calculations#ai-generated) to calculate retention percentages.
* Learn more about [Table visualization options](/visualize-present/visualizations/types/table#conditional-formatting-options) to further customize your reports.