> ## Documentation Index
> Fetch the complete documentation index at: https://docs.omni.co/llms.txt
> Use this file to discover all available pages before exploring further.

# Using Level of Detail functions for cohorting analysis

> Utilize Level of Detail fields to create a cohort analysis for determining how different cohorts of user perform over time.

export const categoryIcons = {
  'administration': 'lock',
  'api': 'terminal',
  'connections': 'database',
  'dashboards': 'table-columns',
  'embed': 'code',
  'errors': 'exclamation',
  'modeling': 'wrench',
  'patterns': 'plus',
  'schedules & alerts': 'envelope',
  'visualizations': 'chart-column',
  'workbooks': 'book'
};

export const GuideSidebar = ({category, relatedLinks, updatedDate}) => {
  const [progress, setProgress] = React.useState(0);
  React.useEffect(() => {
    const sidebar = document.querySelector('.guide-sidebar');
    if (!sidebar) return;
    let container = sidebar.parentElement;
    while (container && !container.querySelector('.guide-header')) {
      container = container.parentElement;
    }
    if (container && !container.classList.contains('guide-page-layout')) {
      container.classList.add('guide-page-layout');
    }
  }, []);
  React.useEffect(() => {
    const handleScroll = () => {
      const scrollTop = window.scrollY;
      const docHeight = document.documentElement.scrollHeight - window.innerHeight;
      const scrollPercent = docHeight > 0 ? scrollTop / docHeight * 100 : 0;
      setProgress(Math.min(100, Math.max(0, scrollPercent)));
    };
    window.addEventListener('scroll', handleScroll, {
      passive: true
    });
    handleScroll();
    return () => window.removeEventListener('scroll', handleScroll);
  }, []);
  const icon = category ? categoryIcons[category.toLowerCase()] || 'book' : 'book';
  return <aside className="guide-sidebar">
      <div className="guide-sidebar-content">
        <a href="/guides" className="guide-sidebar-back">
          <Icon icon="arrow-left" iconType="solid" size={14} />
          <span>All guides</span>
        </a>

        <div className="guide-sidebar-section">
          <div className="guide-sidebar-label">Progress</div>
          <div className="guide-sidebar-progress">
            <div className="guide-mascot">
              <svg viewBox="0 0 450 450" width="48" height="48">
                <defs>
                  <clipPath id="progressClip">
                    <rect x="0" y={450 - progress * 4.5} width="450" height={progress * 4.5} />
                  </clipPath>
                  <linearGradient id="blobbyGradient" x1="55.9753" y1="0" x2="492.197" y2="169.724" gradientUnits="userSpaceOnUse">
                    <stop stopColor="#BCA2F3" />
                    <stop offset="0.572917" stopColor="#FF7AA2" />
                    <stop offset="1" stopColor="#F3D4A2" />
                  </linearGradient>
                </defs>

                {}
                <circle cx="223.901" cy="223.901" r="213.901" transform="matrix(-0.999988 -0.0049013 0.00491945 -0.999988 447.797 449.992)" fill="#FAFAFA" stroke="#480B38" strokeWidth="20" />

                {}
                <circle cx="223.901" cy="223.901" r="213.901" transform="matrix(-0.999988 -0.0049013 0.00491945 -0.999988 447.797 449.992)" fill="url(#blobbyGradient)" stroke="#480B38" strokeWidth="20" clipPath="url(#progressClip)" />

                {}
                <path d="M310.41 195.084C310.41 200.052 301.362 212.472 284.328 212.472C266.585 212.472 258.246 201.294 258.246 195.912" stroke="#480B38" strokeWidth="17.3883" strokeMiterlimit="1.33344" strokeLinecap="round" />
                <circle cx="21.168" cy="21.168" r="21.168" transform="matrix(-1 0 0 1 388.658 169.001)" fill="#480B38" />
                <circle cx="21.168" cy="21.168" r="21.168" transform="matrix(-1 0 0 1 223.467 169.001)" fill="#480B38" />
              </svg>
            </div>
            <span className="guide-sidebar-progress-text">{Math.round(progress)}%</span>
          </div>
        </div>

        {category && <div className="guide-sidebar-section">
            <div className="guide-sidebar-label">Category</div>
            <div className="guide-sidebar-category">
              <Icon icon={icon} iconType="solid" size={14} />
              <span>{category}</span>
            </div>
          </div>}

        {updatedDate && <div className="guide-sidebar-section">
            <div className="guide-sidebar-label">Last updated</div>
            <div className="guide-sidebar-date">{updatedDate}</div>
          </div>}

        {relatedLinks && relatedLinks.length > 0 && <div className="guide-sidebar-section">
            <div className="guide-sidebar-label">Related</div>
            <ul className="guide-sidebar-links">
              {relatedLinks.map((link, index) => <li key={index}>
                  <a href={link.href}>{link.title}</a>
                </li>)}
            </ul>
          </div>}
      </div>
    </aside>;
};

export const GuideTitle = ({title}) => {
  return <div className="guide-header">
      <h1 className="guide-title">{title}</h1>
    </div>;
};

<GuideSidebar
  categoryIcons={categoryIcons}
  category="patterns"
  updatedDate="March 2026"
  relatedLinks={[
{ title: "Level of detail", href: "/modeling/dimensions/parameters/level-of-detail" },
{ title: "Cohort analysis using a thin spine", href: "/guides/patterns/spine-cohort-analysis" },
{ title: "Table visualizations", href: "/visualize-present/visualizations/types/table" }
]}
/>

<GuideTitle title="Using Level of Detail functions for cohorting analysis" />

You can use [Level of Detail](https://omni.co/demos/20250523#level-of-detail-fields) (LoD) calculations to perform cohort analysis without creating query views or complex joins. This guide shows you how to identify a user's first order date to track behavior and retention over time.

## Requirements

To follow the steps in this guide, you'll need:

* Access to a **dataset** with an `Order Date` and `User ID`.
* Restricted Querier or above connection permissions to build in the workbook.

<Steps>
  <Step titleSize="h2" title="Create the LoD field">
    First, define the aggregation that identifies the first order for each user.

    1. In the field browser in a workbook, find the `Order Date` field.
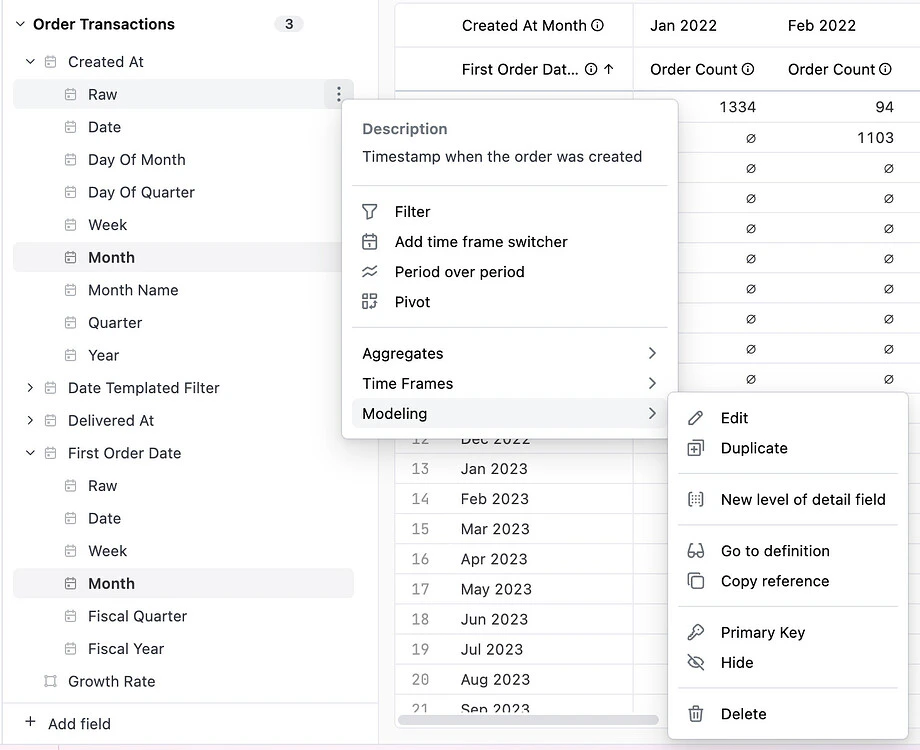
    2. Hover over the field and click the <Icon icon="ellipsis-vertical" iconType="solid" /> that displays, then **Modeling > New Level of Detail field**:

           <img src="https://mintcdn.com/omni-e7402367/ke3ztNQLVW7Q5Rk_/guides/patterns/images/build-cohort-level-of-detail-create-lod.jpeg?fit=max&auto=format&n=ke3ztNQLVW7Q5Rk_&q=85&s=789e11495830bd64db4d8f988b94a5ca" alt="New level of Detail Field" width="920" height="750" data-path="guides/patterns/images/build-cohort-level-of-detail-create-lod.jpeg" />
  </Step>

  <Step titleSize="h2" title="Configure the calculation">
    Set the scope of the calculation to ensure the date is fixed to the user regardless of other filters in your query.

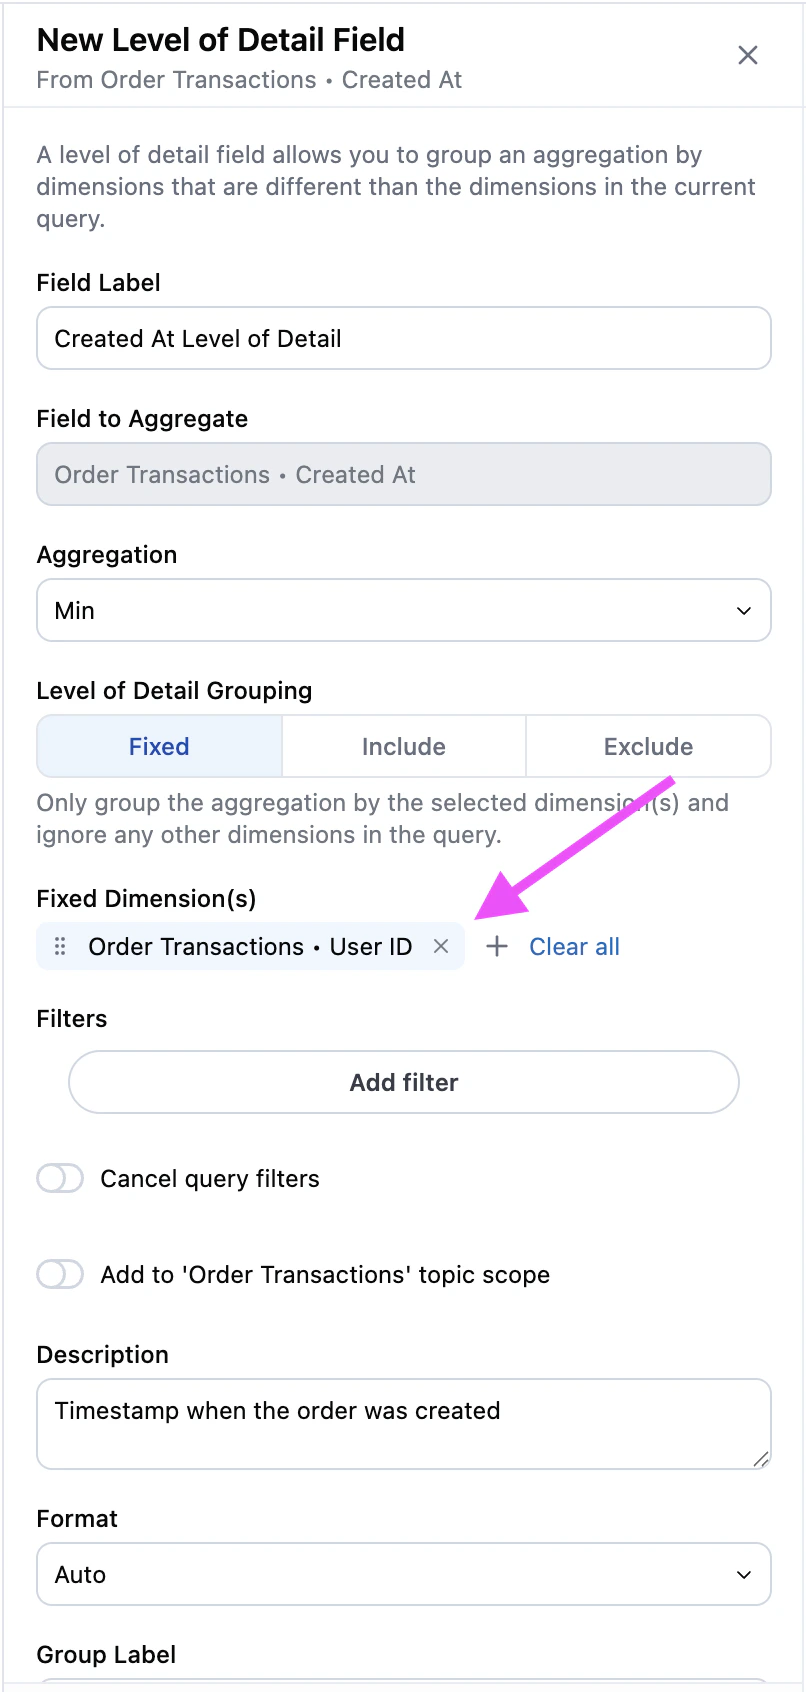
    1. In the editing pane, select **Fixed LoD Grouping**.
    2. Under **Fixed Dimension(s)**, select `User ID` to isolate each individual user's activity. This sets the aggregation to find the minimum (first) `Order Date` for each `User ID`.

           <img src="https://mintcdn.com/omni-e7402367/ke3ztNQLVW7Q5Rk_/guides/patterns/images/build-cohort-level-of-detail-new-field.png?fit=max&auto=format&n=ke3ztNQLVW7Q5Rk_&q=85&s=f8497e6035b1e5cd4a0320066e594a8d" style={{ width:"350px",height:"auto" }} alt="Level of Detail field configuration pane showing Fixed LoD Grouping, User ID grouping, and minimum Order Date aggregation" width="806" height="1692" data-path="guides/patterns/images/build-cohort-level-of-detail-new-field.png" />
  </Step>

  <Step titleSize="h2" title="Visualize the cohort">
    Once the field is defined, you can build your cohort grid to analyze user patterns.

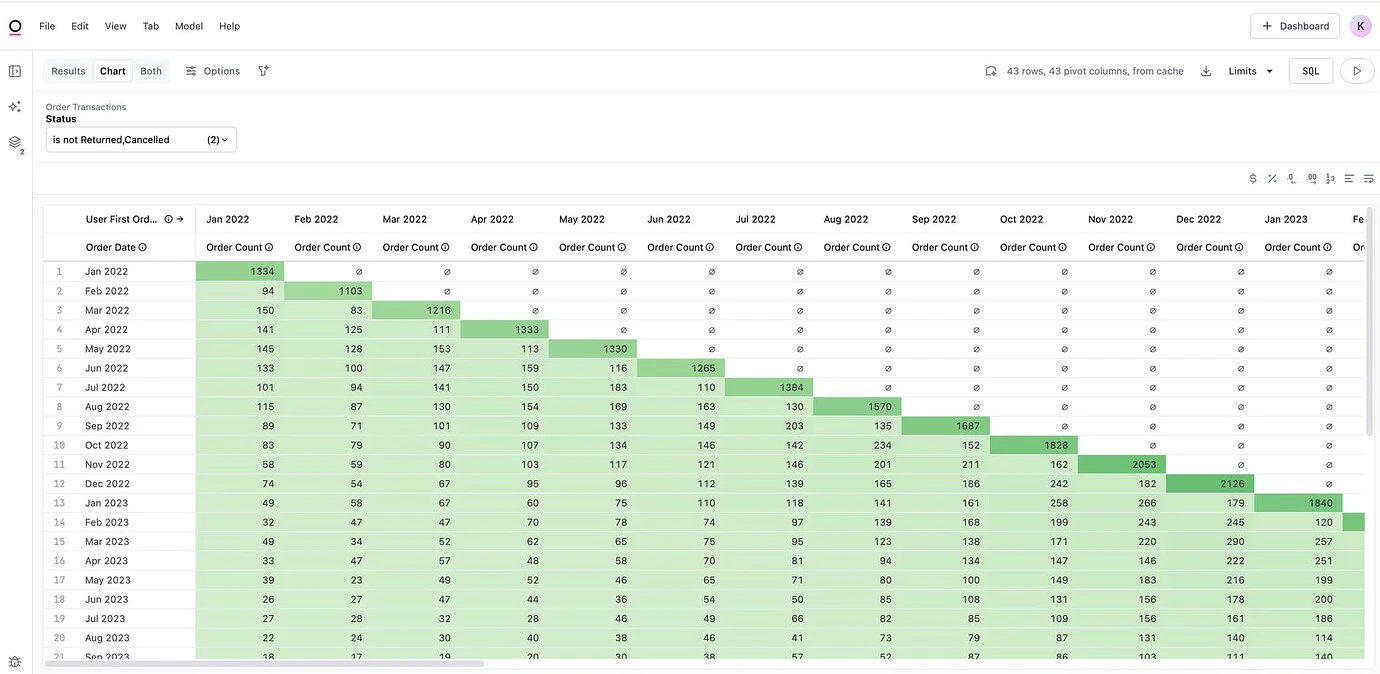
    1. Using the field browser, select the new LoD field to serve as your cohort date.
    2. Select the original `Order Date` and `Order Count`.
    3. [Pivot](/visualize-present/visualizations/types/table#working-with-pivots) the LoD field by clicking the <Icon icon="ellipsis-vertical" iconType="solid" /> icon next to the Level of Detail field header in the workbook, then select **Pivot**. This will allow you to see how these cohorts have purchased products over time.

           <img src="https://mintcdn.com/omni-e7402367/ke3ztNQLVW7Q5Rk_/guides/patterns/images/build-cohort-level-of-detail-visualization.jpeg?fit=max&auto=format&n=ke3ztNQLVW7Q5Rk_&q=85&s=18798e2dd5135140ebe84fc5c885bb42" alt="Level of Detail Cohort Visualization" width="1380" height="674" data-path="guides/patterns/images/build-cohort-level-of-detail-visualization.jpeg" />
  </Step>
</Steps>

## Video walkthrough

<iframe className="w-full aspect-video rounded-xl" src="https://www.loom.com/embed/921789360b7d47ebaef02824017faa13" title="Building Cohort Analysis with Level of Detail field" frameBorder="0" allow="accelerometer; autoplay; clipboard-write; encrypted-media; gyroscope; picture-in-picture" allowFullScreen />

## Next steps

Now that you have built your cohort using LoD, you can further refine your analysis:

* [Learn more about table visualizations](/visualize-present/visualizations/types/table) to further customize your view.
* [Explore advanced querying](/analyze-explore/querying) to add filters or custom calculations to your cohort.
* Review [Cohort analysis using a thin spine](/guides/patterns/spine-cohort-analysis) for an alternative approach.