> ## Documentation Index
> Fetch the complete documentation index at: https://docs.omni.co/llms.txt
> Use this file to discover all available pages before exploring further.

# Apply a filter to a single measure

> Add a filter to just one measure in a given query.

export const categoryIcons = {
  'administration': 'lock',
  'api': 'terminal',
  'connections': 'database',
  'dashboards': 'table-columns',
  'embed': 'code',
  'errors': 'exclamation',
  'modeling': 'wrench',
  'patterns': 'plus',
  'schedules & alerts': 'envelope',
  'visualizations': 'chart-column',
  'workbooks': 'book'
};

export const GuideSidebar = ({category, relatedLinks, updatedDate}) => {
  const [progress, setProgress] = React.useState(0);
  React.useEffect(() => {
    const sidebar = document.querySelector('.guide-sidebar');
    if (!sidebar) return;
    let container = sidebar.parentElement;
    while (container && !container.querySelector('.guide-header')) {
      container = container.parentElement;
    }
    if (container && !container.classList.contains('guide-page-layout')) {
      container.classList.add('guide-page-layout');
    }
  }, []);
  React.useEffect(() => {
    const handleScroll = () => {
      const scrollTop = window.scrollY;
      const docHeight = document.documentElement.scrollHeight - window.innerHeight;
      const scrollPercent = docHeight > 0 ? scrollTop / docHeight * 100 : 0;
      setProgress(Math.min(100, Math.max(0, scrollPercent)));
    };
    window.addEventListener('scroll', handleScroll, {
      passive: true
    });
    handleScroll();
    return () => window.removeEventListener('scroll', handleScroll);
  }, []);
  const icon = category ? categoryIcons[category.toLowerCase()] || 'book' : 'book';
  return <aside className="guide-sidebar">
      <div className="guide-sidebar-content">
        <a href="/guides" className="guide-sidebar-back">
          <Icon icon="arrow-left" iconType="solid" size={14} />
          <span>All guides</span>
        </a>

        <div className="guide-sidebar-section">
          <div className="guide-sidebar-label">Progress</div>
          <div className="guide-sidebar-progress">
            <div className="guide-mascot">
              <svg viewBox="0 0 450 450" width="48" height="48">
                <defs>
                  <clipPath id="progressClip">
                    <rect x="0" y={450 - progress * 4.5} width="450" height={progress * 4.5} />
                  </clipPath>
                  <linearGradient id="blobbyGradient" x1="55.9753" y1="0" x2="492.197" y2="169.724" gradientUnits="userSpaceOnUse">
                    <stop stopColor="#BCA2F3" />
                    <stop offset="0.572917" stopColor="#FF7AA2" />
                    <stop offset="1" stopColor="#F3D4A2" />
                  </linearGradient>
                </defs>

                {}
                <circle cx="223.901" cy="223.901" r="213.901" transform="matrix(-0.999988 -0.0049013 0.00491945 -0.999988 447.797 449.992)" fill="#FAFAFA" stroke="#480B38" strokeWidth="20" />

                {}
                <circle cx="223.901" cy="223.901" r="213.901" transform="matrix(-0.999988 -0.0049013 0.00491945 -0.999988 447.797 449.992)" fill="url(#blobbyGradient)" stroke="#480B38" strokeWidth="20" clipPath="url(#progressClip)" />

                {}
                <path d="M310.41 195.084C310.41 200.052 301.362 212.472 284.328 212.472C266.585 212.472 258.246 201.294 258.246 195.912" stroke="#480B38" strokeWidth="17.3883" strokeMiterlimit="1.33344" strokeLinecap="round" />
                <circle cx="21.168" cy="21.168" r="21.168" transform="matrix(-1 0 0 1 388.658 169.001)" fill="#480B38" />
                <circle cx="21.168" cy="21.168" r="21.168" transform="matrix(-1 0 0 1 223.467 169.001)" fill="#480B38" />
              </svg>
            </div>
            <span className="guide-sidebar-progress-text">{Math.round(progress)}%</span>
          </div>
        </div>

        {category && <div className="guide-sidebar-section">
            <div className="guide-sidebar-label">Category</div>
            <div className="guide-sidebar-category">
              <Icon icon={icon} iconType="solid" size={14} />
              <span>{category}</span>
            </div>
          </div>}

        {updatedDate && <div className="guide-sidebar-section">
            <div className="guide-sidebar-label">Last updated</div>
            <div className="guide-sidebar-date">{updatedDate}</div>
          </div>}

        {relatedLinks && relatedLinks.length > 0 && <div className="guide-sidebar-section">
            <div className="guide-sidebar-label">Related</div>
            <ul className="guide-sidebar-links">
              {relatedLinks.map((link, index) => <li key={index}>
                  <a href={link.href}>{link.title}</a>
                </li>)}
            </ul>
          </div>}
      </div>
    </aside>;
};

export const GuideTitle = ({title}) => {
  return <div className="guide-header">
      <h1 className="guide-title">{title}</h1>
    </div>;
};

<GuideSidebar
  categoryIcons={categoryIcons}
  category="modeling"
  updatedDate="December 2025"
  relatedLinks={[
{ title: "Measures", href: "/modeling/measures" },
{ title: "filters parameter", href: "/modeling/measures/parameters/filters" }
]}
/>

<GuideTitle title="Apply a filter to a single measure" />

Filtered measures allow you to apply a filter to a single measure in a given query. For example, filtered measures are equivalent to a SQL statement like:

```sql theme={null}
COUNT(DISTINCT
    CASE
      WHEN status = 'Complete' THEN order_id
      ELSE NULL
    END)
```

However, filtered measures have the added benefit of intelligent passing through the filter value when you drill.

## Option 1: Use the Create filtered measure workbook option

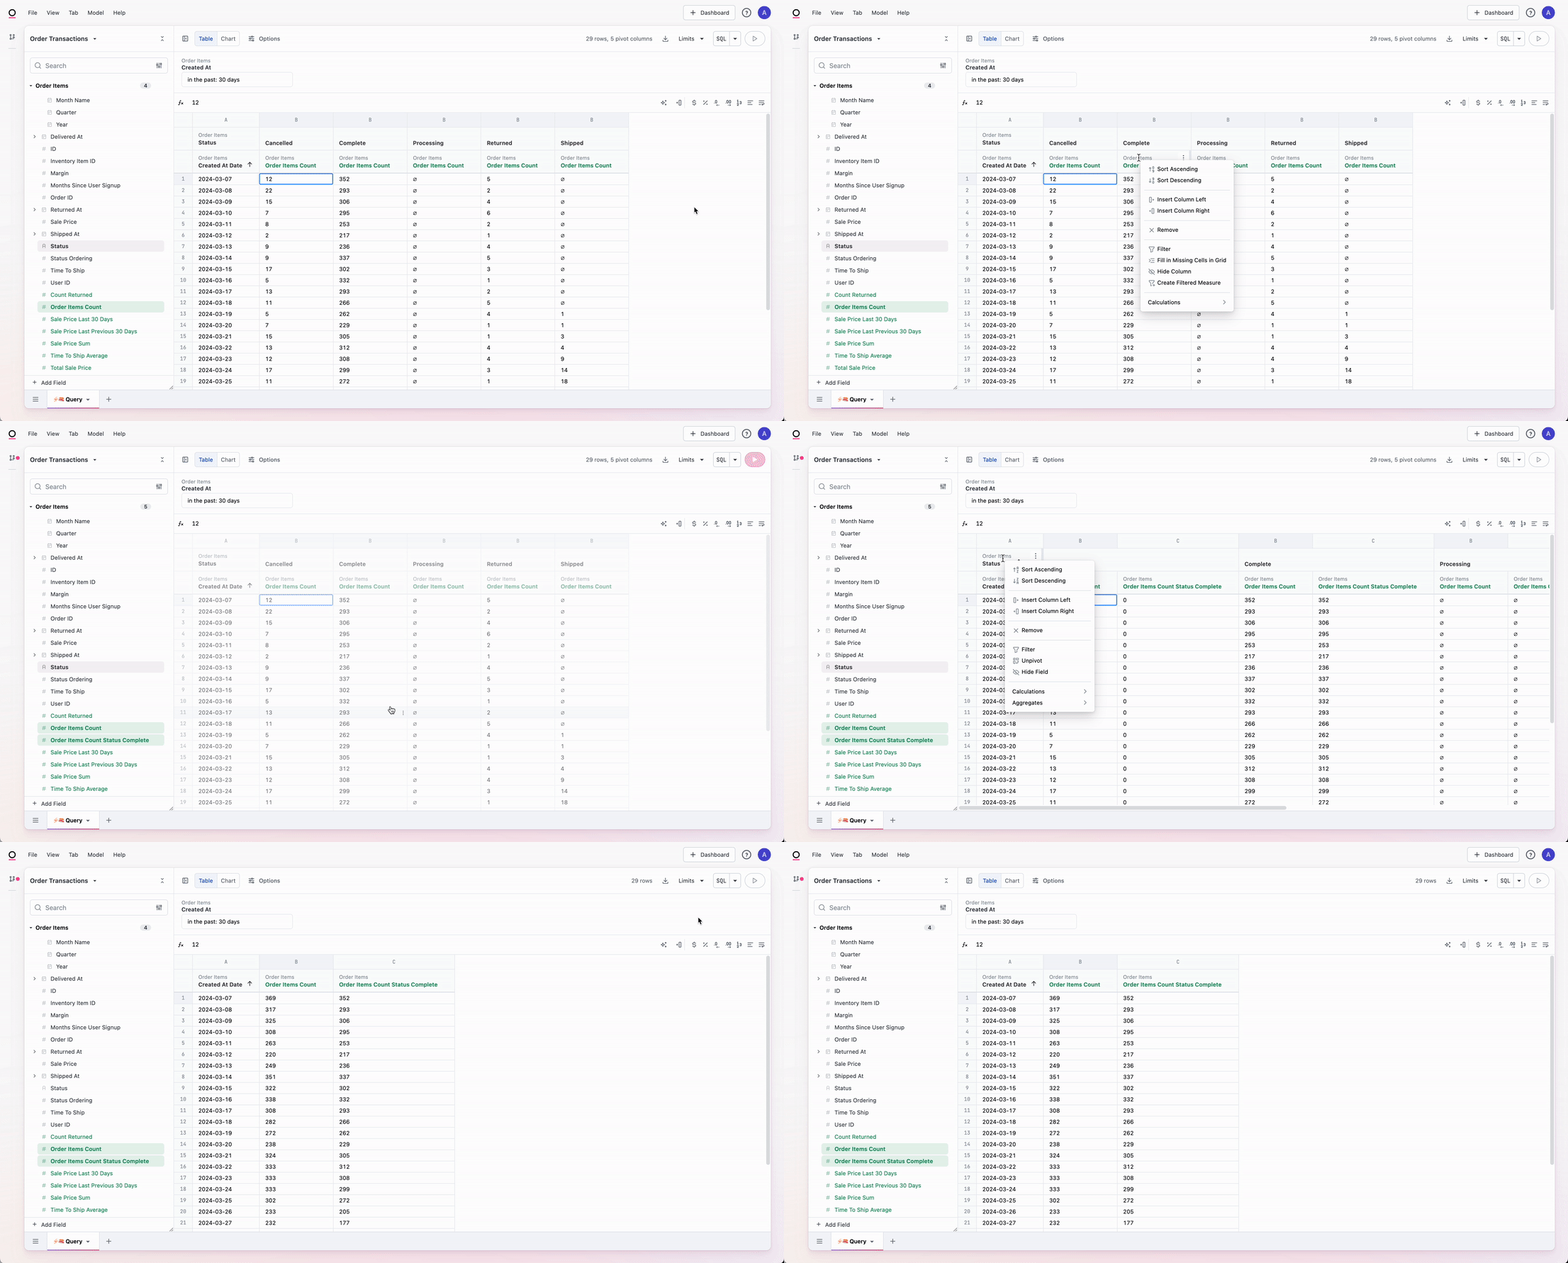
1. In a workbook query tab, create a query with a measure you want to filter.
2. Add a pivot on the dimension that contains the value you want to filter.
3. In the results table, right click on the measure you want to filter.
4. Select **Create filtered measure**.

<img src="https://mintcdn.com/omni-e7402367/Ueaby5Zd9SfduDZ-/guides/modeling/images/filtered-measure-option-1.gif?s=7a2a7fddfbb1303ed03650152edef554" alt="" width="1106" height="594" data-path="guides/modeling/images/filtered-measure-option-1.gif" />

## Option 2: Create a duplicate measure or a quick aggregate

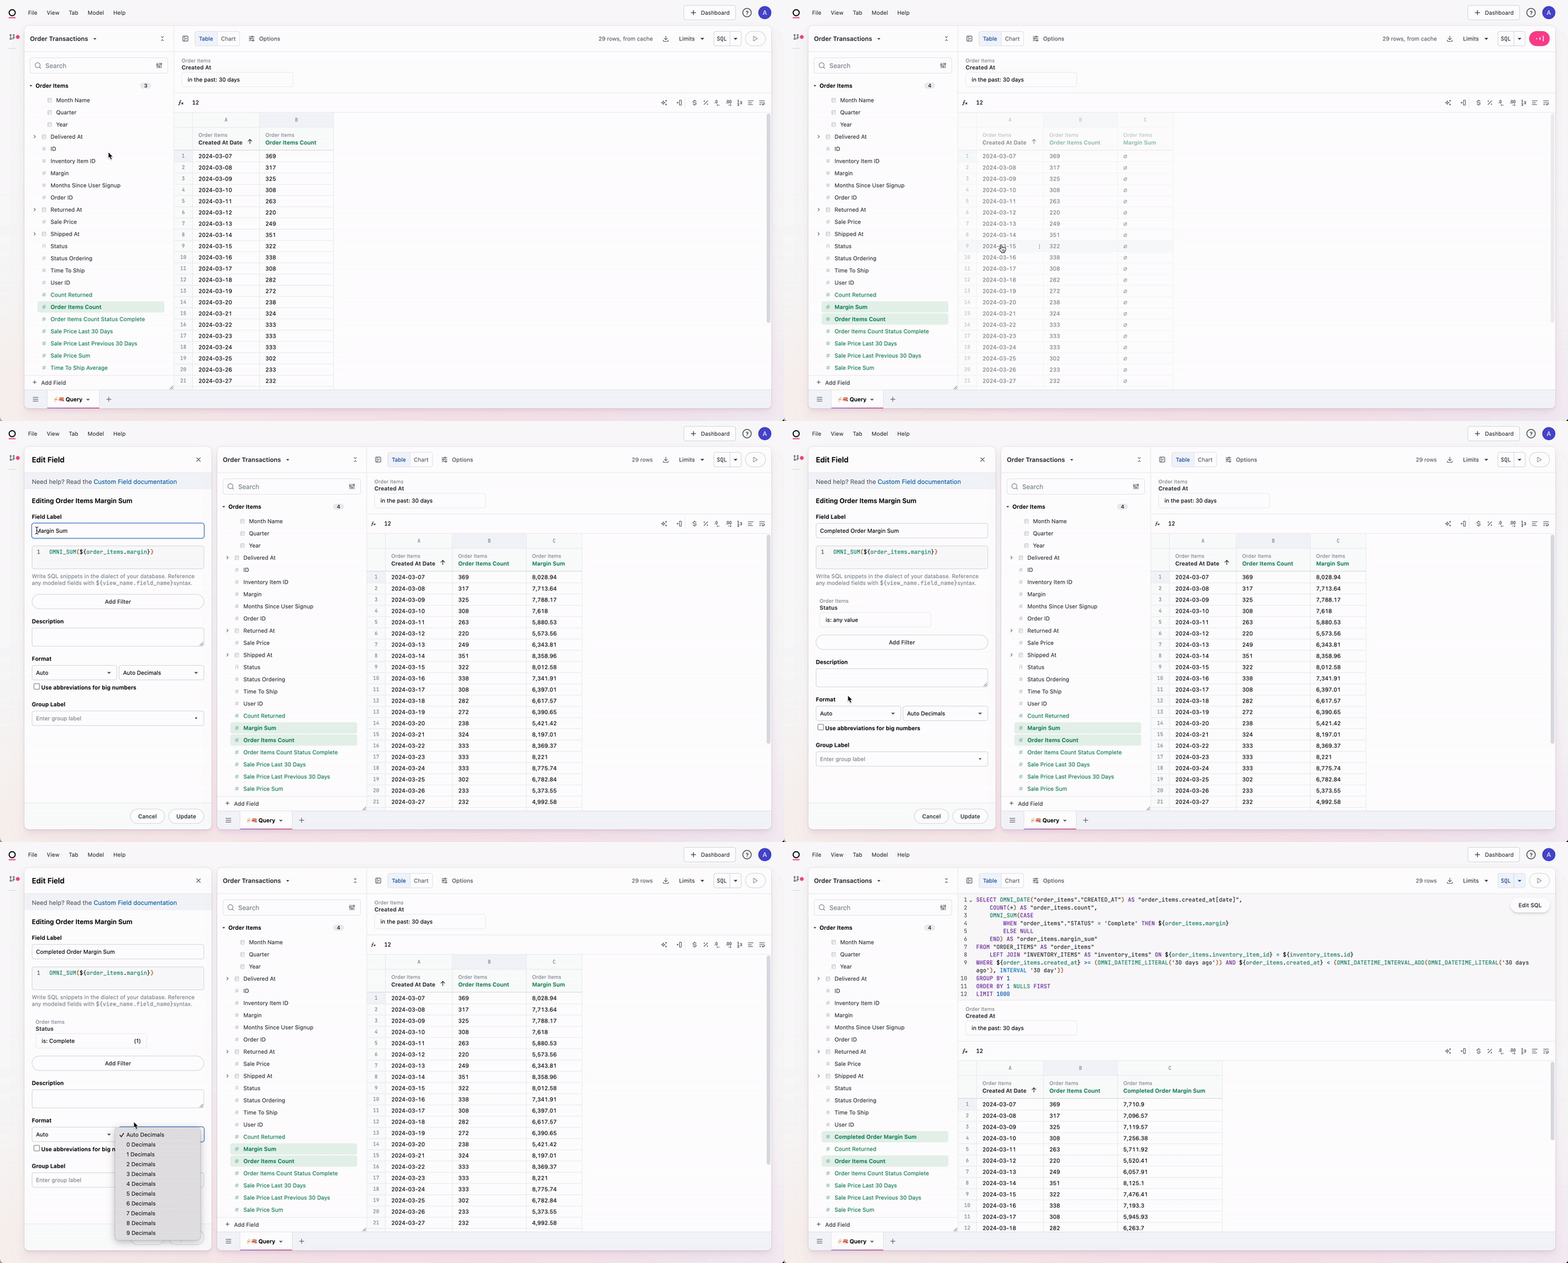
1. In a workbook query tab, create a query with a measure you want to filter.
2. Create a new measure. You can do this by either right clicking on the field and selecting **Aggregates** or by duplicating an existing measure.
3. In the field browser, right click on the measure you just created and select **Modeling > Edit**.
4. In the **Edit field** panel, click **Add filter** to apply a filter to the measure.
<img src="https://mintcdn.com/omni-e7402367/Ueaby5Zd9SfduDZ-/guides/modeling/images/filtered-measure-option-2.gif?s=a2adc67b9298193d9739d3403e5654a3" alt="" width="1106" height="595" data-path="guides/modeling/images/filtered-measure-option-2.gif" />

## Option 3: Use the model IDE

You can also create filtered measures in the model IDE using [filter syntax](/modeling/measures/parameters/filters):

```yaml theme={null}
order_items_count_status_complete:
  aggregate_type: count
  filters:
    status:
      is: Complete

margin_sum:
  sql: ${order_items.margin}
  label: Completed Order Margin Sum
  aggregate_type: sum
  filters:
    status:
      is: Complete
```
