> ## Documentation Index
> Fetch the complete documentation index at: https://docs.omni.co/llms.txt
> Use this file to discover all available pages before exploring further.

# Embed dbt data health tiles in Omni dashboards

> Embed dbt data health tiles (formerly status tiles) in Omni dashboards to show data freshness and quality at a glance.

export const categoryIcons = {
  'administration': 'lock',
  'api': 'terminal',
  'connections': 'database',
  'dashboards': 'table-columns',
  'embed': 'code',
  'errors': 'exclamation',
  'migration': 'angles-right',
  'modeling': 'wrench',
  'patterns': 'plus',
  'schedules & alerts': 'envelope',
  'visualizations': 'chart-column',
  'workbooks': 'book'
};

export const GuideSidebar = ({category, relatedLinks, updatedDate}) => {
  const [progress, setProgress] = React.useState(0);
  React.useEffect(() => {
    const sidebar = document.querySelector('.guide-sidebar');
    if (!sidebar) return;
    let container = sidebar.parentElement;
    while (container && !container.querySelector('.guide-header')) {
      container = container.parentElement;
    }
    if (container && !container.classList.contains('guide-page-layout')) {
      container.classList.add('guide-page-layout');
    }
  }, []);
  React.useEffect(() => {
    const handleScroll = () => {
      const scrollTop = window.scrollY;
      const docHeight = document.documentElement.scrollHeight - window.innerHeight;
      const scrollPercent = docHeight > 0 ? scrollTop / docHeight * 100 : 0;
      setProgress(Math.min(100, Math.max(0, scrollPercent)));
    };
    window.addEventListener('scroll', handleScroll, {
      passive: true
    });
    handleScroll();
    return () => window.removeEventListener('scroll', handleScroll);
  }, []);
  const icon = category ? categoryIcons[category.toLowerCase()] || 'book' : 'book';
  return <aside className="guide-sidebar">
      <div className="guide-sidebar-content">
        <a href="/guides" className="guide-sidebar-back">
          <Icon icon="arrow-left" iconType="solid" size={14} />
          <span>All guides</span>
        </a>

        <div className="guide-sidebar-section">
          <div className="guide-sidebar-label">Progress</div>
          <div className="guide-sidebar-progress">
            <div className="guide-mascot">
              <svg viewBox="0 0 688 690" width="48" height="48">
                <defs>
                  <clipPath id="progressClip">
                    <rect x="0" y={0} width="688" height={progress * 6.9} />
                  </clipPath>
                </defs>

                {}
                <path d="M343.67 1.5C542.684 1.5 685.84 149.351 685.84 344.84C685.84 540.328 542.685 688.18 343.67 688.18C144.655 688.18 1.5 540.318 1.5 344.84C1.50007 149.361 144.655 1.50005 343.67 1.5Z" fill="#FCFCF7" stroke="#FF5FA2" strokeWidth="3" />

                {}
                <path d="M343.67 0C143.81 0 0 148.55 0 344.84C0 541.13 143.81 689.68 343.67 689.68C543.53 689.68 687.34 541.14 687.34 344.84C687.34 148.54 543.53 0 343.67 0Z" fill="#FF5FA2" clipPath="url(#progressClip)" />

                {}
                <path d="M337.89 319.29C337.89 336.75 322.49 350.14 302.81 349.83C286.18 349.57 273.89 337.29 274.37 321.45C274.88 304.82 290.91 290.88 309.98 290.44C325.69 290.09 337.88 302.69 337.88 319.29H337.89Z" fill="#4D122C" />
                <path d="M566.17 319.29C566.17 336.75 550.77 350.14 531.09 349.83C514.46 349.57 502.17 337.29 502.65 321.45C503.16 304.82 519.19 290.88 538.26 290.44C553.97 290.09 566.16 302.69 566.16 319.29H566.17Z" fill="#4D122C" />
                <path d="M367.74 342.07C360.22 346.32 359.4 354.9 370.62 366.4C381.85 377.9 399.76 389.56 420.81 389.18C441.88 389.1 460.67 377.72 472.47 363.53C473.83 361.93 478.84 356.88 478.51 351.07C478.32 348.35 476.17 341.19 467.83 341.38C463.46 341.44 461.21 343.68 456.69 347.36C445.2 356.14 432.7 361.21 420.56 361.27C408.43 361.43 395.68 356.17 385.39 347.22C380.32 342.81 375.25 337.82 367.74 342.07Z" fill="#4D122C" />
              </svg>
            </div>
            <span className="guide-sidebar-progress-text">{Math.round(progress)}%</span>
          </div>
        </div>

        {category && <div className="guide-sidebar-section">
            <div className="guide-sidebar-label">Category</div>
            <div className="guide-sidebar-category">
              <Icon icon={icon} iconType="solid" size={14} />
              <span>{category}</span>
            </div>
          </div>}

        {updatedDate && <div className="guide-sidebar-section">
            <div className="guide-sidebar-label">Last updated</div>
            <div className="guide-sidebar-date">{updatedDate}</div>
          </div>}

        {relatedLinks && relatedLinks.length > 0 && <div className="guide-sidebar-section">
            <div className="guide-sidebar-label">Related</div>
            <ul className="guide-sidebar-links">
              {relatedLinks.map((link, index) => <li key={index}>
                  <a href={link.href}>{link.title}</a>
                </li>)}
            </ul>
          </div>}
      </div>
    </aside>;
};

export const GuideTitle = ({title}) => {
  return <div className="guide-header">
      <h1 className="guide-title">{title}</h1>
    </div>;
};

<GuideSidebar
  categoryIcons={categoryIcons}
  category="dashboards"
  updatedDate="August 2026"
  relatedLinks={[
{ title: "dbt", href: "/integrations/dbt" },
{ title: "Generate dbt exposures", href: "/integrations/dbt/exposures" },
{ title: "Dashboard text tiles", href: "/visualize-present/dashboards/text-markdown" }
]}
/>

<GuideTitle title="Embed dbt data health tiles in Omni dashboards" />

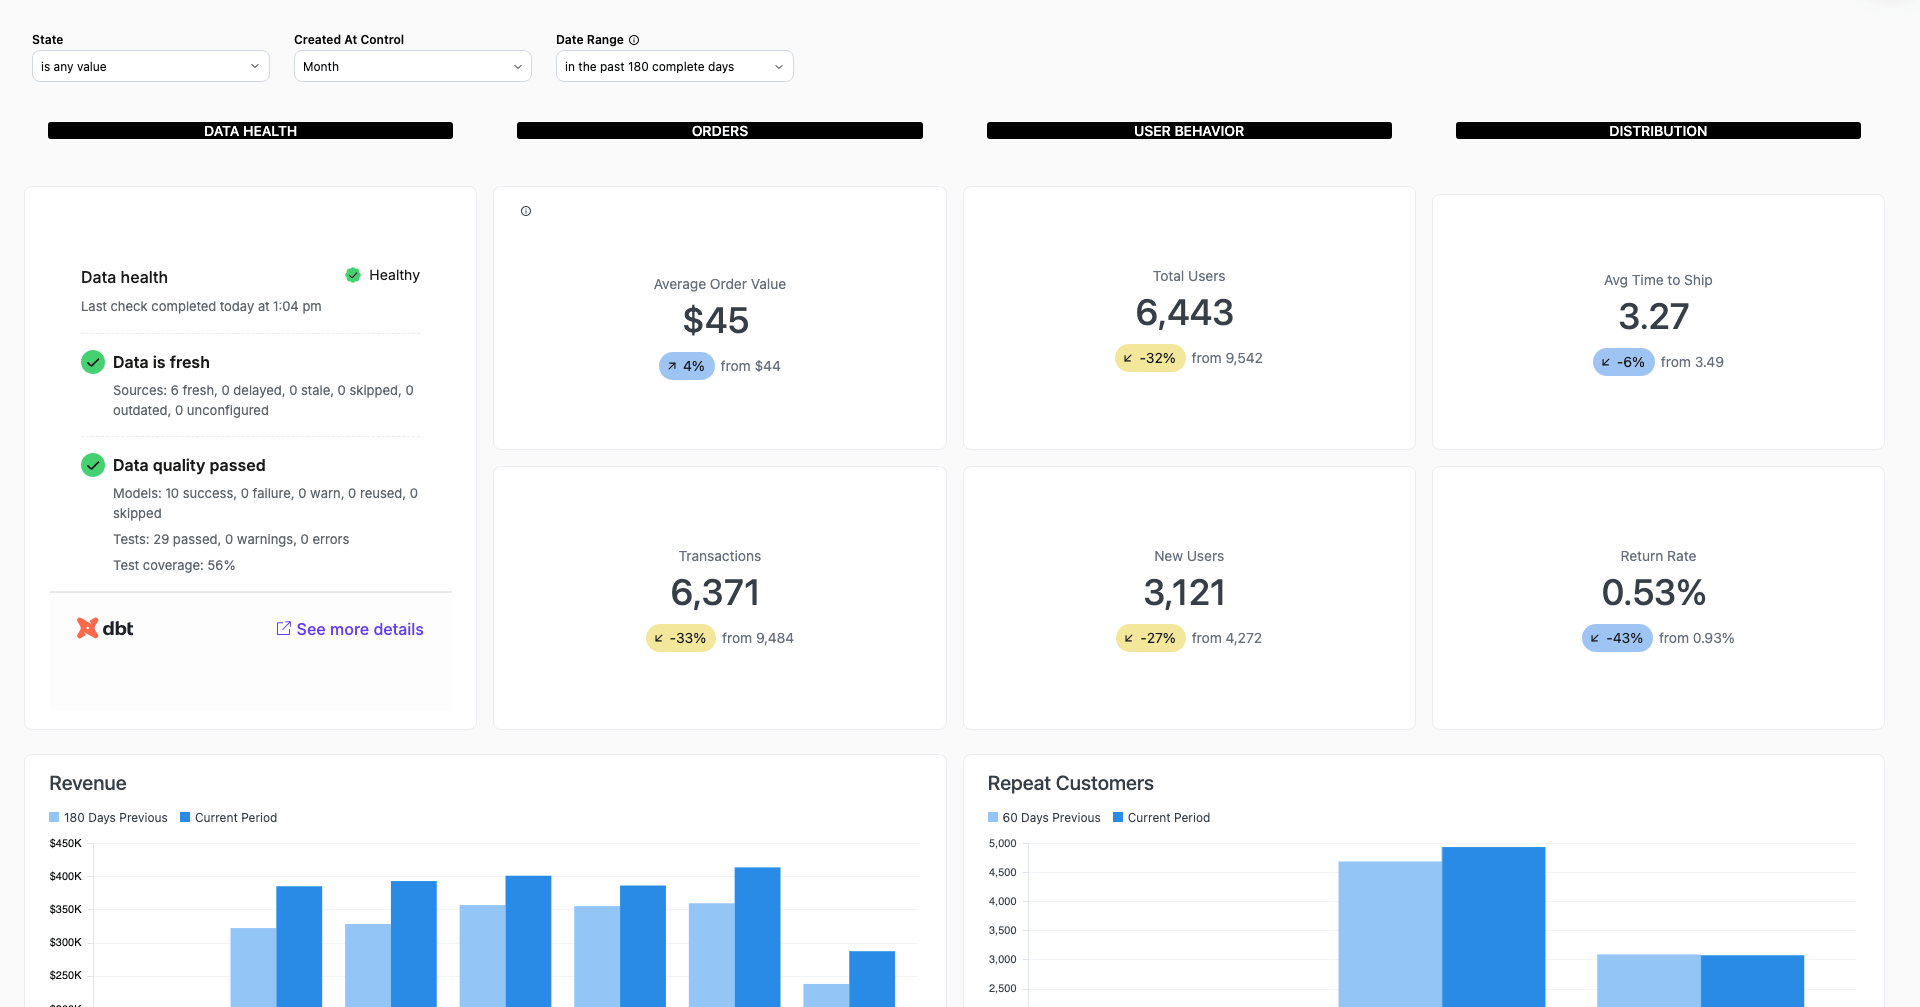
[dbt data health tiles](https://docs.getdbt.com/docs/explore/data-tile) - formerly called dashboard status tiles - display the freshness and quality of the data behind a dashboard. Embedding a health tile in an Omni dashboard gives your stakeholders at-a-glance confirmation that the data they're looking at is fresh and passing quality checks, with a deep link into dbt Catalog for investigating issues.

In Omni, health tiles are embedded using an iframe in a [text (Markdown) tile](/visualize-present/dashboards/text-markdown).

<Frame caption="">
  <img src="https://mintcdn.com/omni-e7402367/pr4yrfOUAKRCoFL0/guides/dashboards/images/dbt-health-tile.png?fit=max&auto=format&n=pr4yrfOUAKRCoFL0&q=85&s=68e3fcdeaa30a0680b61a2442b21ef47" alt="An Omni dashboard with an embedded dbt data health tile showing a Healthy status, with passing data freshness and data quality checks and a link to see more details in dbt" width="1920" height="1007" data-path="guides/dashboards/images/dbt-health-tile.png" />
</Frame>

Each tile displays the health signals dbt tracks for the exposure backing your dashboard:

* **Freshness status**, such as `Data is fresh`, based on source freshness checks
* **Quality status**, such as `Data quality passed`, based on test results
* A breakdown of upstream source and model health, with links into dbt Catalog for debugging

## Requirements

To follow the steps in this guide, you'll need:

* **Permission to edit the Omni dashboard** where you'll add the tile
* **For dbt**:
  * **A dbt account on the Enterprise or Enterprise+ plan.** Refer to the [dbt data health tile documentation](https://docs.getdbt.com/docs/explore/data-tile) for current plan requirements.
  * **A dbt exposure for your dashboard** with `type: dashboard`, defined manually or [pushed from Omni](/integrations/dbt/exposures)
  * **Source freshness enabled** in the dbt job that generates the exposure
  * **A Metadata Only service token**, created by a dbt account admin in **Account Settings > API tokens > Service tokens**
    <Note>
      This token will be part of the iframe URL, so anyone who can view the dashboard's Markdown tile source can see it. Only use a **Metadata Only** service token, which limits access to dbt metadata and can't modify your dbt account.
    </Note>

<Steps titleSize="h2">
  <Step title="Copy the iframe snippet from dbt">
    1. In dbt, navigate to the exposure for your dashboard.
    2. Copy the embed snippet. It will look similar to the following:

       ```html wrap theme={null}
       <iframe src='https://<YOUR_ACCOUNT_PREFIX>.metadata.<REGION>.dbt.com/exposure-tile?uniqueId=exposure.<EXPOSURE_NAME>&environmentType=production&environmentId=<ENV_ID_NUMBER>&token=<YOUR_METADATA_TOKEN>' title='Exposure status tile'></iframe>
       ```
    3. Replace the placeholder URL values (e.g., `<YOUR_ACCOUNT_PREFIX>`). Refer to the [dbt documentation](https://docs.getdbt.com/docs/explore/data-tile) for details on each URL parameter.
  </Step>

  <Step title="Add the iframe to an Omni dashboard">
    1. In Omni, navigate to the dashboard you want to work with.
    2. Click **Edit** to enter draft mode.
    3. Add a [text tile](/visualize-present/dashboards/text-markdown) to the dashboard.
    4. Paste the iframe snippet from step 1 into the Markdown editor. To make the dbt health tile fill dashboard text tile instead of rendering at a fixed size, wrap the iframe in a positioned container:

       ```html wrap theme={null}
       <div style="position:relative;width:100%;height:100%;">
         <iframe
           style="position:absolute;inset:0;width:100%;height:100%;border:0;"
           src="https://YOUR_ACCOUNT_PREFIX.metadata.REGION.dbt.com/exposure-tile?uniqueId=exposure.EXPOSURE_NAME&environmentType=production&environmentId=ENV_ID_NUMBER&token=YOUR_METADATA_TOKEN"
           title="Exposure status tile"
           scrolling="no"></iframe>
       </div>
       ```
    5. When finished, publish the dashboard.
  </Step>
</Steps>

## Troubleshooting

<AccordionGroup>
  <Accordion title="The tile doesn't render or appears blank">
    * **Check the URL parameters**. The exposure `uniqueId`, `environmentId`, and token must all be valid. Regenerate the snippet from dbt if you're unsure.
    * **Check the token type**. The token must be a **Metadata Only** service token.
    * **Check for sandboxing limitations**. Omni applies [sandboxing restrictions](https://developer.mozilla.org/en-US/docs/Web/HTML/Element/iframe#:~:text=to%20insecure%20origins.-,sandbox,-Controls%20the%20restrictions) when rendering iframes, which can make some website features unavailable.
  </Accordion>

  <Accordion title="The tile renders but shows no health data">
    * **Verify the exposure exists** in the environment referenced by the URL and has `type: dashboard`.
    * **Verify source freshness is enabled** in the dbt job that generates the exposure. Without it, freshness status can't be reported.
  </Accordion>
</AccordionGroup>

## Next steps

* [Push exposures to dbt](/integrations/dbt/exposures) — Generate the dbt exposures that health tiles are built on directly from your Omni dashboards.
* [Markdown visualizations](/visualize-present/visualizations/types/markdown) — Learn about iframes and other options available in Markdown visualizations.
