> ## Documentation Index
> Fetch the complete documentation index at: https://docs.omni.co/llms.txt
> Use this file to discover all available pages before exploring further.

<AgentInstructions>

## Submitting Feedback

If you encounter incorrect, outdated, or confusing documentation on this page, submit feedback:

POST https://docs.omni.co/feedback

```json
{
  "path": "/guides/dashboards/calculated-field-filter",
  "feedback": "Description of the issue"
}
```

Only submit feedback when you have something specific and actionable to report.

</AgentInstructions>

# Filter dashboard charts with calculated fields

> Create a dashboard filter using a calculated field in the underlying query.

export const categoryIcons = {
  'administration': 'lock',
  'api': 'terminal',
  'connections': 'database',
  'dashboards': 'table-columns',
  'embed': 'code',
  'errors': 'exclamation',
  'modeling': 'wrench',
  'patterns': 'plus',
  'schedules & alerts': 'envelope',
  'visualizations': 'chart-column',
  'workbooks': 'book'
};

export const GuideSidebar = ({category, relatedLinks, updatedDate}) => {
  const [progress, setProgress] = React.useState(0);
  React.useEffect(() => {
    const sidebar = document.querySelector('.guide-sidebar');
    if (!sidebar) return;
    let container = sidebar.parentElement;
    while (container && !container.querySelector('.guide-header')) {
      container = container.parentElement;
    }
    if (container && !container.classList.contains('guide-page-layout')) {
      container.classList.add('guide-page-layout');
    }
  }, []);
  React.useEffect(() => {
    const handleScroll = () => {
      const scrollTop = window.scrollY;
      const docHeight = document.documentElement.scrollHeight - window.innerHeight;
      const scrollPercent = docHeight > 0 ? scrollTop / docHeight * 100 : 0;
      setProgress(Math.min(100, Math.max(0, scrollPercent)));
    };
    window.addEventListener('scroll', handleScroll, {
      passive: true
    });
    handleScroll();
    return () => window.removeEventListener('scroll', handleScroll);
  }, []);
  const icon = category ? categoryIcons[category.toLowerCase()] || 'book' : 'book';
  return <aside className="guide-sidebar">
      <div className="guide-sidebar-content">
        <a href="/guides" className="guide-sidebar-back">
          <Icon icon="arrow-left" iconType="solid" size={14} />
          <span>All guides</span>
        </a>

        <div className="guide-sidebar-section">
          <div className="guide-sidebar-label">Progress</div>
          <div className="guide-sidebar-progress">
            <div className="guide-mascot">
              <svg viewBox="0 0 450 450" width="48" height="48">
                <defs>
                  <clipPath id="progressClip">
                    <rect x="0" y={450 - progress * 4.5} width="450" height={progress * 4.5} />
                  </clipPath>
                  <linearGradient id="blobbyGradient" x1="55.9753" y1="0" x2="492.197" y2="169.724" gradientUnits="userSpaceOnUse">
                    <stop stopColor="#BCA2F3" />
                    <stop offset="0.572917" stopColor="#FF7AA2" />
                    <stop offset="1" stopColor="#F3D4A2" />
                  </linearGradient>
                </defs>

                {}
                <circle cx="223.901" cy="223.901" r="213.901" transform="matrix(-0.999988 -0.0049013 0.00491945 -0.999988 447.797 449.992)" fill="#FAFAFA" stroke="#480B38" strokeWidth="20" />

                {}
                <circle cx="223.901" cy="223.901" r="213.901" transform="matrix(-0.999988 -0.0049013 0.00491945 -0.999988 447.797 449.992)" fill="url(#blobbyGradient)" stroke="#480B38" strokeWidth="20" clipPath="url(#progressClip)" />

                {}
                <path d="M310.41 195.084C310.41 200.052 301.362 212.472 284.328 212.472C266.585 212.472 258.246 201.294 258.246 195.912" stroke="#480B38" strokeWidth="17.3883" strokeMiterlimit="1.33344" strokeLinecap="round" />
                <circle cx="21.168" cy="21.168" r="21.168" transform="matrix(-1 0 0 1 388.658 169.001)" fill="#480B38" />
                <circle cx="21.168" cy="21.168" r="21.168" transform="matrix(-1 0 0 1 223.467 169.001)" fill="#480B38" />
              </svg>
            </div>
            <span className="guide-sidebar-progress-text">{Math.round(progress)}%</span>
          </div>
        </div>

        {category && <div className="guide-sidebar-section">
            <div className="guide-sidebar-label">Category</div>
            <div className="guide-sidebar-category">
              <Icon icon={icon} iconType="solid" size={14} />
              <span>{category}</span>
            </div>
          </div>}

        {updatedDate && <div className="guide-sidebar-section">
            <div className="guide-sidebar-label">Last updated</div>
            <div className="guide-sidebar-date">{updatedDate}</div>
          </div>}

        {relatedLinks && relatedLinks.length > 0 && <div className="guide-sidebar-section">
            <div className="guide-sidebar-label">Related</div>
            <ul className="guide-sidebar-links">
              {relatedLinks.map((link, index) => <li key={index}>
                  <a href={link.href}>{link.title}</a>
                </li>)}
            </ul>
          </div>}
      </div>
    </aside>;
};

export const GuideTitle = ({title}) => {
  return <div className="guide-header">
      <h1 className="guide-title">{title}</h1>
    </div>;
};

<GuideSidebar
  categoryIcons={categoryIcons}
  category="dashboards"
  updatedDate="January 2026"
  relatedLinks={[
{ title: "Working with dashboard filters", href: "/visualize-present/dashboards/filters" },
{ title: "Calculations", href: "/analyze-explore/calculations" }
]}
/>

<GuideTitle title="Filter dashboard charts with calculated fields" />

Instead of hardcoding row limits on charts, you can let dashboard viewers control how many items they see. For example, users could switch between viewing the top 10, top 15, or top 20 products by sales.

This guide walks through creating a dynamic Top N filter using a [`RANK`](/analyze-explore/calculations/math-number#rank) calculation and dashboard filter mapping.

## Requirements

* A dashboard that:
  * You have the ability to edit
  * Has at least one visualization tile
* Familiarity with [calculations](/analyze-explore/calculations)

## Steps

<Steps>
  <Step title="Add a calculated field to the query">
    In a **draft** workbook, add the calculation to the query that powers your chart. In this example, we added a `RANK` calculation that uses the value of the `Total Sold` column to rank results:

    <img src="https://mintcdn.com/omni-e7402367/RPLh49E374uXlNxz/guides/dashboards/images/calc-filter-workbook.png?fit=max&auto=format&n=RPLh49E374uXlNxz&q=85&s=0a60fd720e0477d87f520a4b3aeed127" alt="" width="620" height="401" data-path="guides/dashboards/images/calc-filter-workbook.png" />

    **Before continuing**, remove the row limit from the query if one is applied. The filter you're creating will control this instead.

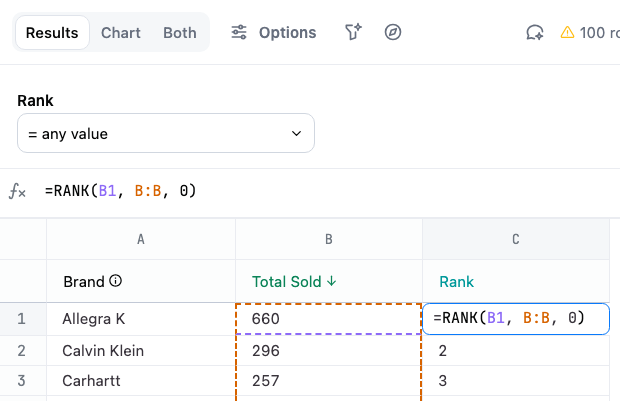
    You can add the calculation manually or by using the Workbook Agent. Refer to the [Table calculations guide](/analyze-explore/calculations#create-table-calculations) if you need a refresher.
  </Step>

  <Step title="Create a numeric dashboard filter">
    1. Navigate to the dashboard by clicking the **Dashboard** button in the top right corner of the page.
    2. Click **Add > Filter**.
    3. For the filter source field, select any numeric field included in the query. In this example, we selected the `Total Sold` field.

       **Note**: This field only establishes the filter **type** - you'll map it to the calculation field in the next step.
    4. Give the filter a descriptive label.
  </Step>

  <Step title="Map the filter to the calculation">
    1. While still in the **Edit filter** panel, scroll to the **Filter mapping** section.

    2. Deselect tiles that don't contain the calculation. The filter should only apply to those that have the calculation.

    3. Search for the name of the calculation, or scroll down to the **Calculations** group. Select the calculation:
           <img src="https://mintcdn.com/omni-e7402367/RPLh49E374uXlNxz/guides/dashboards/images/calc-filter-select-calc.png?fit=max&auto=format&n=RPLh49E374uXlNxz&q=85&s=d14fbbddff574480f03dc94ffc7229ce" alt="" width="250" height="357" data-path="guides/dashboards/images/calc-filter-select-calc.png" />

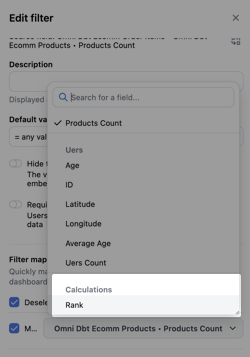
    4. Verify that the tile is mapped to the calculation:

           <img src="https://mintcdn.com/omni-e7402367/RPLh49E374uXlNxz/guides/dashboards/images/calc-filter-config.png?fit=max&auto=format&n=RPLh49E374uXlNxz&q=85&s=80697a59389dd73eacc43f23f7a5871e" alt="" width="315" height="481" data-path="guides/dashboards/images/calc-filter-config.png" />

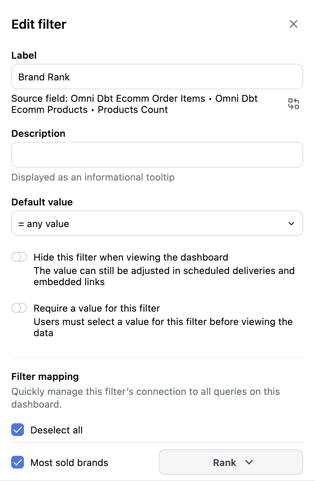
    5. Click **Done** to save the filter.

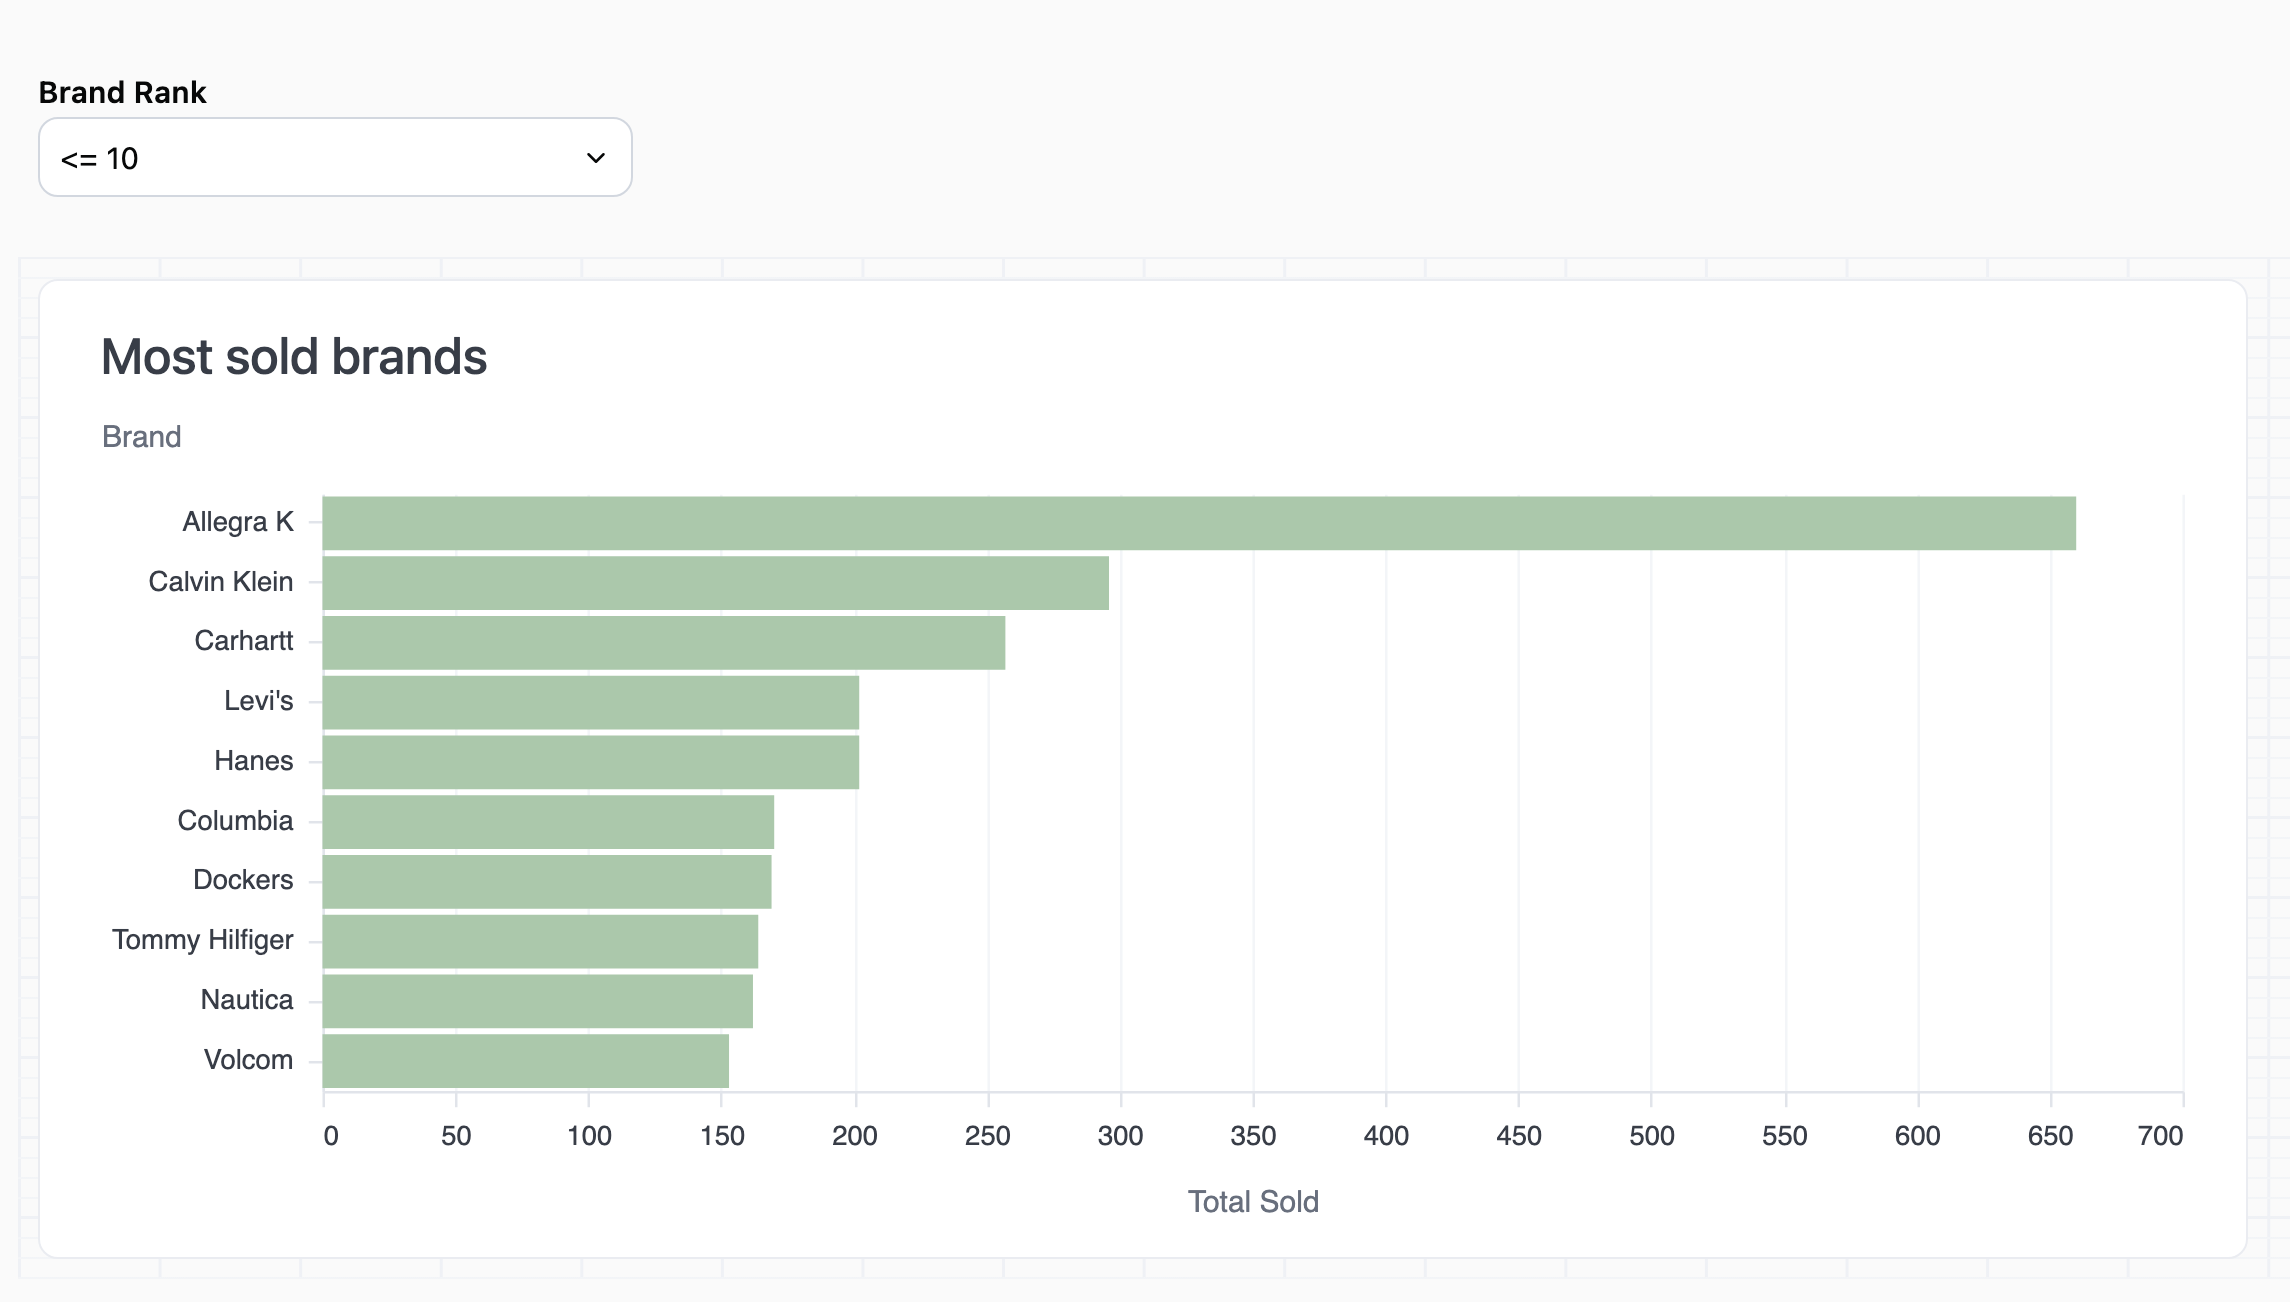
    The filter will be added to the dashboard:

    <img src="https://mintcdn.com/omni-e7402367/RPLh49E374uXlNxz/guides/dashboards/images/calc-filter-final.png?fit=max&auto=format&n=RPLh49E374uXlNxz&q=85&s=7e660e2d48a73a863e9df722b56510e9" alt="" width="2290" height="1302" data-path="guides/dashboards/images/calc-filter-final.png" />
  </Step>

  <Step title="Publish your changes">
    The last step is to publish the changes to the document. This will make the filter available for the viewers of your dashboard.

    Click the **Publish** button near the top right corner of the page.

    <Note>
      If you don't see the **Publish** button, your instance settings may not allow publishing without using a branch. Refer to the [Developing and publishing content guides](/content/develop) for more information.
    </Note>
  </Step>
</Steps>
