
Fancy subtotal table

The code for these examples can be used in the Markdown visualization to create to create different styles for displaying a simple table with subtotals.

Subtotal table with category color dots

This table puts the category labels and their subtotals as the first row for the category. Sub-categories are listed in smaller text below.

Setup

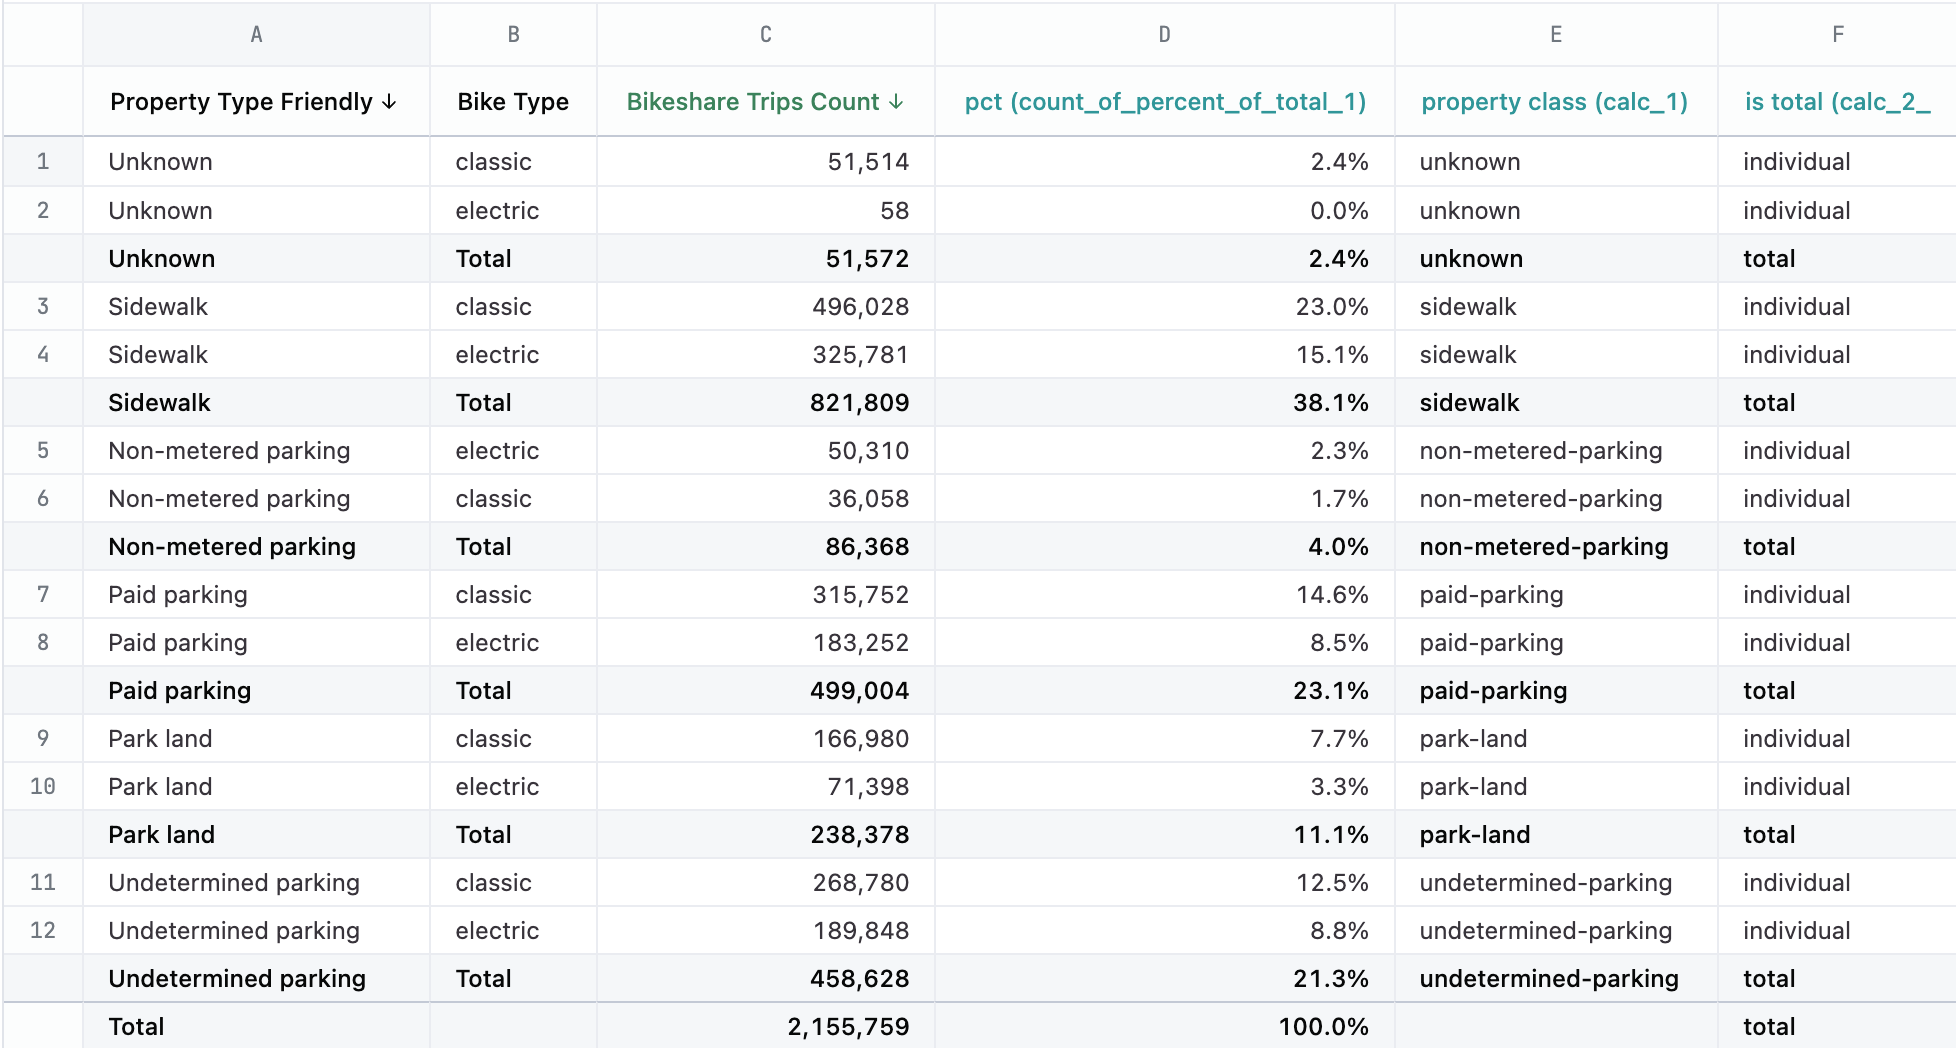
Your query must have 2 dimensions (the primary category and the sub category) and a measure to total. The rest of the columns are calculations to get the percentages and provide some styling information to the markdown.

Sort the results by the primary category and enable subtotals from the primary category's triple-dot menu. Use secondary sorts to control how the sub-categories are ordered. You can do a secondary sort by shift-clicking on the column header.

The following table describes the fields in the result set and their purpose.

Note: The labels of each calculation includes the calculation's ID in parentheses. This hopefully helps connect the mustache references in the markdown to the correct column of data. Depending on the order in which you create your calculations, these IDs may be different.

Column descriptions

ColNameCalculation formulaPurpose
AProperty type friendlyquery dataPrimary category with subtotals enabled
BBike Typequery dataSub-category
CBikeshare Trips Countquery datametric to total
Dpct (count_of_percent_total_1)=C1 / SUM(C:C)To display the overall % share of each category to the total
Eproperty class (calc_1)=SUBSTITUTE(LOWER(A1), " ", "-")making a css-friendly class name for the primary category to use for coloring
Fis total (calc_2)=IF(B1 <> "", "individual", "total")css-friendly class name to identify the row in the results as a total row or not

Example code

View example code
<style>
.suggestions-breakdown {
--color-non-metered-parking: #6985FF;
--color-paid-parking: #13D3DF;
--color-park-land: #FFA2F5;
--color-sidewalk: #1D4CFF;
--color-undetermined-parking: #EE46D3;
--color-unknown: #9AA2AF;

padding-right: 16px;

& h3 {
margin-top: 0;
}
& ul {
list-style: none;
margin: 0;
padding: 0;
display: flex;
gap: 4px;
flex-direction: column-reverse; /* puts total rows before sub-category */
}
& li {
list-style: none;
margin: 0;
padding: 0;
display: flex;
flex-direction: row;
gap: 16px;

& .type {
display: flex;
flex-direction: row;
gap: 8px;
align-items: center;
}

& .value {
text-align: right;
flex: 1;
}
& .percent {
text-align: right;
width: 120px;
}
}
& li.total {
font-weight: 500;
font-size: var(--font-sm);
padding-top: 12px;
border-top: 1px solid var(--color-border1);

& .category {
visibility: hidden;
}

& .indicator {
display: inline-block;
background: var(--color-other);
width: 8px;
height: 8px;
border-radius: var(--radius-round);
}
}

& li.individual {
color: var(--color-text2);
font-size: var(--font-xs);

& .type {
visibility: hidden;
font-size: 0px;

& .indicator {
display: none;
}
}
& .category {
text-transform: capitalize;
}
& .percent {
visibility: hidden;
}
}

& li.total + li.individual {
padding-bottom: 12px;
}
& li.heading {
order: 50;
font-size: var(--font-xs);
color: var(--color-text2);
text-transform: uppercase;
padding-bottom: 4px;

& span:first-of-type {
flex: 1 1 0;
}
& span + span {
text-align: right;
width: 120px;
}
}
}
</style>
<article class="suggestions-breakdown">
<h3>Bike trip breakdown</h3>
<ul>
<li class="heading">
<span>Type</span>
<span>Total</span>
<span>Percent</span>
</li>
{{#result}}
<li class="{{calc_2.value_static}} {{calc_2.value_static}}">
<span class="type">
<span class="indicator" style="background-color: var(--color-{{calc_1.value_static}})"></span>
<span>{{bikeshare_start_stations.property_type_friendly.value}}</span>
</span>
<span class="category">{{bikeshare_trips.bike_type.value}}</span>
<span class="value">{{bikeshare_trips.count.value}}</span>
<span class="percent">{{count_percent_of_total_1.value}}</span>
</li>
{{/result}}
</ul>
</article>