
Repeating pie charts

The code for this example can be used in the Markdown visualization to create a series of pie charts, one for each row in your results. Pies will automatically adjust size and wrap to the next line.

Setup

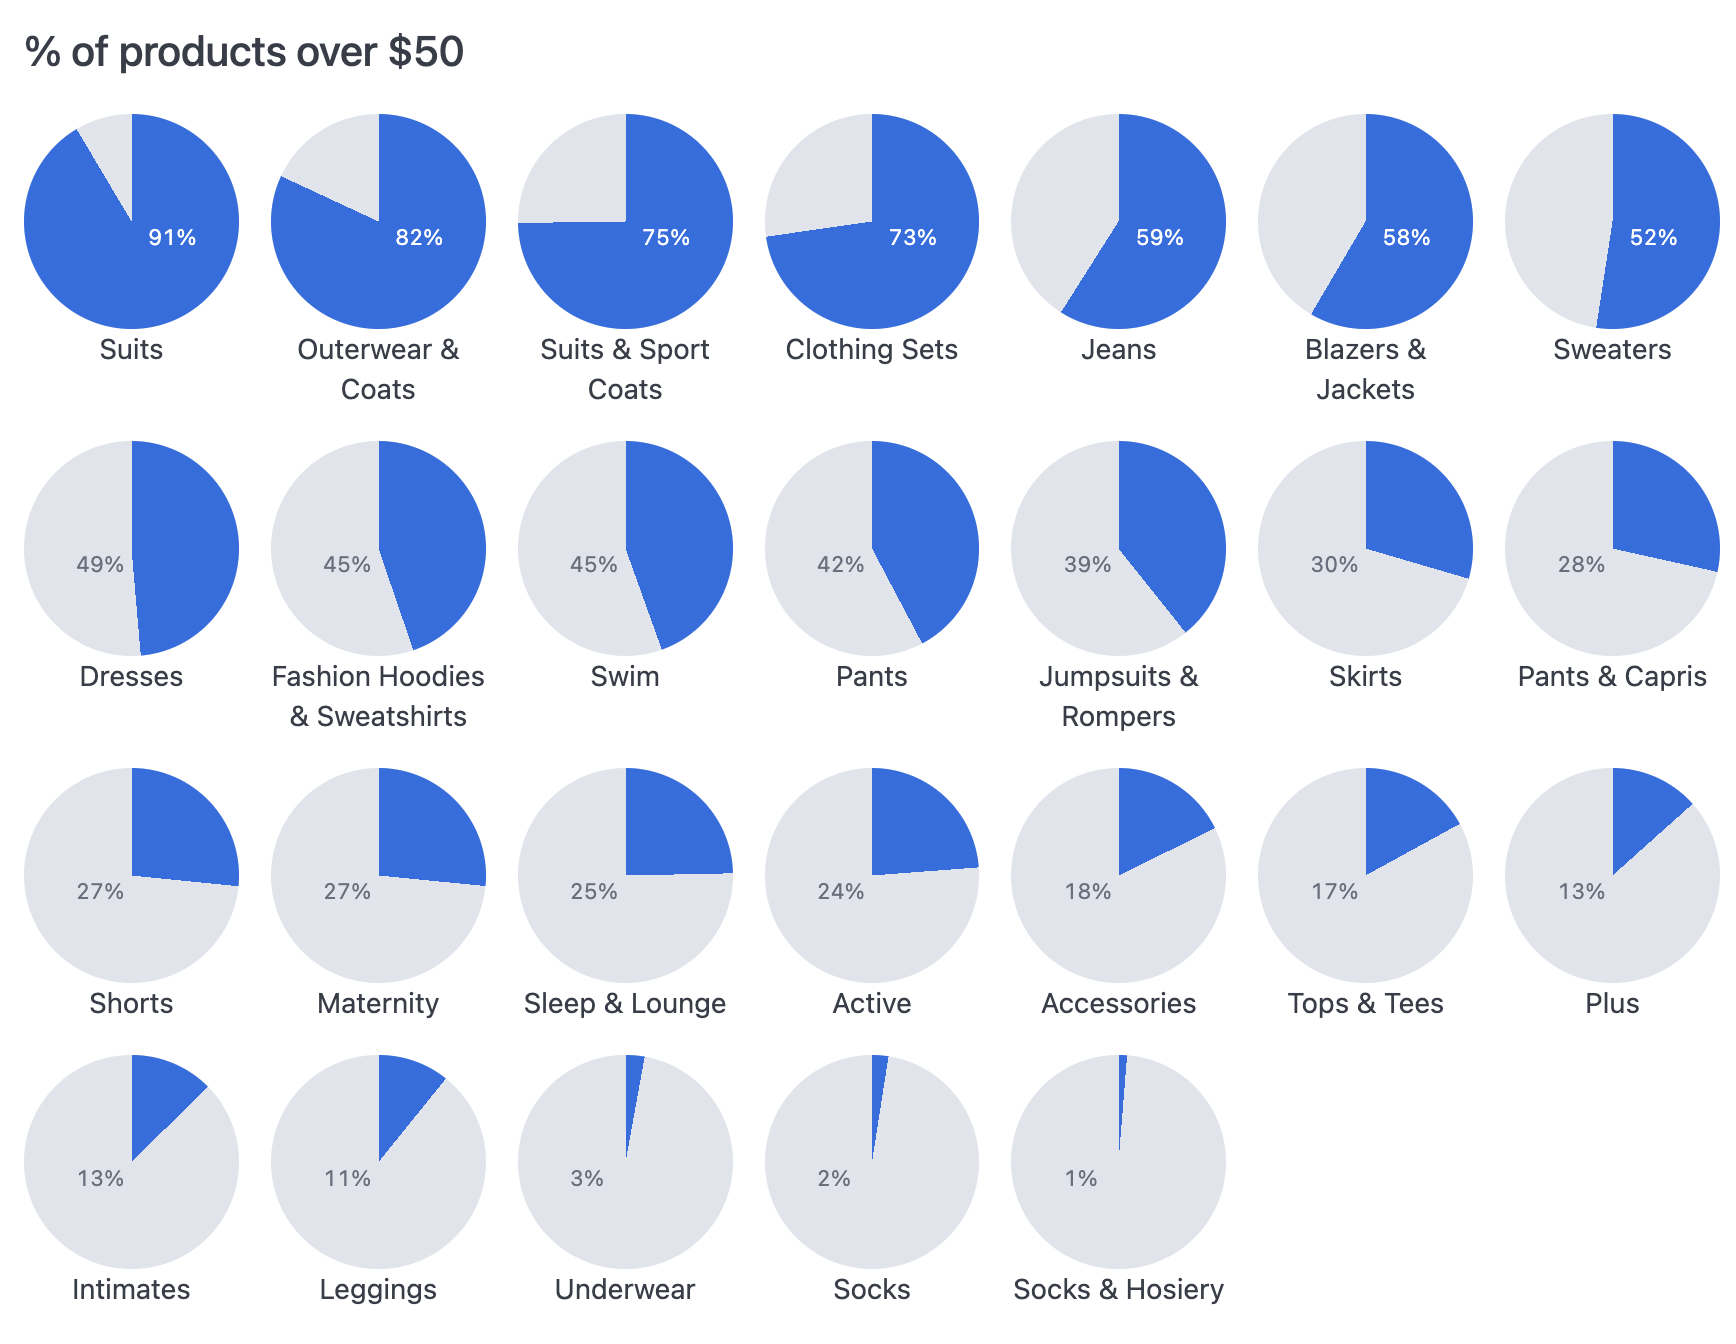
These charts use the Mustache iterator syntax to draw a shape for each row in the results. Your query should have a dimension that determines the number of pies and their labels and the values for the numerator and denominator to calculate the percentage fill. Then you'll need to add a few calculations. The following table explains each field used in the example, including the calculation formulas.

ColNameDescription or formulaPurpose
ACategoryquery fielddetermines number of pies to make and their labels
BProducts Countquery fielddenominator for % calculation
CProducts over $50query fieldnumerator for % calculation
D% over $50 (calc_1)=C1 / B1calculation for filling pie, label
Erotation (calc_4)=D1 * 360calculation to get the degrees for drawing pie slice
Flabel pos (calc_5)=IF(D1 < 0.5, "left", "right")calculation to help position and color the label

Example code

<style>
h3 {
margin-top: 0;
}
.pie-party {
--plate-color: var(--color-border2);
--slice-color: var(--color-info);

& ul {
list-style: none;
margin: 0;
padding: 0;
display: grid;
grid-template-columns: repeat(auto-fit, minmax(100px, 1fr));
gap: var(--size4);
}
& li {
list-style: none;
margin: 0;
padding: 0;
}
& p {
margin: 0;
padding: 0;
}

.pie-plate {
aspect-ratio: 1/1;
background-color: var(--plate-color);
margin: 0 auto;
border-radius: 50%;
display: flex;
align-items: center;
justify-content: center;
width: 100%;
overflow: hidden;
}
.pie-slice {
width: 100%;
height: 100%;
position: relative;
list-style: none;
margin: 0;
padding: 0;

& span {
display: block;
font-size: var(--font-xxs);
font-variant-numeric: tabular-nums;
width: 4ch;
padding-right: 2px;
line-height: var(--line-height-xxs);
position: absolute;

&.left {
text-align: left;
top: 50%;
right: 50%;
color: var(--color-text2);
}

&.right {
top: 50%;
left: calc(50% + 1ch);
text-align: right;
color: var(--color-text-inverse);
; }
}
}
& p.label {
text-align: center;
}
}
</style>

<article class="pie-party">
<h3>% of products over $50</h3>
<ul>
{{#result}}
<li>
<div class="pie-plate"">
<p class="pie-slice" style="background-image: conic-gradient(from 0deg, var(--slice-color) {{calc_4.value}}deg, transparent 0)">
<span class="{{calc_5.value}}">{{calc_1.value}}</span>
</p>
</div>
<p class="label">{{products.category.value}}</p>
</li>
{{/result}}

</ul>
</article>